Bitcoin
NFT sales drop 9.6% to $160.9m, Ethereum and Bitcoin network sales plunge
Published
5 hours agoon
By
admin
As Bitcoin surges toward the $100,000 mark, touching a new all-time high of $99,655.50, the non-fungible token (NFT) sales volume has shown a drop of 9.6% to $160.9 million.
The global cryptocurrency market capitalization has continued to surge, reaching $3.35 trillion from last week’s $3.03 trillion. This marks a 2% increase over the last day, with Bitcoin (BTC) currently trading at $98,620.
The last week’s NFT sales volume stood at $178.8 million. However, according to recent data from CryptoSlam, the NFT market has seen a pullback.
- NFT sales volume decreased to $160.9 million
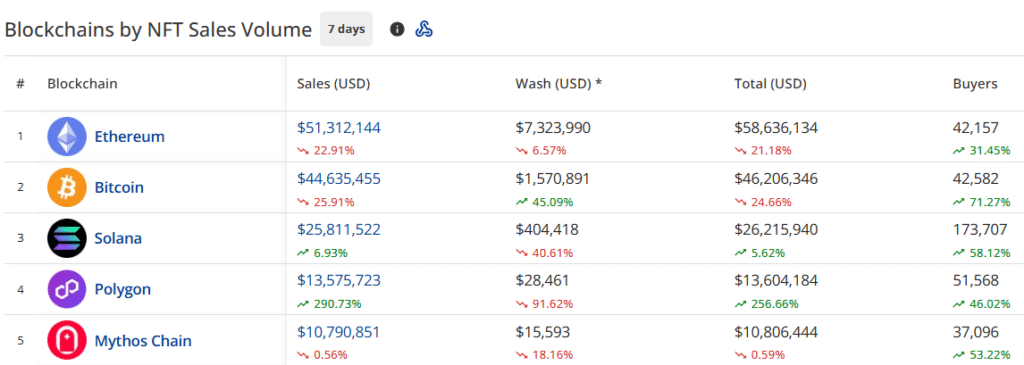
- Ethereum (ETH) blockchain leads with $51.3 million in sales (23.07% decrease)
- Bitcoin follows with $44.6 million (25.67% decrease)
- NFT buyers surged by 52.93% to 450,512
- NFT sellers increased by 46.74% to 277,767
- NFT transactions slightly decreased by 1.26% to 1,606,261
Ethereum NFT sales decline by 23.07%
The Ethereum NFT blockchain sales volume fell to $51.3 million this week, marking a 23.07% decrease in the last seven days.
The number of NFT buyers on the Ethereum blockchain grew to 42,157, showing a 31.45% increase.

Bitcoin maintained its second position despite a 25.67% decrease in the last seven days.
According to the data, Bitcoin blockchain’s NFT volume stood at $44.63 million, with wash trading increasing by 46.05% to $1.57 million.
Solana (SOL) secured the third position with $25.8 million, showing resilience with a 6.83% increase during the last seven days.
Polygon (POL) jumped to fourth place with $13.5 million, displaying remarkable growth of 289.66% during the last seven days.
Mythos Chain (MYTH) took the fifth position with $10.7 million in sales, showing a marginal decline of 0.71%.
BRC-20 NFTs maintain market leadership
BRC-20 NFTs continue to lead with $16.6 million in sales volume, despite a 41.39% decrease.
MGGA Hat on Polygon secured second place with $10 million in sales, while CryptoPunks followed with $9.2 million, showing a 60.26% decrease.

The latest data shows that the following NFT collections topped the sales in the last week:
- Uncategorized Ordinals #016 sold for $3,795,420 (39.0083 BTC)
- CryptoPunks #7098 sold for $368,889 (118 ETH)
- CryptoPunks #6285 sold for $339,618 (100 ETH)
- CryptoPunks #3152 sold for $332,825 (98 ETH)
- Autoglyphs #210 sold for $279,868 (90 WETH)
Source link
You may like


Will Polkadot Price Continue To Rally Following 100% Surge?


Dogecoin, Shiba Inu set the trend; this altcoin is ready to take the spotlight next


This Analyst Correctly Predicted The Bitcoin Price Jump To $99,000, But His Prediction Is Not Done


Analyst Who Accurately Predicted Solana Price Rally Shares Next Target


SHIB Lead Shytoshi Kusama Hints At TREAT Token Launch


Trader Says Top-10 Altcoin To Vastly Outperform Bitcoin and Ethereum, Hit New Record High Quicker Than Expected
Analyst
This Analyst Correctly Predicted The Bitcoin Price Jump To $99,000, But His Prediction Is Not Done
Published
3 hours agoon
November 23, 2024By
admin
A crypto analyst who accurately forecasted the Bitcoin price increase to the $99,000 All-Time High (ATH) has just released a more detailed analysis of his prediction. The analyst shared a chart highlighting crucial technical indicators and price movements that suggest the cryptocurrency could be gearing up for an even higher ATH.
Analyst Projects $105,000 As The Next Price Target
Weslad, a TradingView analyst, has raised his Bitcoin price forecast, predicting the next upside target at $105,764 as the crypto market bull run gains momentum. The analyst reported that BTC has officially entered the bull market phase, characterized by explosive price increases and positive market sentiment.
Related Reading
His recent bullish prediction of the Bitcoin price is grounded on a key technical pattern known as the “Ascending Channel,” which indicates a bullish trend continuation. This chart pattern consists of two upward-sloping trend lines drawn parallel to each other, representing the resistance and support price levels, respectively.
Despite his optimistic outlook for the BTC price, Weslad has revealed that investors should anticipate a corrective move toward the immediate buy-back zone, which would provide an optimal entry point for opportunistic buyers. The analyst has also shared a detailed price chart that highlights the bullish ascending channel and key price levels that Bitcoin could reach in the short-term and long-term.
Overview Of The Analyst’s Bitcoin Price Chart Analysis
In his 4-hour Bitcoin chart, Weslad visualizes the cryptocurrency’s price action within an ascending channel, highlighting that the BTC is moving upwards within two trendlines. The analyst has provided a detailed roadmap for his $105,764 bullish target for the Bitcoin price.
Weslad highlighted the price range between $91,000 and $92,000 as an “important demand zone,” which acts as strong support where buyers are likely to step in if BTC slips any further. He also revealed that the price level at $94,327.99 has been identified as an ”immediate buy-back zone,” which also serves as an optimal entry point if BTC experiences any corrective pullback in its price.
Related Reading
The analyst has also highlighted $97,537 as the “immediate profit target,” suggesting that traders may consider locking in profits at this critical short-term price level. He has also pinpointed the “mid-term target” for the Bitcoin price, highlighting that the $100,334 mid-term level is important for investors holding longer positions.
Lastly, Weslad has highlighted $105,764 as the “projected final target” for Bitcoin, indicating that this may be the ultimate target for the present market cycle. For BTC to reach this bullish price target, it would require only a modest 6.83% increase from its current value. As of writing, the price of Bitcoin is trading at $99,072, marking a 12.73% increase over the past seven days, according to CoinMarketCap.
Featured image created with Dall.E, chart from Tradingview.com
Source link
Bitcoin
Trader Says Top-10 Altcoin To Vastly Outperform Bitcoin and Ethereum, Hit New Record High Quicker Than Expected
Published
7 hours agoon
November 23, 2024By
admin
A widely followed cryptocurrency analyst and trader is turning bullish on a large-cap altcoin that has more than doubled in price over the past two weeks.
The analyst pseudonymously known as Credible Crypto tells his 436,700 followers on the social media platform X that XRP is primed to reach a new all-time high a “lot quicker than most are expecting.”
“And I think it’s going to vastly outperform both Bitcoin and Ethereum from current levels while doing it.”
XRP is trading at $1.41 at time of writing, up by around 156% over the past two weeks.
Credible Crypto further says that XRP is on the cusp of entering the overbought zone of the Relative Strength Index (RSI) indicator on the monthly time frame. The RSI indicator, which is calibrated from 0 to 100, is used to determine overbought or oversold conditions, with levels between 70 to 100 indicating overbought conditions and levels between 0 to 30 indicating oversold conditions.
“This is bullish as f**k.
Contrary to popular belief, the higher RSI goes, the stronger the momentum is and the more bullish a coin is (absent bearish divergences) and like every other form of technical analysis the higher the time frame this is on, the more significant it is.
Next target is $2 and after that, we go for a new all-time high.”

According to the pseudonymous analyst, XRP also appears highly bullish in its Ethereum (ETH) pair and could be poised for triple-digit percentage gains against the second-largest crypto asset.
“XRP/ETH just reclaimed and retested a four-year-long range, with the first target being ~250% higher.”

Don’t Miss a Beat – Subscribe to get email alerts delivered directly to your inbox
Check Price Action
Follow us on X, Facebook and Telegram
Surf The Daily Hodl Mix
 

Disclaimer: Opinions expressed at The Daily Hodl are not investment advice. Investors should do their due diligence before making any high-risk investments in Bitcoin, cryptocurrency or digital assets. Please be advised that your transfers and trades are at your own risk, and any losses you may incur are your responsibility. The Daily Hodl does not recommend the buying or selling of any cryptocurrencies or digital assets, nor is The Daily Hodl an investment advisor. Please note that The Daily Hodl participates in affiliate marketing.
Generated Image: Midjourney
Source link

Bitcoin Cash (BCH) added nearly 35% to its value in the past month and rallied 12% on Nov. 21. Bitcoin’s (BTC) observed a rally to $98,384 early on Nov. 21, with BCH and other top cryptocurrencies tagging along for the ride.
An analysis of on-chain and technical indicators and data from the derivatives market shows that BCH could extend gains and retest its mid-April 2024 peak of $569.10.
Bitcoin hits all-time high, fork from 2017 ignites hope for traders
Bitcoin hit a record high of $98,384 on Nov. 21, a key milestone as the cryptocurrency eyes a run to the $100,000 target. BTC was forked in 2017, creating a spin-off or alternative, Bitcoin Cash.
BCH hit a peak of $1,650 in May 2021. Since April 2024, BCH has been consolidating with no clear trend formation.
BCH price rallied nearly 30% since Nov. 15, on-chain indicators show that further rally is likely in the Bitcoin spin-off token.
Bitcoin Cash’s active addresses have climbed consistently since August 2024. Santiment data shows an uptrend in active addresses, meaning BCH traders have sustained demand for the token, supporting a bullish thesis for the cryptocurrency.
The ratio of daily on-chain transaction volume in profit to loss exceeds 2, is 2.141 on Thursday. BCH traded on-chain noted twice as many profitable transactions on the day, as the ones where losses were incurred. This is another key metric that paints a bullish picture for the token forked from Bitcoin.
Binance funding rate is positive since Nov. 10. In the past eleven days, traders have been optimistic about gains in BCH price, according to Santiment data.

The network realized profit/loss metric identifies the net gain or loss of all traders who traded the token within a 24 hour period. NPL metric for Bitcoin Cash shows traders have been taking profits on their holdings, small positive spikes on the daily price chart represent NPL.
Investors need to keep their eyes peeled for significant movements in NPL, large positive spikes imply heavy profit-taking activities that could increase selling pressure across exchange platforms.
84.48% of Bitcoin Cash’s supply is currently profitable, as of Nov. 21. This metric helps traders consider the likelihood of high profit-taking or exits from existing BCH holders, to time an entry/ exit in spot market trades.

Derivatives traders are bullish on BCH
Derivatives market data from Coinglass shows a 33% increase in open interest in Bitcoin Cash. Open interest represents the total number of active contracts that haven’t been settled, representing demand for the BCH token among derivatives traders.
Derivatives trade volume climbed 613% in the same timeframe, to $2.35 billion. Across exchanges, Binance and OKX, the long/short ratio is above 1, closer to 2, meaning traders remain bullish on BCH and expect prices to rally.

BCH futures open interest chart shows a steady increase in the metric, alongside BCH price gain since November 5, 2024. Open interest climbed from $190.74 million to $254.87 million between November 5 and 21.

Technical indicators show BCH could gain 18%
The BCH/USDT daily price chart on Tradingview.com shows that the token remains within the consolidation. The token is stuck within a range from $272.70 to $568.20. BCH could attempt to break past the upper boundary of the range, a daily candlestick close above $568.20 could confirm the bullish breakout.
The April 2024 high of $719.50 is the next major resistance for BCH and the second key level is at $805.80, a key level from May 2021.
The relative strength index reads 64, well below the “overvalued” zone above 70. RSI supports a bullish thesis for BCH. Another key momentum indicator, moving average convergence divergence flashes green histogram bars above the neutral line. This means BCH price trend has an underlying positive momentum.
The awesome oscillator is in agreement with the findings of RSI and MACD, all three technical indicators point at likelihood of gains.

A failure to close above the upper boundary of the range could invalidate the bullish thesis. BCH could find support at the midpoint of the range at $419.90 and the 50-day exponential moving average at $388.50.
Disclosure: This article does not represent investment advice. The content and materials featured on this page are for educational purposes only.
Source link

Will Polkadot Price Continue To Rally Following 100% Surge?

Dogecoin, Shiba Inu set the trend; this altcoin is ready to take the spotlight next

This Analyst Correctly Predicted The Bitcoin Price Jump To $99,000, But His Prediction Is Not Done

Analyst Who Accurately Predicted Solana Price Rally Shares Next Target

NFT sales drop 9.6% to $160.9m, Ethereum and Bitcoin network sales plunge

SHIB Lead Shytoshi Kusama Hints At TREAT Token Launch

Trader Says Top-10 Altcoin To Vastly Outperform Bitcoin and Ethereum, Hit New Record High Quicker Than Expected

5 tokens to consider buying today

Terra Luna Classic Community Discord On Proposal Amid LUNC Price Rally

Trump Nominates Pro-Crypto Hedge Fund Manager Scott Bessent as Treasury Secretary

Dogecoin surges 10% as this new altcoin shakes the market, and preps for stage 2 presale

Ripple CEO Shares Bullish News With XRP Army As Trump Names Treasury Secretary

On-Chain Data Shows The Bitcoin Price Bull Run is Far From Over

Trump Picks Pro-Crypto Hedge Fund Manager Scott Bessent for Treasury Secretary

Crypto millionaires will be made by April 2025: 6 coins to hold
182267361726451435

Why Did Trump Change His Mind on Bitcoin?

Top Crypto News Headlines of The Week

New U.S. president must bring clarity to crypto regulation, analyst says

Ethereum, Solana touch key levels as Bitcoin spikes

Will XRP Price Defend $0.5 Support If SEC Decides to Appeal?

Bitcoin Open-Source Development Takes The Stage In Nashville

Bitcoin 20% Surge In 3 Weeks Teases Record-Breaking Potential

Ethereum Crash A Buying Opportunity? This Whale Thinks So

Shiba Inu Price Slips 4% as 3500% Burn Rate Surge Fails to Halt Correction

‘Hamster Kombat’ Airdrop Delayed as Pre-Market Trading for Telegram Game Expands

Washington financial watchdog warns of scam involving fake crypto ‘professors’

Citigroup Executive Steps Down To Explore Crypto
Mostbet Güvenilir Mi – Casino Bonus 2024

Bitcoin flashes indicator that often precedes higher prices: CryptoQuant
Trending

 2 months ago
182267361726451435

 Donald Trump4 months ago
Why Did Trump Change His Mind on Bitcoin?

 24/7 Cryptocurrency News3 months ago
Top Crypto News Headlines of The Week

 News3 months ago
New U.S. president must bring clarity to crypto regulation, analyst says

 Bitcoin4 months ago
Ethereum, Solana touch key levels as Bitcoin spikes

 Price analysis3 months ago
Will XRP Price Defend $0.5 Support If SEC Decides to Appeal?

 Opinion4 months ago
Bitcoin Open-Source Development Takes The Stage In Nashville

 Bitcoin4 months ago
Bitcoin 20% Surge In 3 Weeks Teases Record-Breaking Potential


