
Markets
Can the XRP price realistically jump to $10 in 2024?

The XRP price has staged a strong recovery this month, making it one of the best-performing top ten cryptocurrencies.
Ripple (XRP) peaked at $1.6305 last week, rising 324% from its lowest point this year and pushing its market cap to over $81 billion. This valuation surpasses major global firms like Deutsche Bank, Marriott International, and BP.
With XRP’s bullish trajectory, analysts have shared optimistic forecasts. Edo Farina, a long-term Ripple supporter, predicted in an X post that the coin could surge to $10 during this bull run.
He cited fundamental catalysts, including expectations that Donald Trump’s victory could resolve Ripple’s ongoing conflict with the Securities and Exchange Commission will be over next year.
Meanwhile, Ripple and Archax have partnered to launch a tokenized fund on the XRP Ledger, signaling renewed activity on the network
Additionally, Ripple is developing RLUSD, a stablecoin intended to compete with Tether (USDT) PayPal USD, and USD Coin (USDC).
There are also rumors of Ripple launching an Initial Public Offering (IPO) in the coming years. A January CNBC report suggested the company postponed its IPO plans due to SEC challenges, a situation that could shift next year.
Can the XRP price jump to $10?

The price of Ripple traded at $1.4381 on Nov. 25, requiring a 600% increase to reach $10. Such a move would exceed its recent performance but aligns with past trends, like its 1,800% jump from 2020 lows to its all-time high in 2021.
The weekly chart shows that Ripple broke the significant resistance level of $0.9350, the neckline of a slanted triple-bottom pattern. The coin has moved above the 50-week and 200-week Exponential Moving Averages, suggesting positive momentum. There are also indications of a bullish pennant pattern forming.
While XRP may continue climbing, potentially reaching its all-time high of $1.96 and further to $5, a leap to $10 in 2024 remains unlikely.
Source link


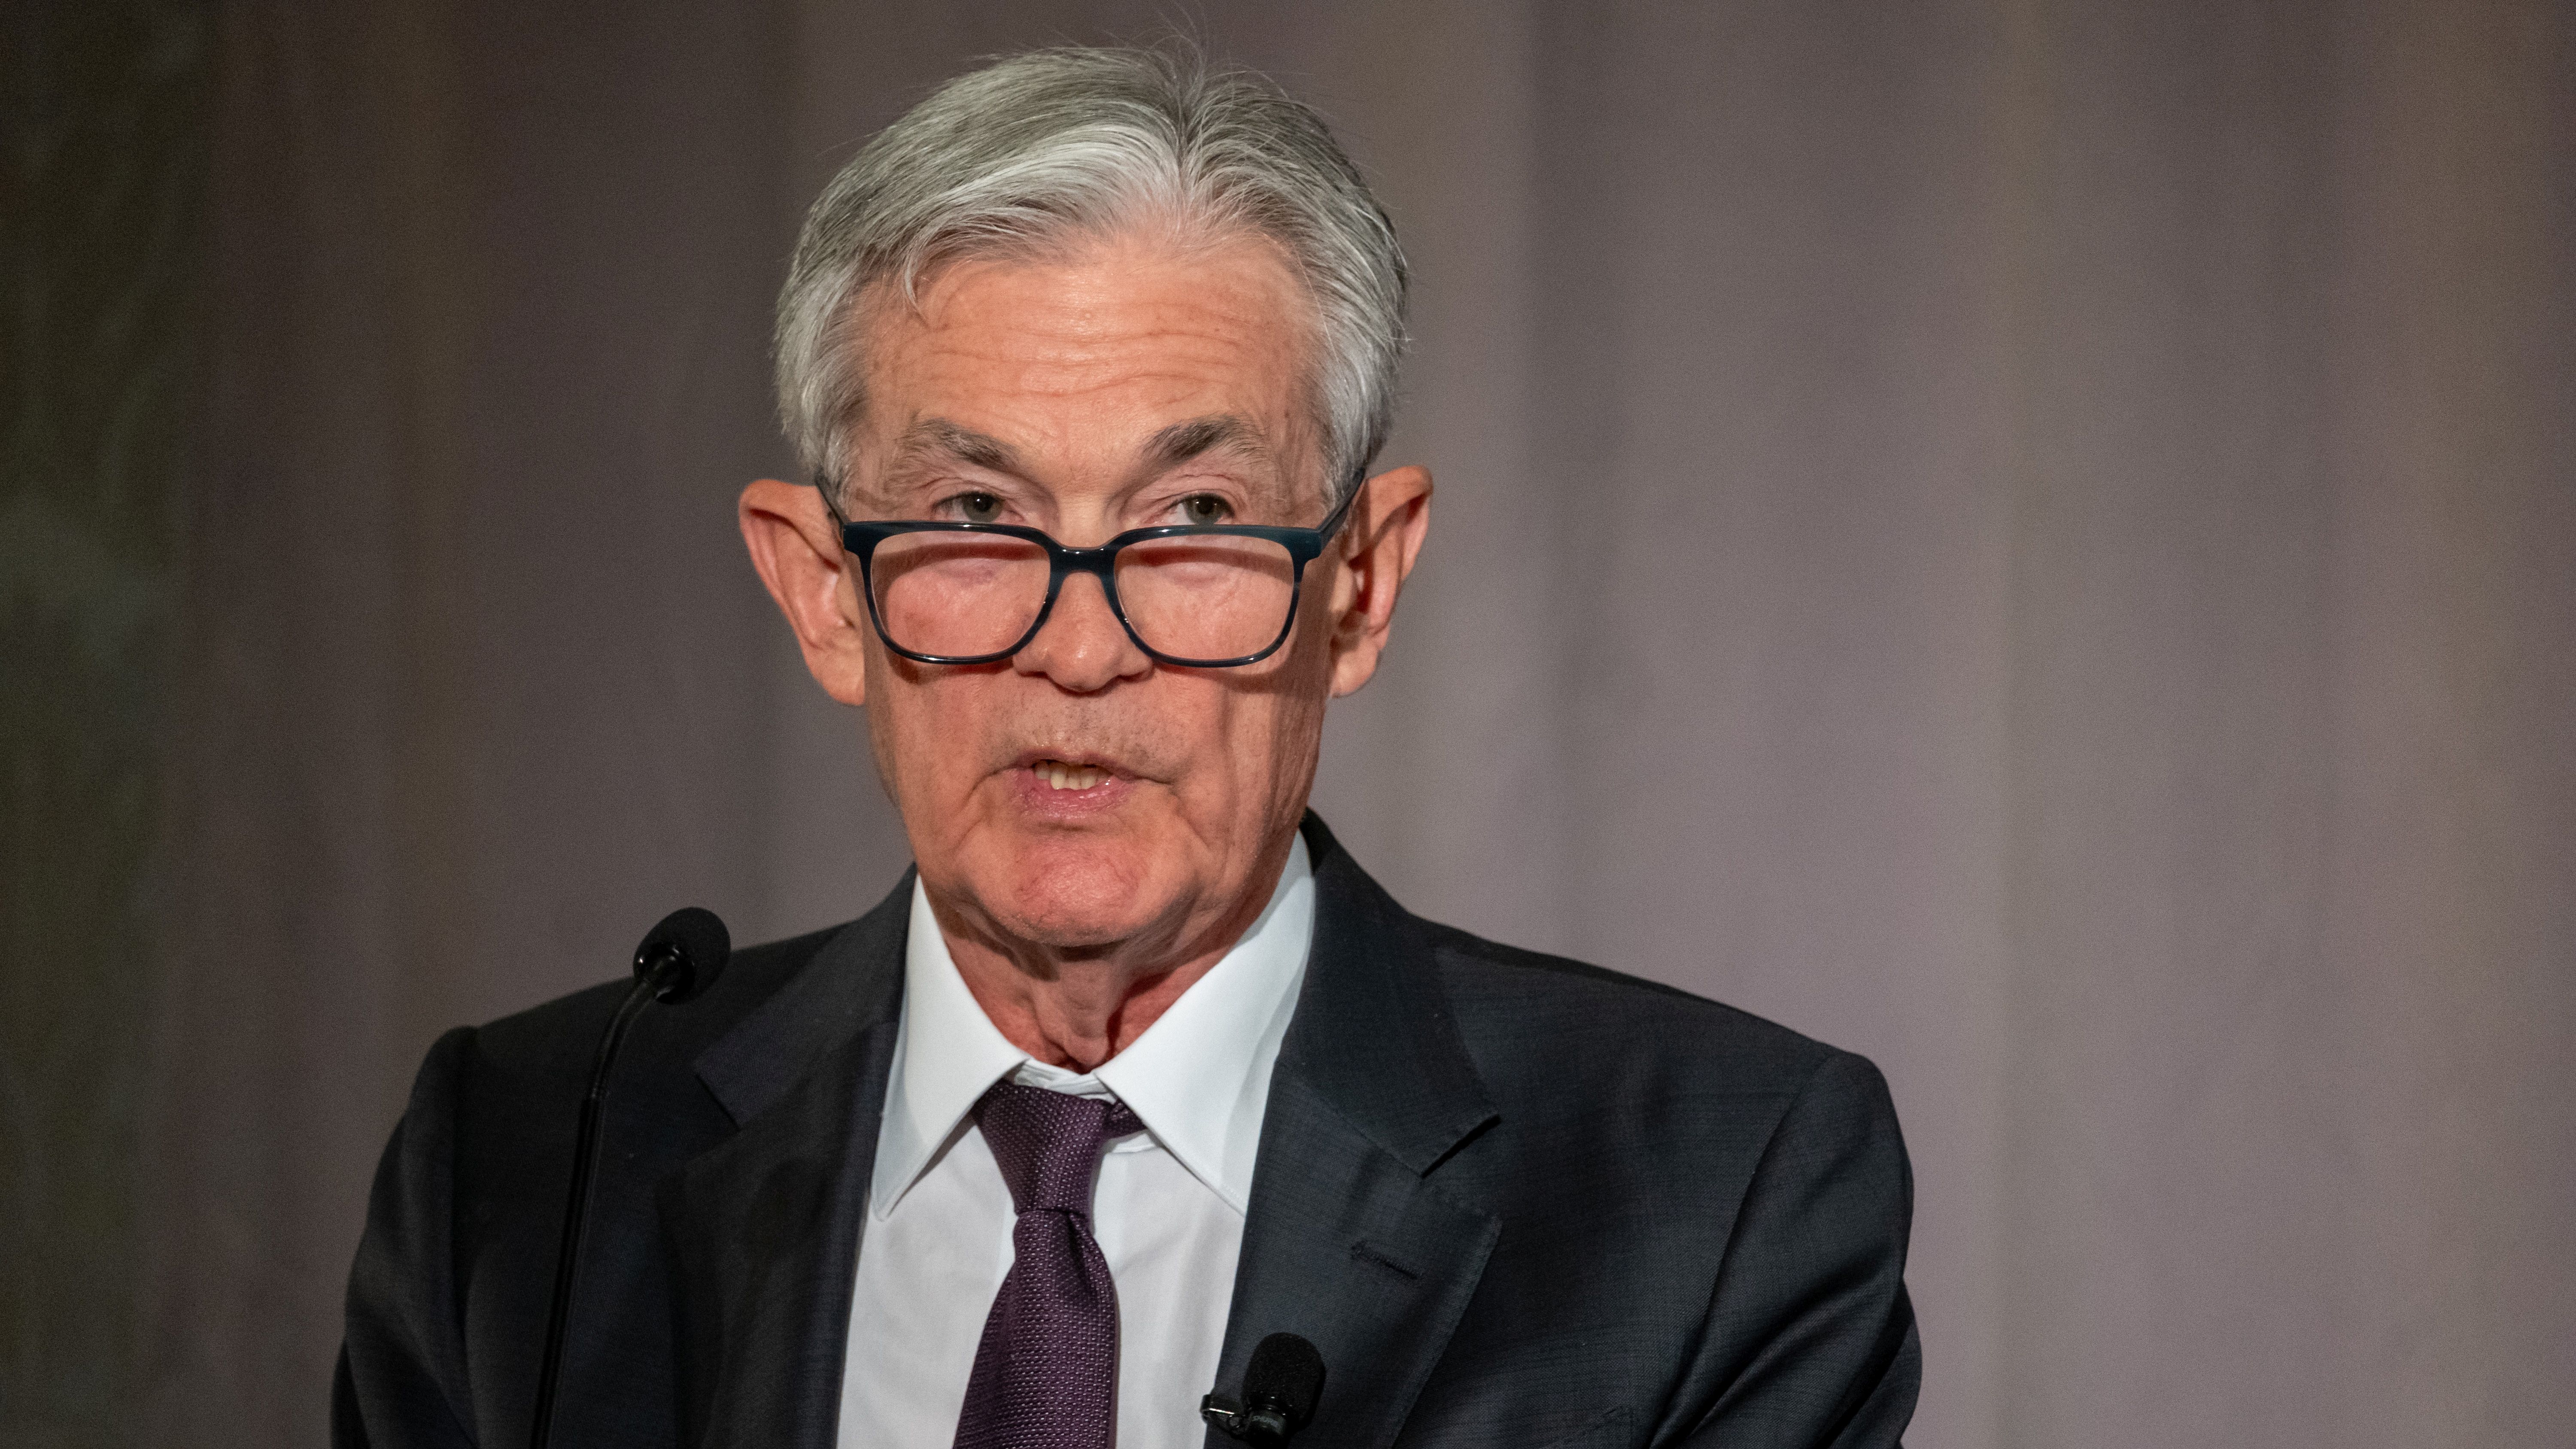
A modest bitcoin rally to a possible challenge of the $86,000 level quickly reversed during U.S. afternoon trading hours on Wednesday as Federal Reserve Chairman Jerome Powell warned on the effects of President Trump’s tariff regime.
“The level of the tariff increases announced so far is significantly larger than anticipated,” said Powell in a speech. “The same is likely to be true of the economic effects, which will include higher inflation and slower growth.”
In other words, stagflation — a throwback to a sizable portion of the 1970s when the U.S. experienced weak economic activity alongside double-digit inflation.
“We may find ourselves in the challenging scenario in which our dual-mandate goals are in tension,” continued Powell.
The price of bitcoin (BTC) fell about 2.5% in the minutes following the Powell remarks, now trading at $83,700, down 1.5% over the past 24 hours.
U.S. stocks, which had been trying to mount a comeback from opening declines, also were hit, the Nasdaq slumping 3.4% to a session low.
Powell also mentioned that as crypto is becoming more mainstream, there’s a need for a legal framework for stablecoins. He said that banking regulation around crypto will likely be “partially relaxed.”
The U.S. Senate Banking Committee cleared a bill to regulate stablecoin issuers in March, marking the first committee approval and a significant step closer to law in the U.S.
Hawkish Fed weighs on crypto and BTC
“Powell came out extremely hawkish,” Quinn Thompson, chief investment officer of hedge fund Lekker Capital, said in a Telegram message. It’s notable that Powell downplayed last week’s market turmoil characterizing it as “orderly market functioning,” he added.
“I would have at least expected him to give a nod to the elevated volatility and ruptures forming in the treasury market but he did not do that,” Thompson said.
Powell’s tone suggests that investors should temper their expectations for rate cuts in the upcoming meetings, said Thompson, which could weigh on risk assets including crypto.
“It appears a May cut is firmly off the table barring Fed intervention for bad reasons and I wouldn’t say June is a lock either,” concluded Thompson. “The bull case for crypto and bitcoin specifically is liquidity and policymaker intervention. Both of those seemed very far off based, so it’s difficult for me to paint a constructive picture in the immediate term.”
UPDATE (April 16, 18:40 UTC): Adds additional comments made by Chair Powell about stablecoins. Adds analyst comment.
Source link

Bitcoin’s price trajectory is once again capturing headlines, and this time the catalyst appears to be global liquidity trends reshaping investor sentiment. In a recent comprehensive breakdown, Matt Crosby, Lead Analyst at Bitcoin Magazine Pro, presents compelling evidence tying the digital asset’s renewed bullish momentum to the expanding global M2 money supply. His insights not only illuminate the future of Bitcoin price but also anchor its macroeconomic relevance in a broader financial context.

Bitcoin Price and Global Liquidity: A High-Impact Correlation
Crosby highlights a remarkable and consistent correlation—often exceeding 84%—between Bitcoin price and global M2 liquidity levels. As liquidity increases across the global economy, Bitcoin price typically responds with upward movement, although with a noticeable delay. Historical data supports the observation of a 56–60 day lag between monetary expansion and Bitcoin price increases.
This insight has recently proven accurate, as Bitcoin price rebounded from lows of $75,000 to above $85,000. This trend closely aligns with the forecasted recovery that Crosby and his team had outlined based on macro indicators, validating the strength and reliability of the correlation driving Bitcoin price upward.
Why the 2-Month Delay Impacts Bitcoin Price
The two-month delay in market response is a critical observation for understanding Bitcoin price movements. Crosby emphasizes that monetary policy and liquidity injections do not immediately affect speculative assets like BTC. Instead, there is an incubation period, typically around two months, during which liquidity filters through financial systems and begins to influence Bitcoin price.
Crosby has optimized this correlation through various backtests, adjusting timeframes and offsets. Their findings indicate that a 60-day delay yields the most predictive accuracy across both short-term (1-year) and extended (4-year) historical Bitcoin price action. This lag provides a strategic advantage to investors who monitor macro trends to anticipate Bitcoin price surges.
S&P 500 and Its Influence on Bitcoin Price Trends
Adding further credibility to the thesis, Crosby extends his analysis to traditional equity markets. The S&P 500 exhibits an even stronger all-time correlation of approximately 92% with global liquidity. This correlation strengthens the argument that monetary expansion is a significant driver not just for Bitcoin price, but also for broader risk-on asset classes.
By comparing liquidity trends with multiple indices, Crosby demonstrates that Bitcoin price is not an anomaly but part of a broader systemic pattern. When liquidity rises, equities and digital assets alike tend to benefit, making M2 supply an essential indicator for timing Bitcoin price movements.
Forecasting Bitcoin Price to $108,000 by June 2025
To build a forward-looking perspective, Crosby employs historical fractals from previous bull markets to project future Bitcoin price movements. When these patterns are overlaid with current macro data, the model points to a scenario where Bitcoin price could retest and potentially surpass its all-time highs, targeting $108,000 by June 2025.
This optimistic projection for Bitcoin price hinges on the assumption that global liquidity continues its upward trajectory. The Federal Reserve’s recent statements suggest that further monetary stimulus could be deployed if market stability falters—another tailwind for Bitcoin price growth.
The Rate of Expansion Affects Bitcoin Price
While rising liquidity levels are significant, Crosby stresses the importance of monitoring the rate of liquidity expansion to predict Bitcoin price trends. The year-on-year M2 growth rate offers a more nuanced view of macroeconomic momentum. Although liquidity has generally increased, the pace of expansion had slowed temporarily before resuming an upward trend in recent months.

This trend is strikingly similar to conditions observed in early 2017, just before Bitcoin price entered an exponential growth phase. The parallels reinforce Crosby’s bullish outlook on Bitcoin price and emphasize the importance of dynamic, rather than static, macro analysis.
Final Thoughts: Preparing for the Next Bitcoin Price Phase
While potential risks such as a global recession or a significant equity market correction persist, current macro indicators point toward a favorable environment for Bitcoin price. Crosby’s data-driven approach offers investors a strategic lens to interpret and navigate the market.
For those looking to make informed decisions in a volatile environment, these insights provide actionable intelligence grounded in economic fundamentals to capitalize on Bitcoin price opportunities.
For more deep-dive research, technical indicators, real-time market alerts, and access to a growing community of analysts, visit BitcoinMagazinePro.com.

Disclaimer: This article is for informational purposes only and should not be considered financial advice. Always do your own research before making any investment decisions.
Source link

Payments-focused XRP’s immediate prospects look bleak, with its price chart flashing a “rising wedge” breakdown.
A rising wedge comprises two converging trendlines that connect higher lows and higher highs. This convergence suggests that upward momentum is weakening. When the price moves below the lower trendline, it signals a shift to a bearish trend.
XRP dived out of its rising wedge pattern during Wednesday’s early Asian hours, suggesting that the attempted recovery from the April 7 lows near $1.60 has likely lost momentum, allowing sellers to regain control.
According to technical analysis theory, analysts should identify the starting point of the rising wedge as the initial support level following the breakdown, which means XRP can now fall back to $1.60. The cryptocurrency has also fallen below the Ichimoku Cloud, a momentum indicator, on the hourly chart, reinforcing the bearish outlook indicated by the rising wedge breakdown.

Tuesday’s high of $2.18 is the level for bulls to beat to invalidate the bearish outlook.
Source link

Now On Sale For $70,000: The World’s First Factory Ready Open-Source Humanoid Robot

What Next for ETH as Traders Swap $86M into Solana DeFi protocols ?

Why Did Bitcoin Price (BTC) Fall on Wednesday Afternoon

Solana price is up 36% from its crypto market crash lows — Is $180 SOL the next stop?

Solana Retests Bearish Breakout Zone – $65 Target Still In Play?

How Expanding Global Liquidity Could Drive Bitcoin Price To New All-Time Highs

Apple Delists 14 Crypto Apps in South Korea Including KuCoin and MEXC Exchanges Amid Regulatory Crackdown

Athens Exchange Group eyes first onchain order book via Sui

Futureverse Acquires Candy Digital, Taps DC Comics and Netflix IP to Boost Metaverse Strategy
Court Grants Ripple And SEC’s Joint Motion To Suspend Appeal

AVAX Falls 2.1% as Nearly All Assets Trade Lower

What is a VTuber, and how do you become one in 2025?

Top Expert’s Update Sets $10 Target

How Academia Interacts With The Bitcoin Ecosystem

AB DAO and Bitget Launch Dual Reward Campaign, Distributing $2.6M Worth of $AB Globally


 24/7 Cryptocurrency News5 months ago
Arthur Hayes, Murad’s Prediction For Meme Coins, AI & DeFi Coins For 2025

 Bitcoin3 months ago
Expert Sees Bitcoin Dipping To $50K While Bullish Signs Persist

 24/7 Cryptocurrency News3 months ago
Aptos Leverages Chainlink To Enhance Scalability and Data Access

 Bitcoin5 months ago
Bitcoin Could Rally to $80,000 on the Eve of US Elections

 Opinion5 months ago
Crypto’s Big Trump Gamble Is Risky

 Bitcoin5 months ago
Institutional Investors Go All In on Crypto as 57% Plan to Boost Allocations as Bull Run Heats Up, Sygnum Survey Reveals

 Altcoins3 months ago
Sonic Now ‘Golden Standard’ of Layer-2s After Scaling Transactions to 16,000+ per Second, Says Andre Cronje

 Ripple Price4 weeks ago
3 Voting Polls Show Why Ripple’s XRP Price Could Hit $10 Soon
