
Bitcoin
Bitcoin Crashes Under $93,000: What’s Behind It?

Bitcoin has observed a plunge under the $93,000 level during the past day. Here’s what the trend in an indicator suggests about what could be behind this downturn.
Bitcoin Coinbase Premium Gap Has Gone Cold
As pointed out by CryptoQuant community analyst Maartunn in a new post on X, the Coinbase Premium Gap has returned to neutral levels recently. The “Coinbase Premium Gap” here refers to an indicator that keeps track of the difference between the Bitcoin price listed on Coinbase (USD pair) and that on Binance (USDT pair).
This metric essentially tells us about how the buying or selling behaviours differ between the user bases of the two cryptocurrency exchanges. Coinbase’s main traffic is made up of American investors, especially large institutional entities, while Binance serves investors around the world.
When the Coinbase Premium Gap has a positive value, it means the US-based whales are participating in a higher amount of buying or a lower amount of selling than the Binance users, which is why the asset is more expensive on Coinbase. Similarly, it being negative implies a net higher buying pressure on Binance.
Now, here is a chart that shows the trend in the Bitcoin Coinbase Premium Gap over the past couple of days:
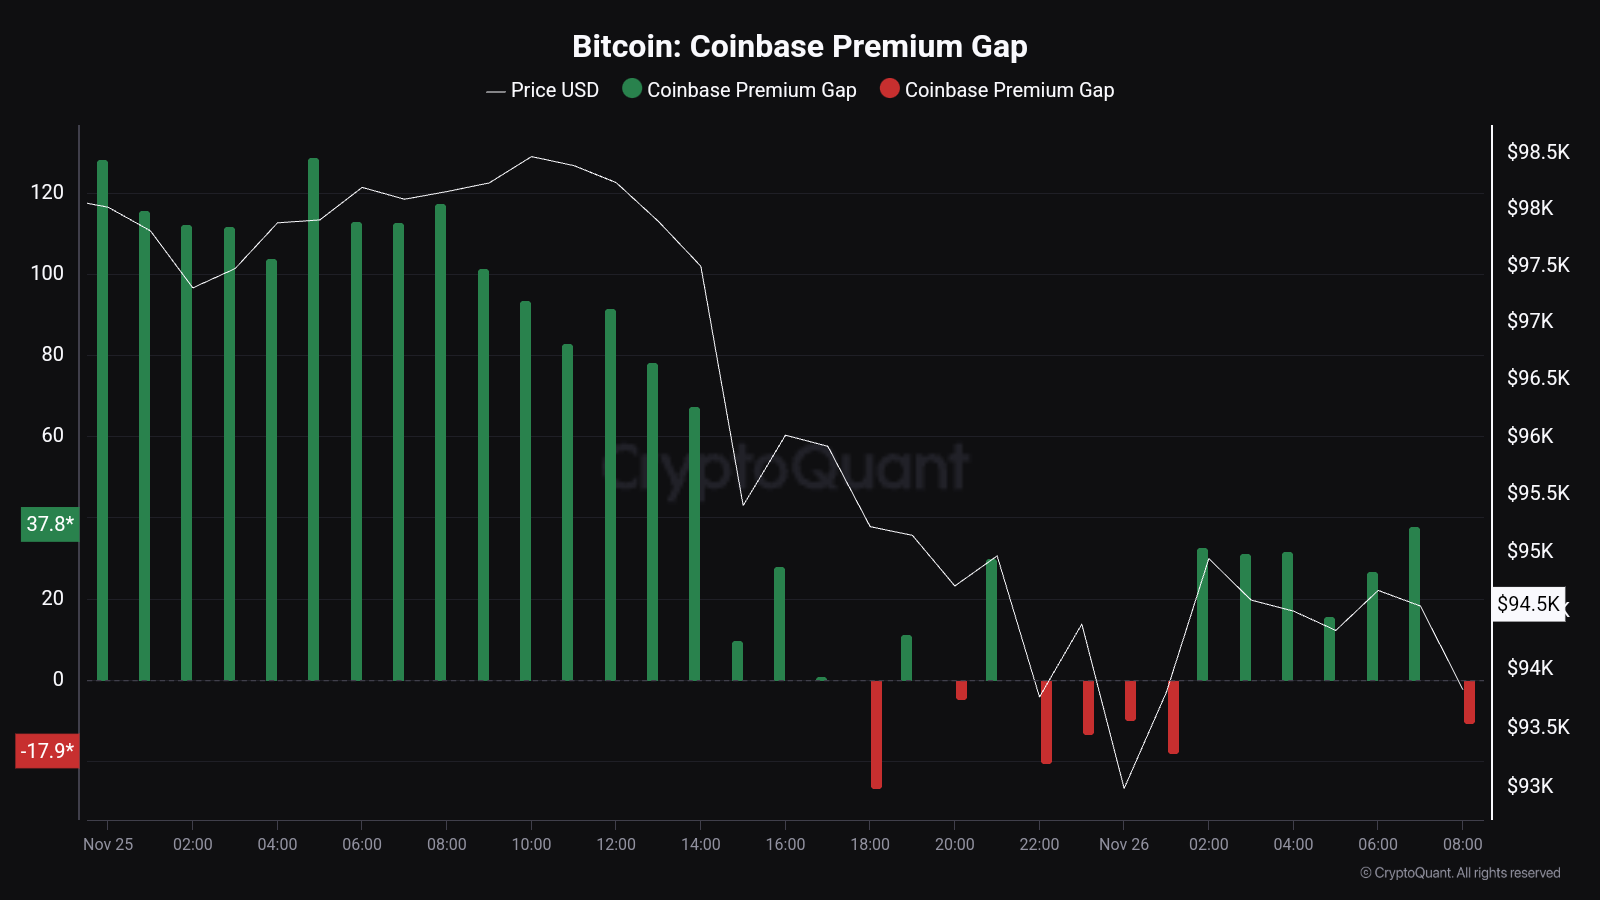
As displayed in the above graph, the Bitcoin Coinbase Premium Gap had been at notable positive levels earlier, but during the past day, its value has declined to the neutral zero mark.
According to Maartunn, the source of the positive premium was Microstrategy’s latest buying spree. Indeed, the cooldown in the indicator matches up with the timing of the completion of the $5.4 billion purchase by Michael Saylor’s firm. The significant accumulation from the company had helped the cryptocurrency maintain its recent highs, but with the buying pressure depleted, Bitcoin has retraced to price levels under $93,000.
BTC and the Coinbase Premium Gap have held a close relationship throughout 2024, so the metric could be to keep an eye on in the near future, as where it goes next may once again foreshadow the asset’s next destination. Naturally, a decline into the negative region could spell further bearish action for its price.
In some other news, the Bitcoin Active Addresses indicator has observed a sharp jump recently, as Maartunn has shared in another X post. This metric keeps track of the daily number of addresses that are participating in some kind of transaction activity on the network.
Below is the chart shared by the CryptoQuant analyst for the 14-day simple moving average (SMA) of the Active Addresses:
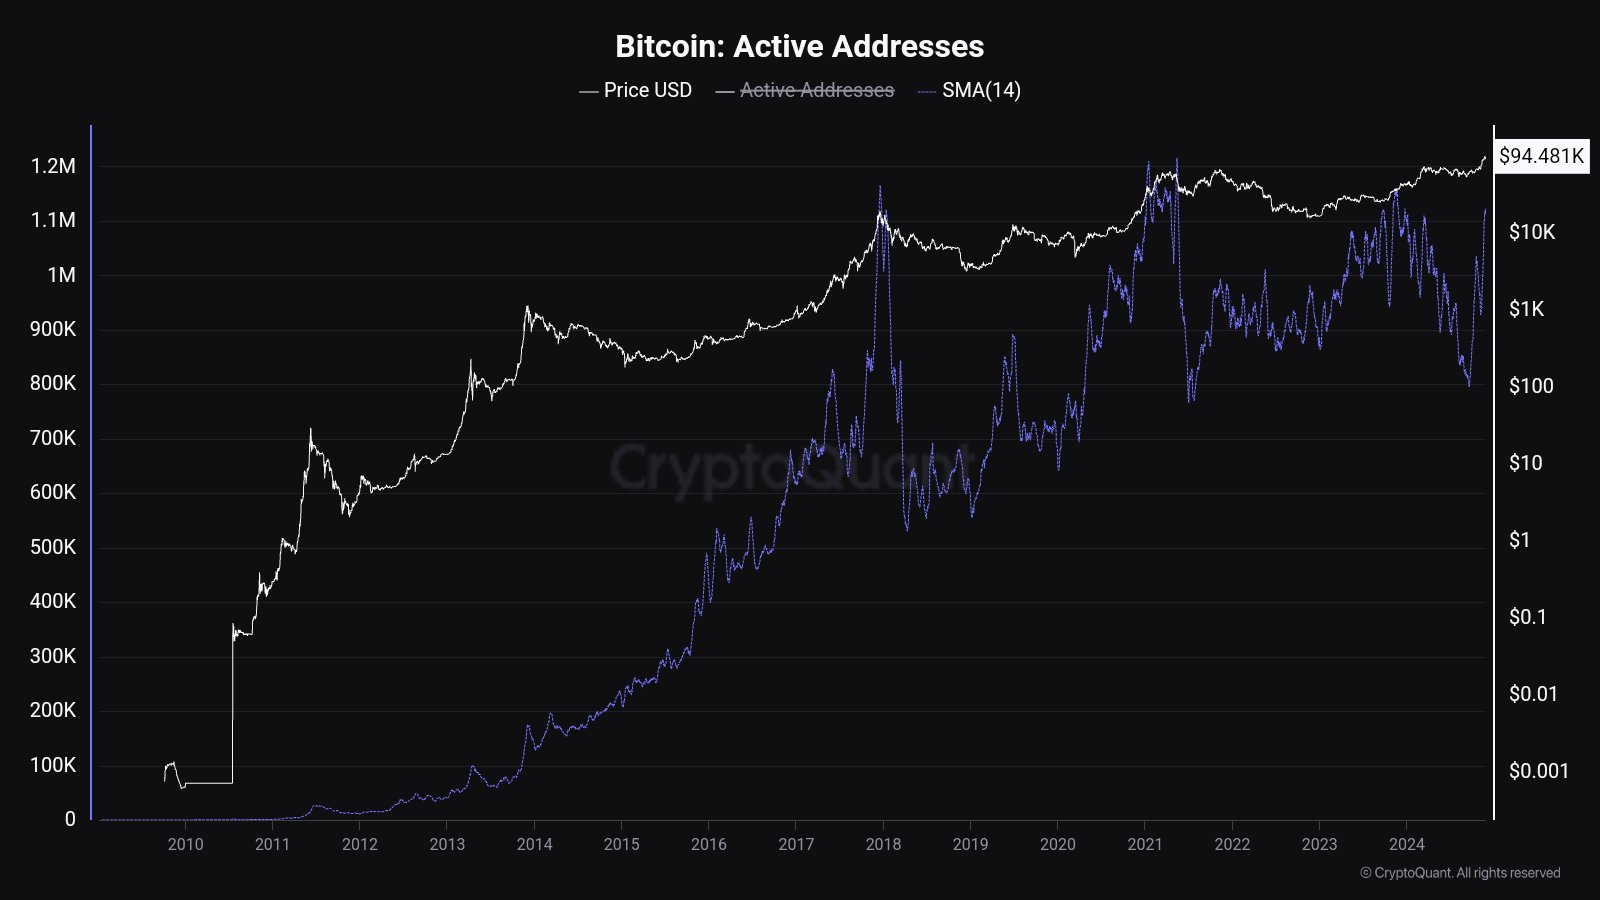
With this latest surge, the 14-day SMA of the Bitcoin Active Addresses has reached its highest point in eleven months. This suggests that a lot of activity has recently occurred on the network. Given that the asset has gone down in the past day, though, the most recent user interest has certainly not come for buying.
BTC Price
At the time of writing, Bitcoin is floating around $92,400, down almost 6% over the last 24 hours.
Source link


Altcoins
Crypto Trader Says Solana Competitor Starting To Show Bullish Momentum, Updates Outlook on Bitcoin and Ethereum

A widely followed crypto analyst says one Solana (SOL) competitor may be gearing up for a breakout.
In a new thread, crypto trader Michaël van de Poppe tells his 783,000 followers on the social media platform X that Sei (SEI) may increase more than 100% its current value if it breaks through a key resistance level.
“SEI starts to show momentum. The Bitcoin pair has a strong bullish divergence on the higher timeframes and the USD pair faces a crucial resistance. Breaking through $0.20 opens up a continuation towards $0.30-$0.35.”

SEI is trading for $0.17 at time of writing, down 2.4% in the last 24 hours.
Next up, the analyst says that Bitcoin (BTC) is in a consolidation phase that may lead to an explosive move to the upside.
“Bitcoin is stuck in the final range. Another test of $87,000 and we’ll likely break upwards to the rally of a new all-time high.”
Bitcoin is trading for $83,800 at time of writing, flat on the day.
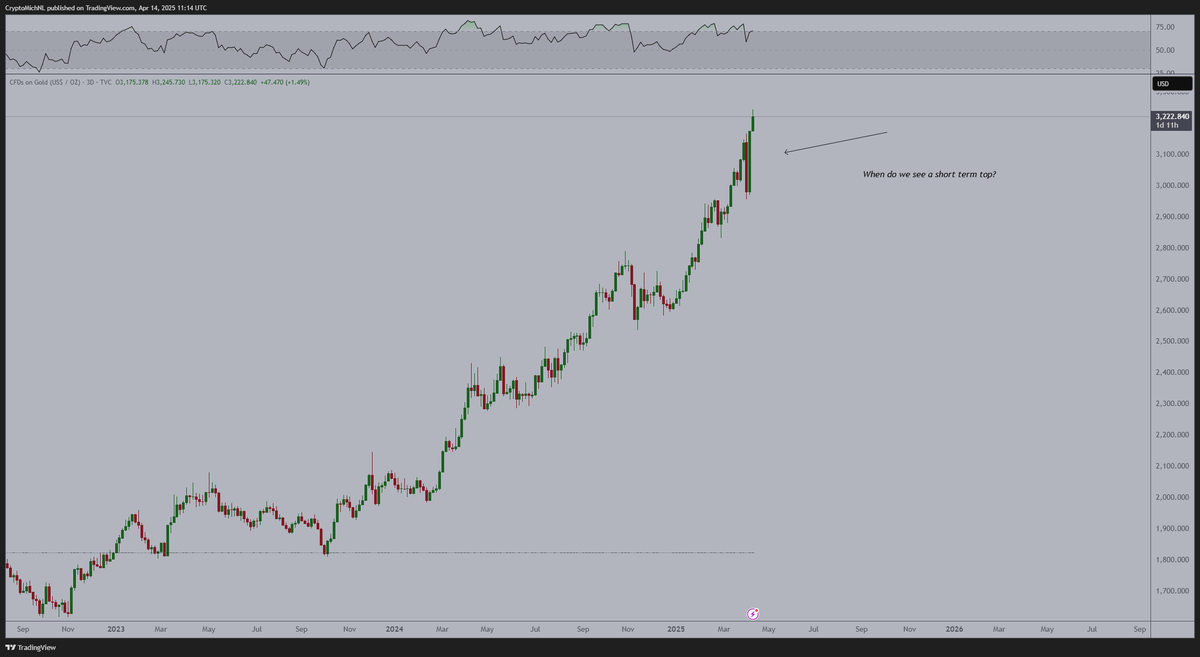
Lastly, the analyst says that Ethereum (ETH) may be kicking off an uptrend if the price of gold peaks, based on ETH’s historic inverse correlation with the precious metal.
“A good start of the week, as ETH is +4% against Bitcoin. The ultimate question whether it will sustain or not, last months it has been giving back the returns in the days after. What to monitor? Gold peaking or not. If that’s the case, then we’ll see more strength on ETH.”
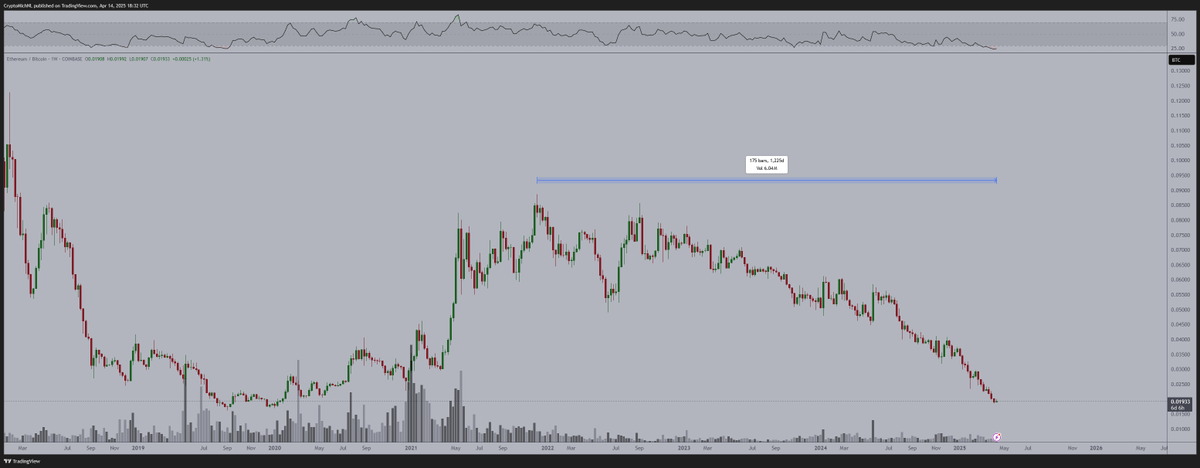
The analyst also says that ETH’s Relative Strength Index (RSI) indicator is flashing bullish, having entered oversold territory.
The RSI is a momentum oscillator used to determine whether an asset is oversold or overbought. The RSI’s values range from zero to 100. A level between 70 and 100 indicates that an asset is overbought. The 0 to 30 level range indicates that an asset is oversold.
“It’s been a bear market for 1,225 days for ETH, as, in this period, gold did a 2x. The lowest RSI on the weekly candle for ETH as well.”
ETH is trading for $1,589 at time of writing, down 2% in the last 24 hours.
Follow us on X, Facebook and Telegram
Don’t Miss a Beat – Subscribe to get email alerts delivered directly to your inbox
Check Price Action
Surf The Daily Hodl Mix
 

Disclaimer: Opinions expressed at The Daily Hodl are not investment advice. Investors should do their due diligence before making any high-risk investments in Bitcoin, cryptocurrency or digital assets. Please be advised that your transfers and trades are at your own risk, and any losses you may incur are your responsibility. The Daily Hodl does not recommend the buying or selling of any cryptocurrencies or digital assets, nor is The Daily Hodl an investment advisor. Please note that The Daily Hodl participates in affiliate marketing.
Generated Image: Midjourney
Source link

A modest bitcoin rally to a possible challenge of the $86,000 level quickly reversed during U.S. afternoon trading hours on Wednesday as Federal Reserve Chairman Jerome Powell warned on the effects of President Trump’s tariff regime.
“The level of the tariff increases announced so far is significantly larger than anticipated,” said Powell in a speech. “The same is likely to be true of the economic effects, which will include higher inflation and slower growth.”
In other words, stagflation — a throwback to a sizable portion of the 1970s when the U.S. experienced weak economic activity alongside double-digit inflation.
“We may find ourselves in the challenging scenario in which our dual-mandate goals are in tension,” continued Powell.
The price of bitcoin (BTC) fell about 2.5% in the minutes following the Powell remarks, now trading at $83,700, down 1.5% over the past 24 hours.
U.S. stocks, which had been trying to mount a comeback from opening declines, also were hit, the Nasdaq slumping 3.4% to a session low.
Powell also mentioned that as crypto is becoming more mainstream, there’s a need for a legal framework for stablecoins. He said that banking regulation around crypto will likely be “partially relaxed.”
The U.S. Senate Banking Committee cleared a bill to regulate stablecoin issuers in March, marking the first committee approval and a significant step closer to law in the U.S.
Hawkish Fed weighs on crypto and BTC
“Powell came out extremely hawkish,” Quinn Thompson, chief investment officer of hedge fund Lekker Capital, said in a Telegram message. It’s notable that Powell downplayed last week’s market turmoil characterizing it as “orderly market functioning,” he added.
“I would have at least expected him to give a nod to the elevated volatility and ruptures forming in the treasury market but he did not do that,” Thompson said.
Powell’s tone suggests that investors should temper their expectations for rate cuts in the upcoming meetings, said Thompson, which could weigh on risk assets including crypto.
“It appears a May cut is firmly off the table barring Fed intervention for bad reasons and I wouldn’t say June is a lock either,” concluded Thompson. “The bull case for crypto and bitcoin specifically is liquidity and policymaker intervention. Both of those seemed very far off based, so it’s difficult for me to paint a constructive picture in the immediate term.”
UPDATE (April 16, 18:40 UTC): Adds additional comments made by Chair Powell about stablecoins. Adds analyst comment.
Source link

Bitcoin’s price trajectory is once again capturing headlines, and this time the catalyst appears to be global liquidity trends reshaping investor sentiment. In a recent comprehensive breakdown, Matt Crosby, Lead Analyst at Bitcoin Magazine Pro, presents compelling evidence tying the digital asset’s renewed bullish momentum to the expanding global M2 money supply. His insights not only illuminate the future of Bitcoin price but also anchor its macroeconomic relevance in a broader financial context.

Bitcoin Price and Global Liquidity: A High-Impact Correlation
Crosby highlights a remarkable and consistent correlation—often exceeding 84%—between Bitcoin price and global M2 liquidity levels. As liquidity increases across the global economy, Bitcoin price typically responds with upward movement, although with a noticeable delay. Historical data supports the observation of a 56–60 day lag between monetary expansion and Bitcoin price increases.
This insight has recently proven accurate, as Bitcoin price rebounded from lows of $75,000 to above $85,000. This trend closely aligns with the forecasted recovery that Crosby and his team had outlined based on macro indicators, validating the strength and reliability of the correlation driving Bitcoin price upward.
Why the 2-Month Delay Impacts Bitcoin Price
The two-month delay in market response is a critical observation for understanding Bitcoin price movements. Crosby emphasizes that monetary policy and liquidity injections do not immediately affect speculative assets like BTC. Instead, there is an incubation period, typically around two months, during which liquidity filters through financial systems and begins to influence Bitcoin price.
Crosby has optimized this correlation through various backtests, adjusting timeframes and offsets. Their findings indicate that a 60-day delay yields the most predictive accuracy across both short-term (1-year) and extended (4-year) historical Bitcoin price action. This lag provides a strategic advantage to investors who monitor macro trends to anticipate Bitcoin price surges.
S&P 500 and Its Influence on Bitcoin Price Trends
Adding further credibility to the thesis, Crosby extends his analysis to traditional equity markets. The S&P 500 exhibits an even stronger all-time correlation of approximately 92% with global liquidity. This correlation strengthens the argument that monetary expansion is a significant driver not just for Bitcoin price, but also for broader risk-on asset classes.
By comparing liquidity trends with multiple indices, Crosby demonstrates that Bitcoin price is not an anomaly but part of a broader systemic pattern. When liquidity rises, equities and digital assets alike tend to benefit, making M2 supply an essential indicator for timing Bitcoin price movements.
Forecasting Bitcoin Price to $108,000 by June 2025
To build a forward-looking perspective, Crosby employs historical fractals from previous bull markets to project future Bitcoin price movements. When these patterns are overlaid with current macro data, the model points to a scenario where Bitcoin price could retest and potentially surpass its all-time highs, targeting $108,000 by June 2025.
This optimistic projection for Bitcoin price hinges on the assumption that global liquidity continues its upward trajectory. The Federal Reserve’s recent statements suggest that further monetary stimulus could be deployed if market stability falters—another tailwind for Bitcoin price growth.
The Rate of Expansion Affects Bitcoin Price
While rising liquidity levels are significant, Crosby stresses the importance of monitoring the rate of liquidity expansion to predict Bitcoin price trends. The year-on-year M2 growth rate offers a more nuanced view of macroeconomic momentum. Although liquidity has generally increased, the pace of expansion had slowed temporarily before resuming an upward trend in recent months.

This trend is strikingly similar to conditions observed in early 2017, just before Bitcoin price entered an exponential growth phase. The parallels reinforce Crosby’s bullish outlook on Bitcoin price and emphasize the importance of dynamic, rather than static, macro analysis.
Final Thoughts: Preparing for the Next Bitcoin Price Phase
While potential risks such as a global recession or a significant equity market correction persist, current macro indicators point toward a favorable environment for Bitcoin price. Crosby’s data-driven approach offers investors a strategic lens to interpret and navigate the market.
For those looking to make informed decisions in a volatile environment, these insights provide actionable intelligence grounded in economic fundamentals to capitalize on Bitcoin price opportunities.
For more deep-dive research, technical indicators, real-time market alerts, and access to a growing community of analysts, visit BitcoinMagazinePro.com.

Disclaimer: This article is for informational purposes only and should not be considered financial advice. Always do your own research before making any investment decisions.
Source link

Crypto Trader Says Solana Competitor Starting To Show Bullish Momentum, Updates Outlook on Bitcoin and Ethereum

weakness signals move toward lower support

Now On Sale For $70,000: The World’s First Factory Ready Open-Source Humanoid Robot

What Next for ETH as Traders Swap $86M into Solana DeFi protocols ?

Why Did Bitcoin Price (BTC) Fall on Wednesday Afternoon

Solana price is up 36% from its crypto market crash lows — Is $180 SOL the next stop?

Solana Retests Bearish Breakout Zone – $65 Target Still In Play?

How Expanding Global Liquidity Could Drive Bitcoin Price To New All-Time Highs

Apple Delists 14 Crypto Apps in South Korea Including KuCoin and MEXC Exchanges Amid Regulatory Crackdown

Athens Exchange Group eyes first onchain order book via Sui

Futureverse Acquires Candy Digital, Taps DC Comics and Netflix IP to Boost Metaverse Strategy
Court Grants Ripple And SEC’s Joint Motion To Suspend Appeal

AVAX Falls 2.1% as Nearly All Assets Trade Lower

What is a VTuber, and how do you become one in 2025?

Top Expert’s Update Sets $10 Target


 24/7 Cryptocurrency News5 months ago
Arthur Hayes, Murad’s Prediction For Meme Coins, AI & DeFi Coins For 2025

 Bitcoin3 months ago
Expert Sees Bitcoin Dipping To $50K While Bullish Signs Persist

 24/7 Cryptocurrency News3 months ago
Aptos Leverages Chainlink To Enhance Scalability and Data Access

 Bitcoin5 months ago
Bitcoin Could Rally to $80,000 on the Eve of US Elections

 Opinion5 months ago
Crypto’s Big Trump Gamble Is Risky

 Bitcoin5 months ago
Institutional Investors Go All In on Crypto as 57% Plan to Boost Allocations as Bull Run Heats Up, Sygnum Survey Reveals

 Altcoins3 months ago
Sonic Now ‘Golden Standard’ of Layer-2s After Scaling Transactions to 16,000+ per Second, Says Andre Cronje

 Ripple Price4 weeks ago
3 Voting Polls Show Why Ripple’s XRP Price Could Hit $10 Soon
