Bitcoin price
Economist Explains What Could Fuel 2025 Bitcoin Price Rally
Published
4 days agoon
By
admin
Alex Krüger, an economist and popular crypto analyst, explained how the US Federal Reserve’s stance in 2025 could serve as a tailwind for the ongoing Bitcoin rally. This comment from Krüger comes as BTC is up 4.34% from its January 1 swing low of $92,840. Bitcoin price today and trades at $3,456.1.


*bitcoin price updated as of 3 PM.
Economist Explains Key 2025 Tailwind For Bitcoin price Rally
As noted above, Alex Krüger, explained that the “timing of the Fed going back dovish” in 2025 could fuel Bitcoin price rally. A dovish Fed comment would mean that the interest rates could be slashed, triggering more borrowing and spending, aka a risk-on scenario. Such an outlook would mean that risky assets like Bitcoin, cryptocurrencies and stocks could shoot higher.
Krüger adds that Fed’s dovish comment in 2025 could disrupt crypto’s habit of forming a top around the end of first quarter. He supports this statement by adding that Bitcoin and cryptocurrency market would follow suit if “equities ramp up hard in March or April.”
He concludes his bullish X post by noting that the macro outlook “trumps” seasonality and Bitcoin’s popular four-year cycles.
Bitcoin Technical Analysis: Has BTC Price Rally Begun?
CME’s one-hour Bitcoin price chart shows a gap, extending from $94,495 to $94,970, created between December 31, 2024, and January 1, 2025. Typically, price fills these gaps via a retracement or pullback in an act of rebalancing. Hence, despite the recent run-up in the past 48 hours, Bitcoin could retrace lower to fill the aforementioned gap seen on the CME BTC price chart.
Moreover, the start and end of the day, week, quarter and year tend to witness added volatility, which is not just limited to cryptocurrencies but also the stock market. Hence, there is a high chance that Bitcoin retraces into the CME gap, stretching from $94,500 to $94,970.
This short-term retracement is unlikely to end the Bitcoin price recovery rally, which began at the start of a new year. Hence, investors can remain confident as the long-term bullish outlook and the recovery bounce remains intact.


However, if Bitcoin price fails to hold above the $93,000 support level, it could jeopardize the uptrend. If a daily candlestick closes below the said level, it would invalidate the bullish thesis and trigger a further correction. Bitcoin price prediction, in this instance, indicates a near-3% crash to $90,000.
Bitcoin Price Targets If BTC Dips Below $90,000
Over the past six months or so, the Bitcoin price has crashed at the start of every month. This correction sweeps the lows created at the end of the previous month. This drop is a great buying opportunity because every single sweep after the start of the new month has led to at least a 24% rally in the next three weeks or less. The highest rally BTC witnessed after such a deviation was in November, where the biggest crypto by market cap rose nearly 50%.
If history rhymes, then a drop below $90,000 is likely. Following this dip, if BTC rallies 24% from $90,000, investors can expect an all-time high of roughly $113,000. However, a 50% gain would put Bitcoin price at $135,000.


Bitcoin looks increasingly promising from a technical perspective. Economist Alex Krüger’s insights suggest that the US Federal Reserve’s stance could serve as a tailwind for the ongoing Bitcoin rally. The potential for a dovish Fed comment to disrupt crypto’s seasonal trends and fuel a risk-on scenario is a significant bullish indicator. Krüger notes that the macro outlook “trumps” seasonality and Bitcoin’s popular four-year cycles, making a strong case for a continued rally. From a technical analysis standpoint, Bitcoin price could hit $113K or $135K if history rhymes.
Source link
You may like


Coinbase (COIN) Stock Could Become Available on Base Chain, According to Creator Jesse Pollak


Anchors Are Evil! Bitcoin Core Is Destroying Bitcoin!


Tether, top crypto exchange to swap $1b USDT to Tron network


Top Altcoins to Buy in 2025 That Could Skyrocket in 60 Days


MicroStrategy Continues Weekly Bitcoin Buying Spree With Another $101 Million


New Pi Cycle Top Prediction Chart Identifies Bitcoin Price Market Peaks with Precision
Bitcoin Magazine Pro
New Pi Cycle Top Prediction Chart Identifies Bitcoin Price Market Peaks with Precision
Published
5 hours agoon
January 6, 2025By
admin

Bitcoin investors and analysts constantly seek innovative tools and indicators to gain a competitive edge in navigating volatile market cycles. A recent addition to this arsenal is the Pi Cycle Top Prediction chart, now available on Bitcoin Magazine Pro. Designed for professional and institutional investors, this chart builds on the widely recognized Pi Cycle Top indicator—a tool that has historically pinpointed Bitcoin’s market cycle peaks with remarkable accuracy.
🚨 NEW FREE CHART ALERT 🚨
Following the amazing feedback we received on our video series:
'Mathematically Predicting the BTC Peak'
We decided to recreate the data we used and provide it in a new and completely FREE indicator:
🔥 Bitcoin Pi Cycle Top Prediction 🔥
This… pic.twitter.com/9DqRWGhhGr
— Bitcoin Magazine Pro (@BitcoinMagPro) January 6, 2025
Understanding the Pi Cycle Top Prediction Indicator
The Pi Cycle Top Prediction chart enhances the concept of its predecessor by projecting future potential crossover points of two key moving averages:
- 111-day Moving Average (111DMA)
- 350-day Moving Average multiplied by two (350DMA x2)
By calculating the rate of change of these two moving averages over the past 14 days, the tool extrapolates their trajectory into the future. This approach provides a predictive estimate of when these two averages will cross, signaling a potential market top.
Historically, the crossover of these moving averages has been closely associated with Bitcoin’s cycle tops. In fact, the original Pi Cycle Top indicator successfully identified Bitcoin’s previous cycle peaks to within three days, both before and after its creation.
Implications for Market Behavior
When the 111DMA approaches the 350DMA x2, it suggests that Bitcoin’s price may be rising unsustainably, often reflecting heightened speculative fervor. A crossover typically signals the end of a bull market, followed by a price correction or bear market.
For professional investors, this tool is invaluable as a risk management mechanism. By identifying periods when market conditions might be overheating, it allows investors to make informed decisions about their exposure to Bitcoin and adjust their strategies accordingly.
Key Prediction: September 17, 2025
The current projection estimates that the moving averages will cross on September 17, 2025. This date represents a potential market top, offering investors a timeline to monitor and reassess their positions as market dynamics evolve. Users can view this projection in detail by hovering over the chart on the Bitcoin Magazine Pro platform.
Origins and Related Tools
The Pi Cycle Top Prediction indicator was conceptualized by Matt Crosby, Lead Analyst at Bitcoin Magazine Pro. It builds on the original Pi Cycle Top indicator, created by Philip Swift, Managing Director of Bitcoin Magazine Pro. Swift’s Pi Cycle Top has become a trusted resource among Bitcoin analysts and investors for its historical accuracy in identifying market peaks.
Investors interested in a deeper exploration of market cycles can also refer to:
- The Original Pi Cycle Top Indicator: View the chart
- The Pi Cycle Top and Bottom Indicator: View the chart
Video Explainer and Educational Resources
For a comprehensive explanation of the Pi Cycle Top Prediction chart, investors can watch a detailed video by Matt Crosby, available here. This video provides an overview of the methodology, practical applications, and historical context for this predictive tool.
Why This Matters for Professional Investors
In a market as dynamic and unpredictable as Bitcoin, professional investors require sophisticated tools to anticipate and respond to significant market shifts. The Pi Cycle Top Prediction chart offers:
- Data-Driven Insights: By leveraging historical data and predictive modeling, the chart delivers actionable insights for portfolio management.
- Timing Precision: The ability to estimate cycle tops with a high degree of accuracy enhances strategic decision-making.
- Risk Mitigation: Early warning signals of market overheating empower investors to protect their portfolios from potential downside risks.
As Bitcoin matures into an asset class increasingly adopted by institutional investors, tools like the Pi Cycle Top Prediction chart become essential for understanding and navigating its unique market cycles. By integrating this chart into their analytical toolkit, investors can deepen their insights and improve their long-term investment outcomes.
To explore live data and stay informed on the latest analysis, visit bitcoinmagazinepro.com.
Disclaimer: This article is for informational purposes only and should not be considered financial advice. Always do your own research before making any investment decisions.
Source link
24/7 Cryptocurrency News
Analyst Reveals Timeline When Bitcoin Price Could Jump To $140,000
Published
1 week agoon
December 29, 2024By
admin
Crypto analyst Jelle has provided a bullish outlook for the Bitcoin price for the remainder of this market cycle. The analyst predicted that the flagship crypto will reach $140,000 and revealed when this price surge could likely happen.
When The Bitcoin Price Will Jump To $140,000
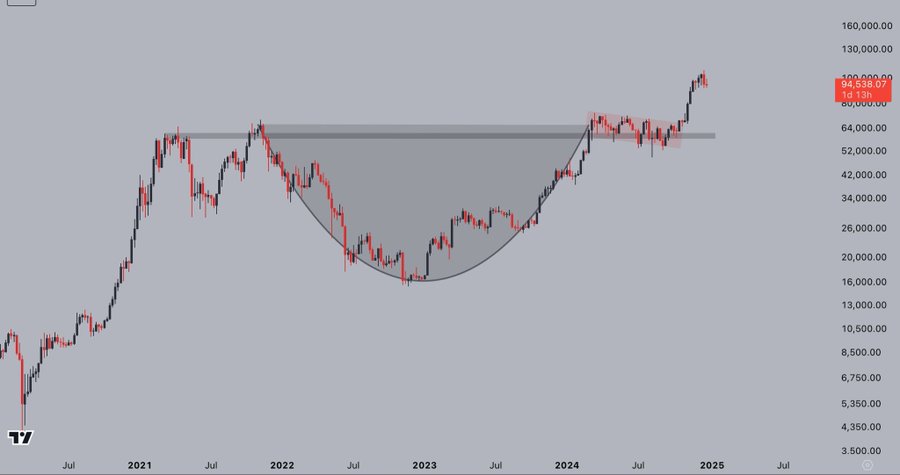
In an X post, Crypto Jelle predicted that the Bitcoin price could rally to $140,000 in the next three months. This came as the analyst highlighted a cup and handle pattern, which put BTC’s price target at this level.
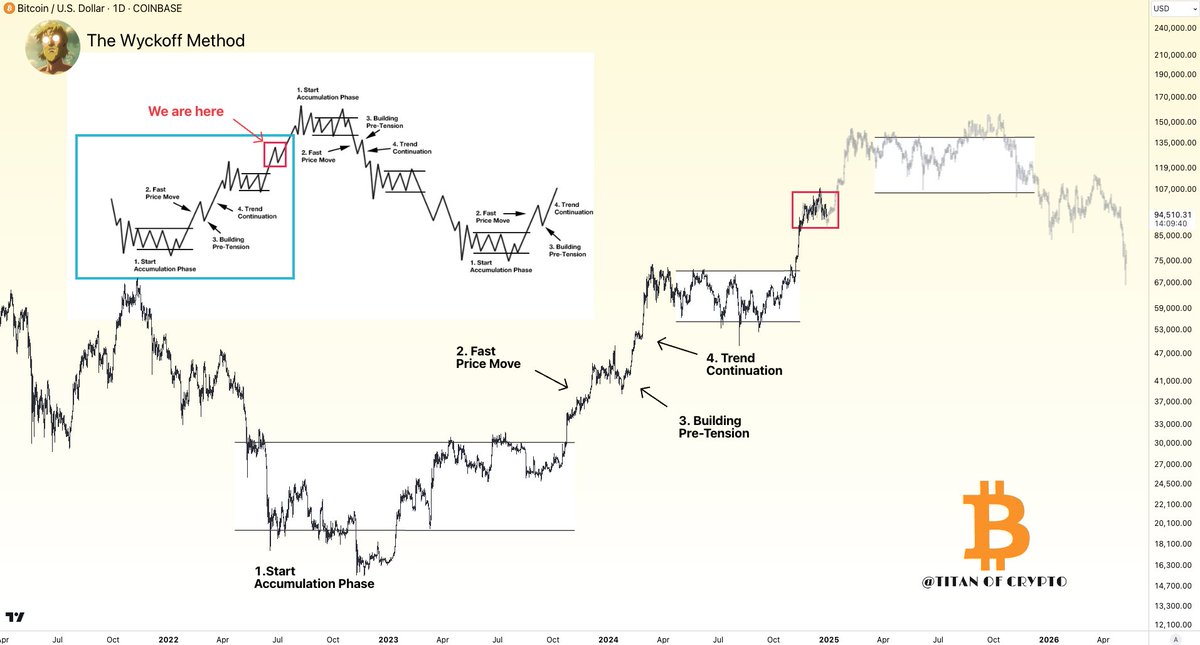
Crypto analyst Titan of Crypto also suggested that Bitcoin could rally to $140,000 in the next three months. In an X post, the analyst shared an accompanying chart, which he tagged as the ‘Bitcoin 2025 Roadmap.’
The accompanying chart showed that the Bitcoin price could reach $140,000 at the start of the new year. However, this price is unlikely to mark the top for Bitcoin, as it could still surge to $150,000.
Other market experts have even provided a more bullish outlook for the flagship crypto. Engineer Ted Boydston predicted that BTC could hit $225,000, the biggest bull run for the flagship crypto.
Meanwhile, renowned finance author Robert Kiyosaki predicted that the flagship crypto will hit $350,000 in 2025. While it remains to be seen if the flagship crypto could reach such heights, fundamentals such as Donald Trump’s inauguration support a bullish continuation.
A Price Rebound Is Imminent
In an X post, crypto analyst Ali Martinez stated that the Bitcoin price could be preparing for a rebound. The analyst mentioned that Bitcoin is showing a bullish divergence on the hourly chart against the Relative Strength Index (RSI).
The analyst added that the percentage of Binance traders going long on BTC has increased from 53.12% to 64%. These traders are said to have a solid record of being right.
Martinez further stated that the Bitcoin price needs to break above $94,800 to confirm this rebound. A break above this level could send BTC to $95,300 or even $96,000.
On the flip side, the analyst warned that if Bitcoin drops below $93,600, the bull case is off the table as the flagship crypto could drop to $84,000 or even $70,000.
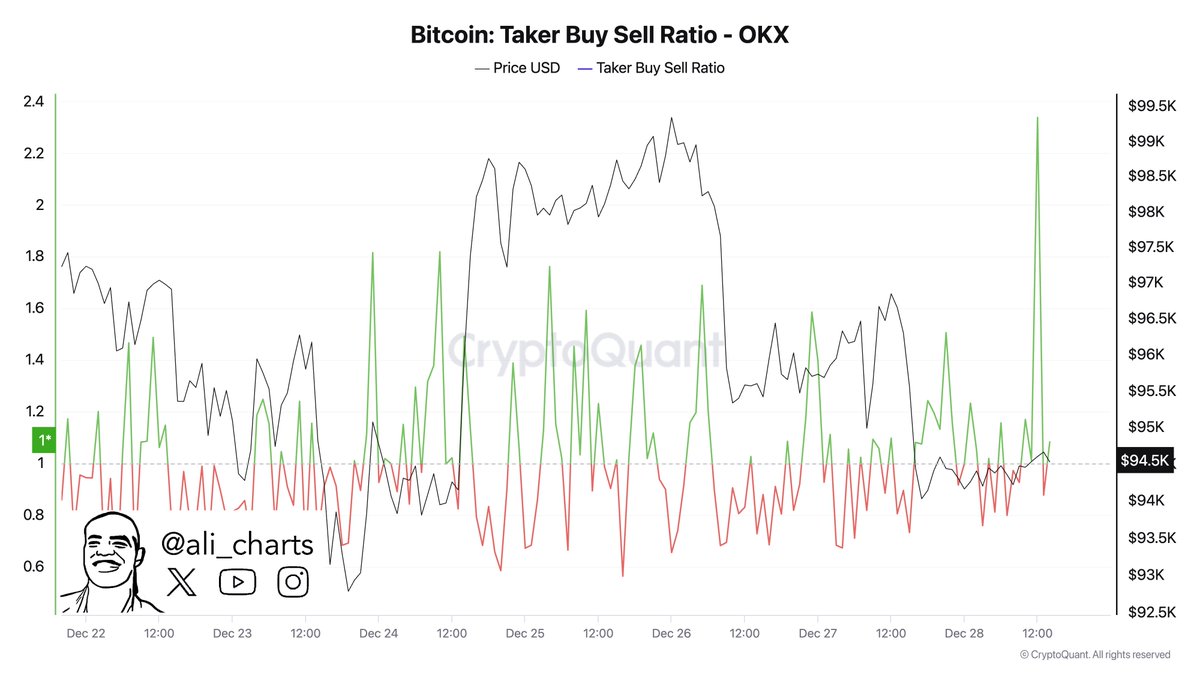
However, the bullish case is looking more likely. In another X post, the analyst revealed that there was a spike in Bitcoin’s Taker Buy/Sell ratio on the top crypto exchange OKX. This indicates a surge in aggressive buying, which is a sign of upward momentum ahead.
Boluwatife Adeyemi
Boluwatife Adeyemi is a well-experienced crypto news writer and editor who has covered topics that cut across DeFi, NFTs, smart contracts, and blockchain interoperability, among others. Boluwatife has a knack for simplifying the most technical concepts and making it easy for crypto newbies to understand. Away from writing, He is an avid basketball lover and a part-time degen.
Disclaimer: The presented content may include the personal opinion of the author and is subject to market condition. Do your market research before investing in cryptocurrencies. The author or the publication does not hold any responsibility for your personal financial loss.
Source link
Bitcoin
A 20%-30% Correction Is ‘The Most Bullish Thing’ That Could Happen To Bitcoin – Analyst
Published
1 week agoon
December 28, 2024By
admin
Bitcoin is navigating turbulent waters as its price continues to slide, searching for a stable support level amid growing uncertainty. The current downward momentum has sparked concerns among investors and analysts, with many questioning whether Bitcoin has reached its cycle top. Sentiment in the market has shifted dramatically, with fear replacing the once euphoric optimism that drove the cryptocurrency to recent highs.
Related Reading
Despite the unease, crypto analyst Ali Martinez offers a more optimistic perspective on the situation. In a recent analysis shared on X, Martinez suggested that a 20% to 30% correction could actually be the most bullish outcome for Bitcoin at this stage. He highlights how such pullbacks have historically set the stage for stronger rallies by shaking out weaker hands and allowing the market to reset before resuming its upward trajectory.
As Bitcoin’s price action teeters on the edge of a potential breakdown, all eyes are on the key support levels that could determine the next move. Will Bitcoin confirm the fears of a cycle top, or will a healthy correction provide the foundation for the next leg of its rally? The coming weeks will be crucial in shaping the narrative for the world’s leading cryptocurrency.
Bitcoin Correction Looms
Bitcoin appears on the verge of entering a critical correction phase, with the $92K level emerging as the line in the sand. Analysts and investors are increasingly concerned that a drop below this threshold—and potentially the $90K mark—could trigger a wave of selling pressure, driving the price into sub-$80K territory. The growing fear has cast a shadow over Bitcoin’s bullish narrative as many brace for potential downside risks.
Related Reading
However, not everyone sees this potential correction as bearish. Martinez offers a contrarian viewpoint, suggesting that a 20% to 30% correction could be the most bullish outcome for Bitcoin within the context of a bull trend.
Martinez presented a compelling chart showcasing every Bitcoin correction exceeding 20% during past bull markets. His findings reveal that each of these corrections acted as a reset for the market, shaking out weaker hands and paving the way for stronger rallies.
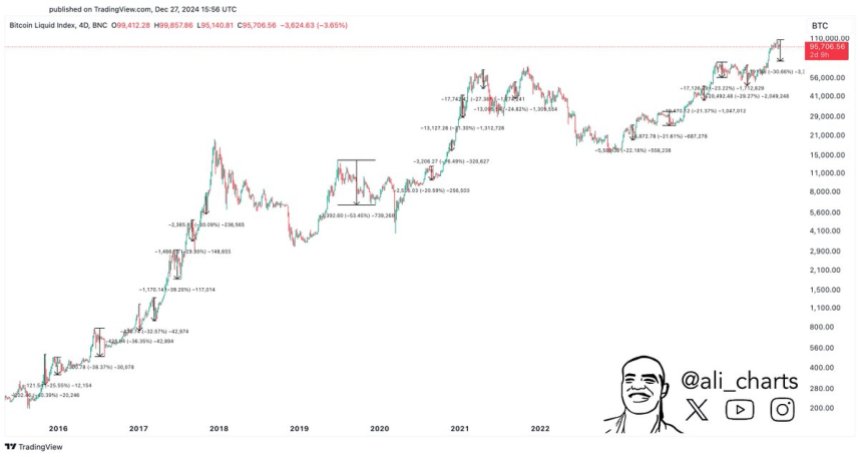
Martinez emphasizes that corrections are a natural and healthy component of Bitcoin’s price cycles, especially during bull runs. By allowing the market to recalibrate, they set the stage for sustained upward momentum. If Bitcoin does experience a significant pullback, it could be the precursor to a more robust and prolonged rally in the coming months.
BTC Testing ‘The Last Line Of Defense’
Bitcoin is currently trading at $94,500, grappling with sustained selling pressure and bearish price action. The market sentiment has shifted significantly in recent days, with fears of a deeper retracement gaining traction among analysts and investors. Many believe that if Bitcoin loses the $92,000 mark, it could open the door for an accelerated decline.
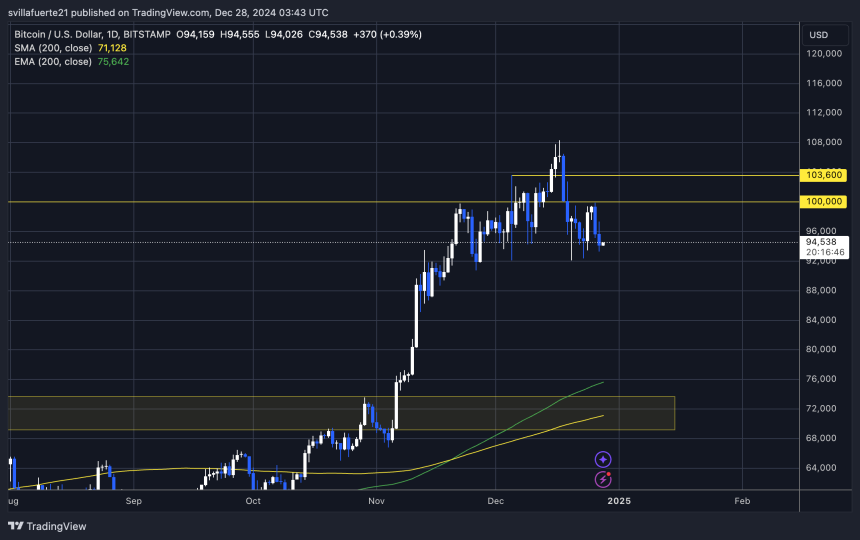
The $90,000 level is emerging as the critical support zone that Bitcoin must hold to maintain its bullish outlook. This level represents a psychological and technical barrier that could determine the cryptocurrency’s trajectory in the weeks ahead. If BTC manages to stay above $90K, analysts anticipate a strong recovery that could reignite bullish momentum and lead to a push toward previous highs.
Related Reading
However, the stakes are high. A decisive break below the $90,000 level would likely exacerbate selling pressure, driving Bitcoin into deeper correction territory. In such a scenario, prices could fall as low as $75,000, marking a significant pullback from recent highs.
Featured image from Dall-E, chart from TradingView
Source link
Coinbase (COIN) Stock Could Become Available on Base Chain, According to Creator Jesse Pollak

Anchors Are Evil! Bitcoin Core Is Destroying Bitcoin!

Tether, top crypto exchange to swap $1b USDT to Tron network
Top Altcoins to Buy in 2025 That Could Skyrocket in 60 Days
MicroStrategy Continues Weekly Bitcoin Buying Spree With Another $101 Million
New Pi Cycle Top Prediction Chart Identifies Bitcoin Price Market Peaks with Precision

SPX6900 price rockets to ATH: will SPX hit $2 soon?

Pepe Coin Price Set to Crash 30% As Top Holders Sell PEPE
MicroStrategy Buys a Further 1,020 Bitcoin
New crypto haven or US competitor: Russia approves crypto taxation
Ex-SEC Lawyer Affirms Settlement in XRP Lawsuit
These Are His Next Buys
UAE’s Bitcoin mining firm Phoenix Group expands in US ahead of Nasdaq listing: report
Shiba Inu Community Unveils TREAT Token Launch Date, Here’s When
Bithumb Meta Rebrands to Bithumb Partners for Investors

Telegram users can send gifts to friends, TON fails to pump

Ethereum’s lowered yield might signal a paradigmatic shift in the ecosystem

Bitcoin Could Rally to $80,000 on the Eve of US Elections

Institutional Investors Go All In on Crypto as 57% Plan to Boost Allocations as Bull Run Heats Up, Sygnum Survey Reveals

Crypto’s Big Trump Gamble Is Risky

A Kamala Presidency Could Be Just as Bullish for Bitcoin

Ripple-SEC Case Ends, But These 3 Rivals Could Jump 500x

SEC filing underway, Bitcoin rewards app Fold adopts FLD ticker

Arthur Hayes, Murad’s Prediction For Meme Coins, AI & DeFi Coins For 2025

Cardano and the XRP price action lock in bulls vs bears battle as RCO Finance prepares for 3,000% surge

A16z-backed Espresso announces mainnet launch of core product

Tether CEO Paolo Ardoino Denies Rumors That Stablecoin Issuer Is Under Federal Investigation

Crypto Exchange OKX Moves To Support USDC Ecosystem by Adding Six New Trading Pairs

Trump’s Coin Is About As Revolutionary As OneCoin

Ripple Vs. SEC, Shiba Inu, US Elections Steal Spotlight
Trending

 News3 months ago
Telegram users can send gifts to friends, TON fails to pump

 DeFi3 months ago
Ethereum’s lowered yield might signal a paradigmatic shift in the ecosystem

 Bitcoin2 months ago
Bitcoin Could Rally to $80,000 on the Eve of US Elections

 Bitcoin2 months ago
Institutional Investors Go All In on Crypto as 57% Plan to Boost Allocations as Bull Run Heats Up, Sygnum Survey Reveals

 Opinion2 months ago
Crypto’s Big Trump Gamble Is Risky

 Opinion3 months ago
A Kamala Presidency Could Be Just as Bullish for Bitcoin

 Price analysis2 months ago
Ripple-SEC Case Ends, But These 3 Rivals Could Jump 500x

 Bitcoin3 months ago
SEC filing underway, Bitcoin rewards app Fold adopts FLD ticker



✓ Share: