crypto analyst
ETH Recovers From Drop, Analyst Points At 2021 Rally
Published
8 hours agoon
By
admin
After Monday’s drop, Ethereum (ETH) fell below key support levels and hit its lowest price since November. Nonetheless, several market watchers remain bullish, predicting a massive rally for the cryptocurrency this quarter.
Related Reading
Ethereum Drops To Two Month Lows
Ethereum started the week with a significant correction, falling from the weekend range to its lowest price in two months. Over the weekend, Ethereum hovered between $3,200 and $3,340 after recovering from last week’s lows.
Amid this performance, crypto analyst Ali Martinez pointed out that ETH’s most critical resistance was between $3,360 and $3,450, where 4.37 million addresses bought 6.47 million ETH. The analyst also noted that the cryptocurrency’s key support was between the $3,066 and $3,160 price range, where 4.12 million addresses had bought 4.9 million ETH.
Ethereum tested this support zone during the December corrections, bouncing from the zone after the pullbacks. However, the king of Altcoins fell below this key support for the first time since November 9, hitting $2,920 on Monday.
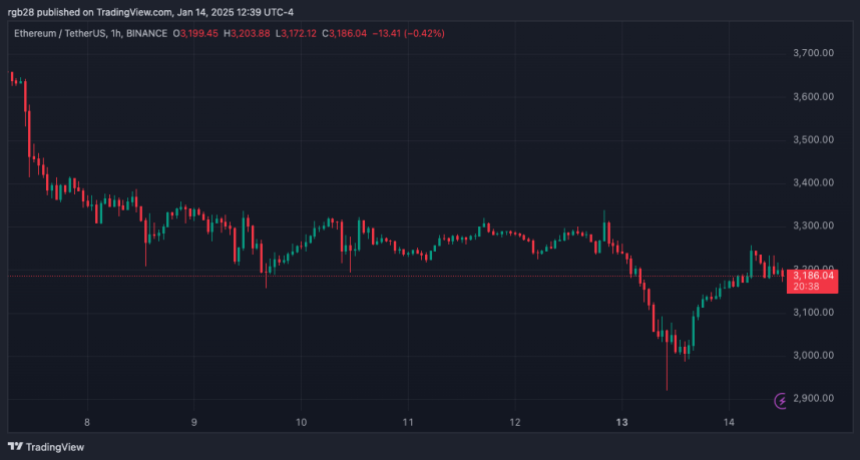
After the 12% retrace from the weekend highs, ETH tested its post-election breakout level, confirming the $2,900 price range as support. Ethereum quickly bounced from this level, surging 9% to the $3,100-$3,200 range.
Crypto investor Miky Bull considers ETH’s recent performance the “perfect setup for a massive reversal.” The trader noted this could be the reversal that leads to a breakout from Ethereum’s inverse head and shoulders pattern.
The second-largest cryptocurrency by market capitalization has been forming a multi-month inverse head and shoulder pattern, as noted by several analysts, with its left shoulder formed around the $2,800 price range.
Rekt Capital had suggested that “any pullback close to the $3,000 level could see Ethereum develop a right shoulder.” Meanwhile, Miky Bull stated that the bullish setup targeted the $7,000 mark.
ETH Resembles 2021 Trajectory
Analyst Crypto Bullet pointed out that ETH’s chart resembled its 2021 behavior. The chart shows Ethereum saw a Double Top pattern during its rally over three years ago. Then, the cryptocurrency fell below the key support zone of $3,100, confirming the pattern.
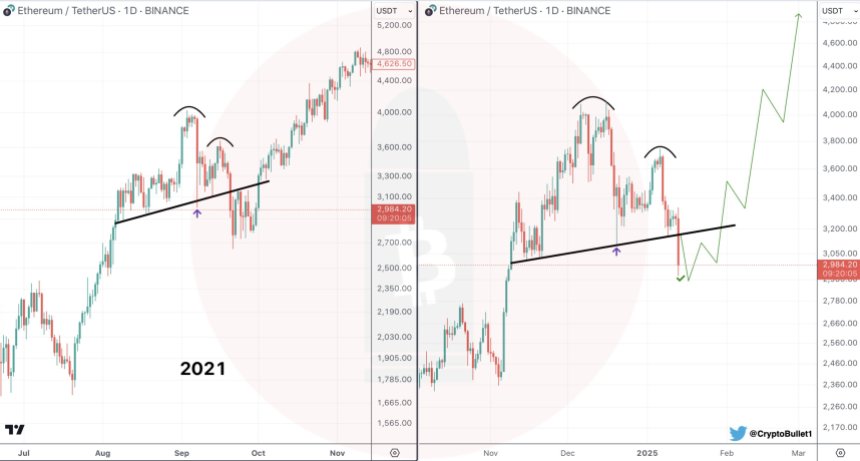
However, it reclaimed this level after consolidating for two weeks, which led to the breakout to ETH’s all-time high (ATH). According to the analyst, Ethereum is repeating this pattern after yesterday’s drop, suggesting that the cryptocurrency’s “worst-case scenario” would be hitting ATH levels again.
Daan Crypto Traders highlighted ETH’s historical performance during the start of the year, stating that “the percentages ETH does within its first few weeks of the year are pretty crazy.”
Related Reading
CoinGlass data shows that Ethereum registered mostly negative weekly returns in the first weeks of 2024 but started a 6-week positive streak as February approached. This could suggest that ETH’s negative performance could be reversed in the coming weeks. Nonetheless, Daan advised investors to look at the quarterly returns for a better overview of seasonality.
As of this writing, ETH is trading at $3,230, a 3% increase in the daily timeframe.
Featured Image from Unsplash.com, Chart from TradingView.com
Source link
You may like


Bitcoin Smashes $99,000 as Inflation Rises to 2.9% in December


Bitcoin DeFi Is Finding Product-market Fit With Runes


U.S. Listed Firms Continue Bitcoin (BTC) Treasury Adoption


Crypto.com rejects the CFTC’s request to suspend Super Bowl sports contracts in 50 states: report


Thailand Boosts Crypto Ambitions, Welcomes Bitcoin ETFs on Local Exchanges


You Should Not Wear This Bitcoin Shirt — Here's Why

With the new year approaching, some analysts forecasted a “very bullish” 2025 for Altcoins. The sector is expected to explode soon and kickstart the long-awaited “Altseason” after retesting a key support level.
Related Reading
Altcoins Retest Key Support Level
Amid the recent market’s performance, many Altcoins have struggled to record significant gains. However, several market watchers forecasted the start of the altcoin will come as soon as January 2025.
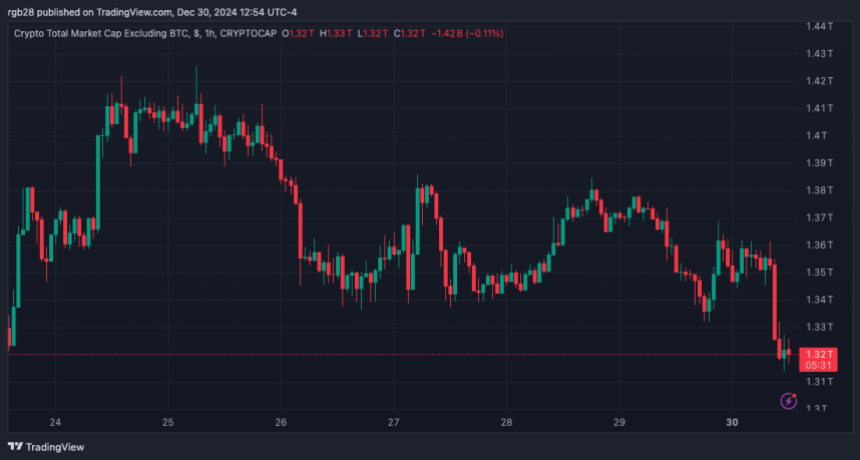
Fueled by the post-US election pump, the total crypto market capitalization, excluding Bitcoin and Ethereum, broke out on a three-year downtrend in mid-November, surpassing its yearly high of $788 billion. During this month’s rally, the sector surged to $1.1 trillion, its highest market cap since 2021.
Since then, Altcoins has struggled over the last two weeks, dropping nearly 26% as Bitcoin lost the $100,000 mark but remains above a key level despite the recent performance.
Crypto Jelle pointed out that the sector broke out and retested its “major trendline while destroying all leverage in the process.” The analyst highlighted that funding was “completely reset,” sentiment has been at its lowest, and the chart seems promising, adding he is “Very bullish for 2025.”
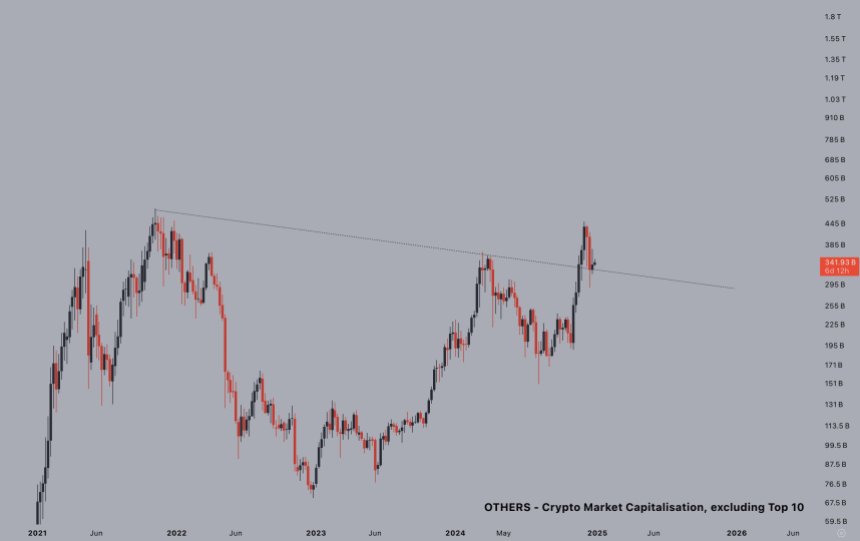
He also noted that Altcoins’ price action is “very similar” to Bitcoin’s first major pullback of 2021. Per the chart, the flagship crypto had a “strong rally, pullback, lower high, and chopping below the first low” before breaking out to new highs.
Based on this performance, Altcoins’ pullback is seemingly over, they “should start pushing back up soon if this keeps playing out the same.” Similarly, Michaël van de Poppe stated, “The correction is almost over, and the time for up only is on the horizon for Altcoins and Bitcoin. Expecting a lot to come.”
Altseason To Follow 2021’s Playbook?
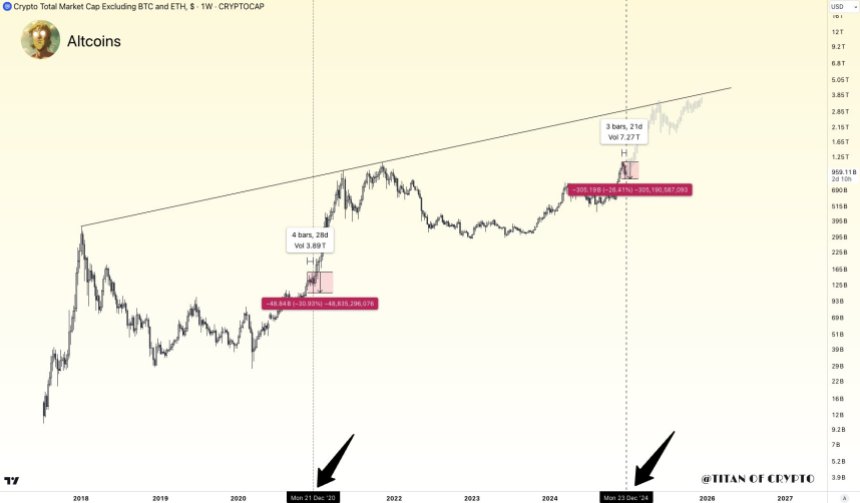
Titan of Crypto asserted that Altcoins are set to explode soon, suggesting that “the grand finale is around the corner.” Per the analyst’s chart, Altcoins have been in a two-year cup and handle pattern, breaking out of the pattern’s upper line during the recent market highs.
According to the pattern, Altcoins, excluding ETH, could see a 200% to a market capitalization of $1.4 trillion, surpassing 2021’s high of $1.13 trillion. The analyst also pointed out that, ahead of its 2021 rally, the sector saw a similar performance.
In 2020, Altcoins broke out in November and saw a significant 30% drop in early December, followed by a four-week recovery. Then, they recorded a 143% surge in January 2021, which led to other three-monthly green candles before the first major retrace.
Related Reading
Similarly, they’ve experienced a 26% drop this December, currently being on the third week out of the expected four-week recovery period. To the analyst, “Early January could mark the start of an ‘up only’ season.”
Lastly, Titan of Crypto added that, during the last two cycles, Altcoins’ initial rally lasted between 140 and 175 days, suggesting that this cycle’s rally could hit a new high around April or May. If it were to follow the past cycles’ performance, it could see a first pump around Q2 2025 before peaking in Q4.
Featured Image from Unsplash.com, Chart from TradingView.com
Source link
Analyst
Bitcoin Price Retests Support Line After Crash Below $95,000, Here’s The Next Target
Published
3 weeks agoon
December 28, 2024By
admin
The Bitcoin price has struggled to reclaim previous price highs above $100,000, with bearish sentiment dominating the market. Currently, the Bitcoin price is retesting the support line of an Ascending Channel after crashing below $95,000. A crypto analyst has predicted that if it can hold this key support level, it could stage a recovery and skyrocket to its next bullish target, aligning with the upper resistance line of the channel.
Bitcoin Price Retest Support Line; New Target In Sight
In a chart illustrating Bitcoin’s price movement within an Ascending Channel, Trader Tardigrade, a crypto analyst on X (formerly Twitter), revealed that the cryptocurrency has temporarily declined below the lower support line on the channel. The analyst labeled this decline a “False Break,” highlighting that the Ascending Channel remains intact despite the drop.
Related Reading
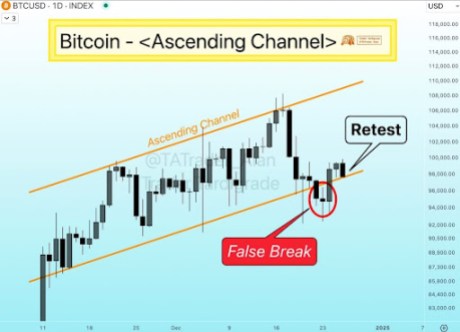
As indicated by the red circle in the price chart, the False Break suggests that Bitcoin’s brief move below the support level was short-lived and does not confirm the continuation of its previous downtrend. Trader Tardigrade noted that after Bitcoin’s False break, the cryptocurrency quickly moved back into the Ascending Channel to reclaim the lower support line.
Interestingly, Bitcoin’s drop below the False break comes as the pioneer cryptocurrency experienced a sharp price crash below $95,000. Lately, the flagship cryptocurrency has been under significantly bearish pressure, recording notable declines as market volatility intensifies.
Despite this bearish performance, Trader Tardigrade has disclosed that Bitcoin is now retesting the channel’s support line again, aiming to break above and trigger a price reversal. The analyst predicts that if Bitcoin can hold this support line, it will likely continue moving upwards within the channel.
Consequently, the analyst has forecasted that Bitcoin’s next price target would be the upper resistance line of the Ascending Channel. Looking at the price chart, the channel points upwards towards a range between $110,000 and $112,000.
If Bitcoin can successfully recover toward the upper resistance line, it could signal the continuation of a bullish trend within the Ascending Channel. Additionally, a breakout above the resistance line could further validate the bullish momentum, setting up a stage for Bitcoin to potentially target higher price levels and possibly retest its all-time high.
Related Reading
Analyst Says Bitcoin Could Crash To $87,000
Bitcoin is currently in a downward trend, experiencing severe price declines despite analysts’ optimistic projections of a price surge. According to crypto analyst Titan of Crypto, the Bitcoin price could see another decline, with the support level at $87,000 being the next target.
However, according to the analyst, a drop to this price low could bring “maximum pain” to both short—and long-term investors. Nevertheless, Titan of Crypto believes this severe price decline could also present a strong foundation for Bitcoin’s next price rally.
He emphasized that price movements are rarely linear, highlighting the crypto market’s inherent unpredictability and volatility. Despite Bitcoin’s bearish behavior, Titan of Crypto confidently predicts that a price rally to $110,000 is inevitable.
Featured image created with Dall.E, chart from Tradingview.com
Source link
Analyst
Here Are The Major Bitcoin Support Levels To Watch As Bulls Push For $100,000 Again
Published
3 weeks agoon
December 26, 2024By
admin
Crypto analyst Trade PSH has revealed the major Bitcoin support levels to watch out for as BTC bulls push for a rally to the psychological $100,000 level. The analyst also mentioned what price levels Bitcoin could reach in the short term as it breaks above $100,000.
Bitcoin Support Levels To Watch Out For As Bulls Push For $100,000
In a TradingView post, Trade PSH stated that the local maximum is $99,450 as bulls are repeatedly trying to push the price above $100,000. The crypto analyst also mentioned that the nearest key support zone comes in between $95,000 and $96,600. This aligns with a recent Bitcoinist report that highlighted the $96,000 level as a crucial support zone.
Related Reading
While the Bitcoin price is moving above this support zone, Trade PSH stated that the primary scenario is continued growth for the flagship crypto. If Bitcoin maintains an uptrend and eventually breaks above the psychological $100,000 level, the crypto analyst predicts that the intermediate growth target is between $102,000 and $102,757.
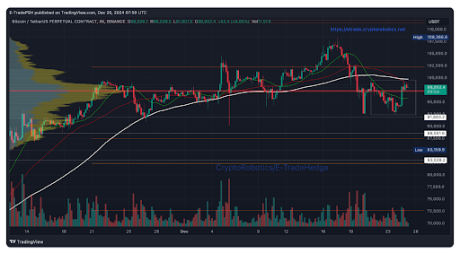
Based on the current price action, the analyst suggested that Bitcoin could rally to $108,366. This would mark a new all-time high (ATH) for the flagship crypto, as its current ATH is $108,268. Meanwhile, Trade PSH mentioned that a drop below $94,300 would invalidate this trade setup.
The analyst’s accompanying chart showed that the Bitcoin price could break above $100,000 and reach these short-term targets before the year ends. While that remains to be seen, it is worth mentioning that January 2025 provides a bullish outlook for the flagship crypto.
Pro-crypto Donald Trump is set to take office on January 20, which could lead to the creation of the Strategic Bitcoin Reserve. Historically, Bitcoin also enjoyed a price recovery in January 2021 of the last bull run. As such, history could repeat itself again.
BTC Is Heading Higher
In an X post, crypto analyst Titan of Crypto also provided a bullish outlook for the Bitcoin price, stating that the flagship crypto is heading higher. His accompanying chart showed that Bitcoin could rally to as high as $158,000 by May 2025. The chart also showed a price target above $220,000, suggesting that the flagship crypto could rally even higher.
Related Reading
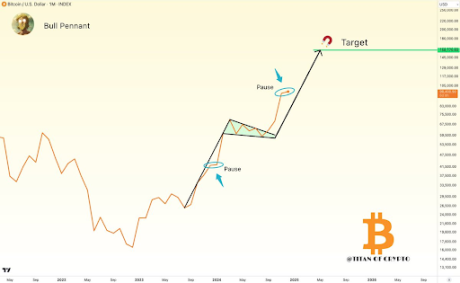
Titan of Crypto alluded to a bullish pennant, which he suggested was still in play for the Bitcoin price. This massive bull pennant is forming in the monthly timeframe, and if it plays out, the crypto analyst is confident that Bitcoin will enjoy a parabolic rally to this price target.
At the time of writing, the Bitcoin price is trading at around $98,100, down in the last 24 hours, according to data from CoinMarketCap.
Featured image created with Dall.E, chart from Tradingview.com
Source link

Bitcoin Smashes $99,000 as Inflation Rises to 2.9% in December

Bitcoin DeFi Is Finding Product-market Fit With Runes

U.S. Listed Firms Continue Bitcoin (BTC) Treasury Adoption

Crypto.com rejects the CFTC’s request to suspend Super Bowl sports contracts in 50 states: report

Thailand Boosts Crypto Ambitions, Welcomes Bitcoin ETFs on Local Exchanges

ETH Recovers From Drop, Analyst Points At 2021 Rally

You Should Not Wear This Bitcoin Shirt — Here's Why

Four Under-the-Radar Altcoins Witnessing ~10x Surge in Number of New Wallets Created in One Week: Santiment

Satoshi Action Fund raises $300,000 as it advances Bitcoin advocacy

US SEC Delays Decision on Bitwise 10 Crypto Index Fund

AI Agent Tokens Skyrocket as Franklin Templeton Highlights ‘Significant Promise’

Syria Exploring The Embrace of Bitcoin

Hashed’s Simon Kim Says AI Has a ‘Black Box’ Problem

Expert who predicted Bitcoin’s 2017 surge says XYZVerse could be the next big thing

How Coinbase vs SEC Ruling Could Influence XRP Case

Ethereum’s lowered yield might signal a paradigmatic shift in the ecosystem

Arthur Hayes, Murad’s Prediction For Meme Coins, AI & DeFi Coins For 2025

Telegram users can send gifts to friends, TON fails to pump

Institutional Investors Go All In on Crypto as 57% Plan to Boost Allocations as Bull Run Heats Up, Sygnum Survey Reveals

Bitcoin Could Rally to $80,000 on the Eve of US Elections

Crypto’s Big Trump Gamble Is Risky

A Kamala Presidency Could Be Just as Bullish for Bitcoin

Ripple-SEC Case Ends, But These 3 Rivals Could Jump 500x

SEC filing underway, Bitcoin rewards app Fold adopts FLD ticker

Cardano and the XRP price action lock in bulls vs bears battle as RCO Finance prepares for 3,000% surge

Tether CEO Paolo Ardoino Denies Rumors That Stablecoin Issuer Is Under Federal Investigation

A16z-backed Espresso announces mainnet launch of core product

Crypto Exchange OKX Moves To Support USDC Ecosystem by Adding Six New Trading Pairs

Trump’s Coin Is About As Revolutionary As OneCoin

Ripple Vs. SEC, Shiba Inu, US Elections Steal Spotlight
Trending

 DeFi3 months ago
Ethereum’s lowered yield might signal a paradigmatic shift in the ecosystem

 24/7 Cryptocurrency News2 months ago
Arthur Hayes, Murad’s Prediction For Meme Coins, AI & DeFi Coins For 2025

 News3 months ago
Telegram users can send gifts to friends, TON fails to pump

 Bitcoin2 months ago
Institutional Investors Go All In on Crypto as 57% Plan to Boost Allocations as Bull Run Heats Up, Sygnum Survey Reveals

 Bitcoin2 months ago
Bitcoin Could Rally to $80,000 on the Eve of US Elections

 Opinion2 months ago
Crypto’s Big Trump Gamble Is Risky

 Opinion3 months ago
A Kamala Presidency Could Be Just as Bullish for Bitcoin

 Price analysis2 months ago
Ripple-SEC Case Ends, But These 3 Rivals Could Jump 500x


