
Bitcoin
Bitcoin Deep Dive Data Analysis & On-Chain Roundup
Bitcoin appears poised for significant upside movement following a strong start to 2025. However, questions remain about the market’s overall health and whether the current bullish momentum can be sustained over the coming weeks and months. Here, we’ll take an unbiased and data-driven look into the underlying numbers supporting our current trend.
For a more in-depth look into this topic, check out a recent YouTube video here: Bitcoin Data Driven Analysis & On-Chain Roundup
Miner Recovery
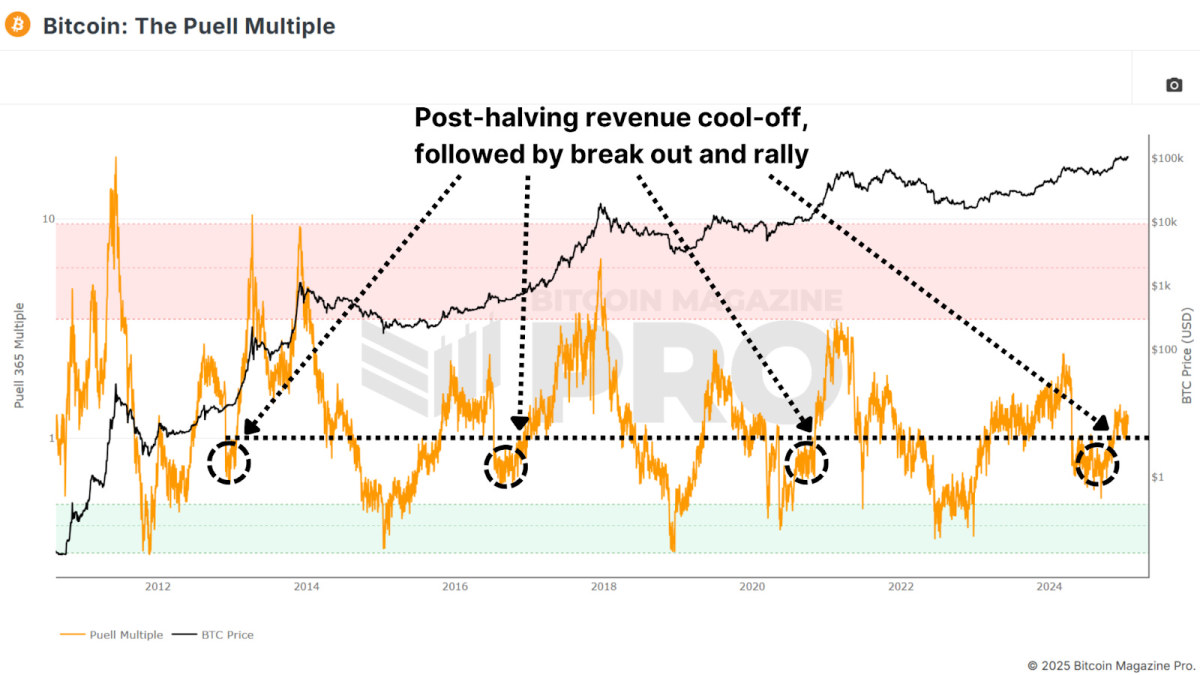
The Puell Multiple, a measure comparing miners’ daily USD revenue to its yearly average, suggests that Bitcoin’s fundamental network strength remains strong. Historically, after a halving event, miner revenue experiences a significant dip due to the 50% block reward reduction. However, the Puell Multiple recently climbed above the key value of 1, indicating a recovery and a potentially bullish phase.


Previous cycles show that crossing and retesting the value of 1 often precedes major price rallies. This pattern is repeating, signaling strong market support from mining activity.
Substantial Upside Potential
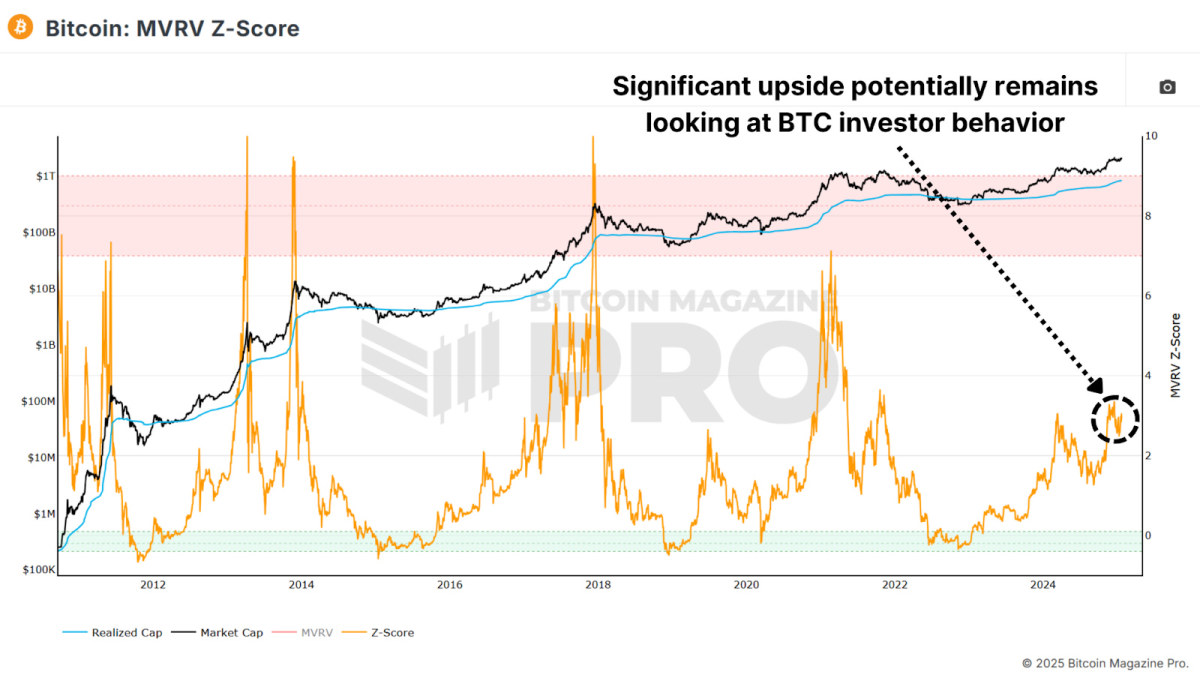
The MVRV Z-Score, a metric analyzing Bitcoin’s market value relative to its realized value, or average accumulation price for all BTC, suggests current values remain well below historical peak regions, outlining considerable room for growth.
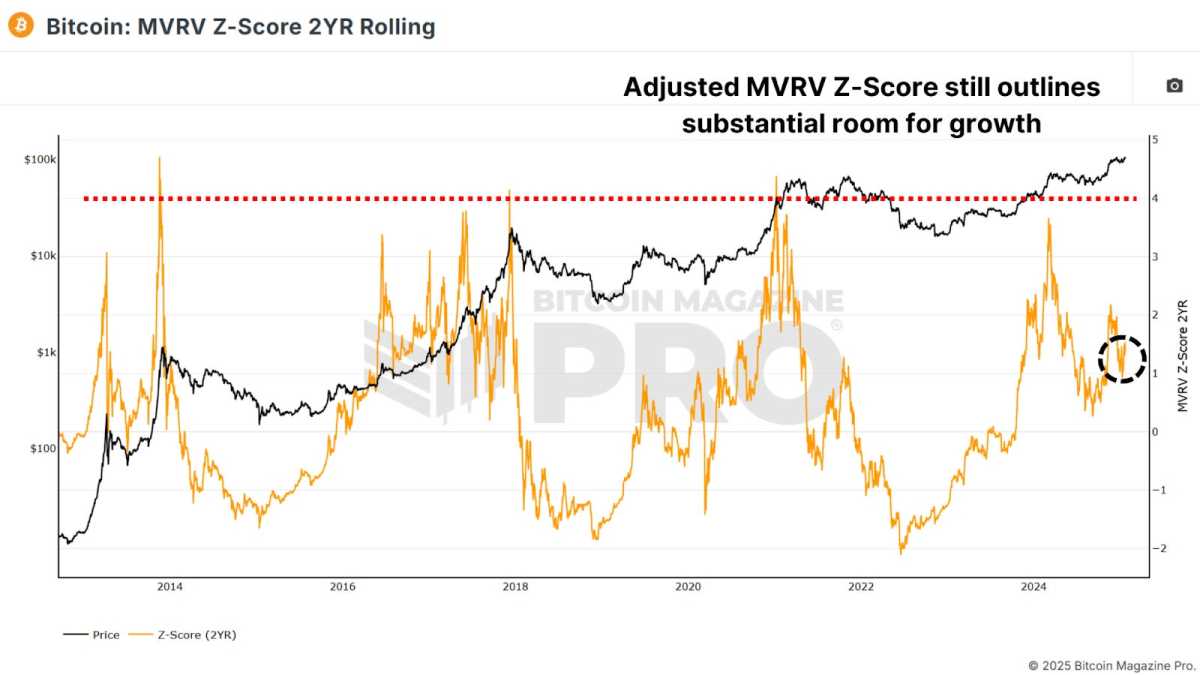
A two-year rolling version of the MVRV Z-Score, which adjusts for evolving market dynamics, also shows bullish potential. Even by this adjusted measure, Bitcoin is far from previous cycle peak levels, leaving the door open for further price appreciation.
Related: We’re Repeating The 2017 Bitcoin Bull Cycle
Sustainable Sentiment
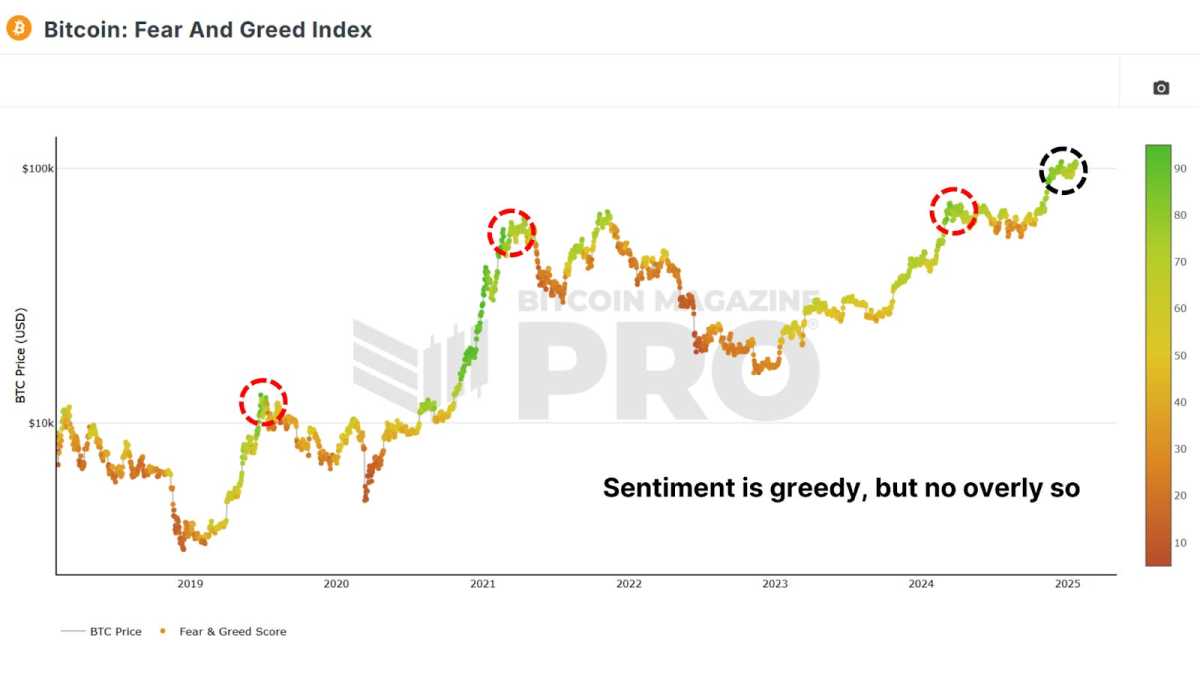
The Bitcoin Fear and Greed Index is currently at a healthy and sustainable amount of Greedy sentiment, indicating greedy but sustainable sentiment. Historical data from the 2020-2021 bull cycle shows that greed levels around 80-90 can persist for months, supporting prolonged bullish momentum. Only when values approach extreme levels (95+) does the market typically face significant corrections.
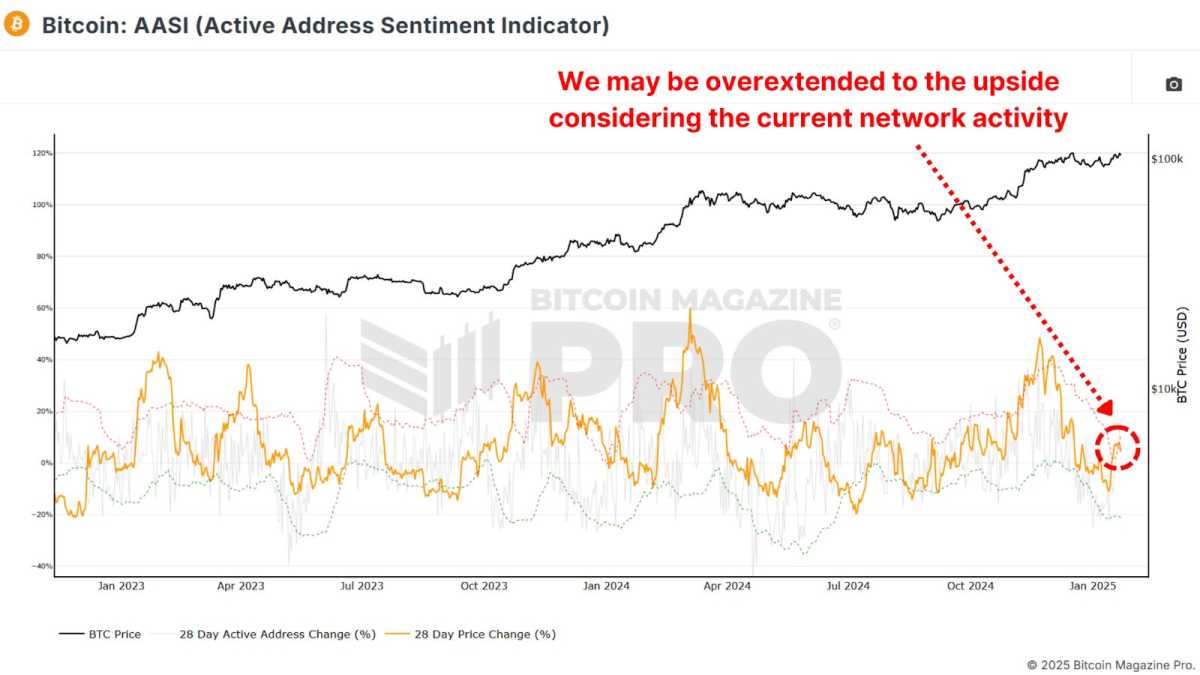
Network Activity
The Active Address Sentiment Indicator reveals a slight dip in network activity, suggesting retail investors have yet to fully re-enter the market. However, this could be a positive sign, indicating untapped retail demand that might fuel the next leg of the rally.
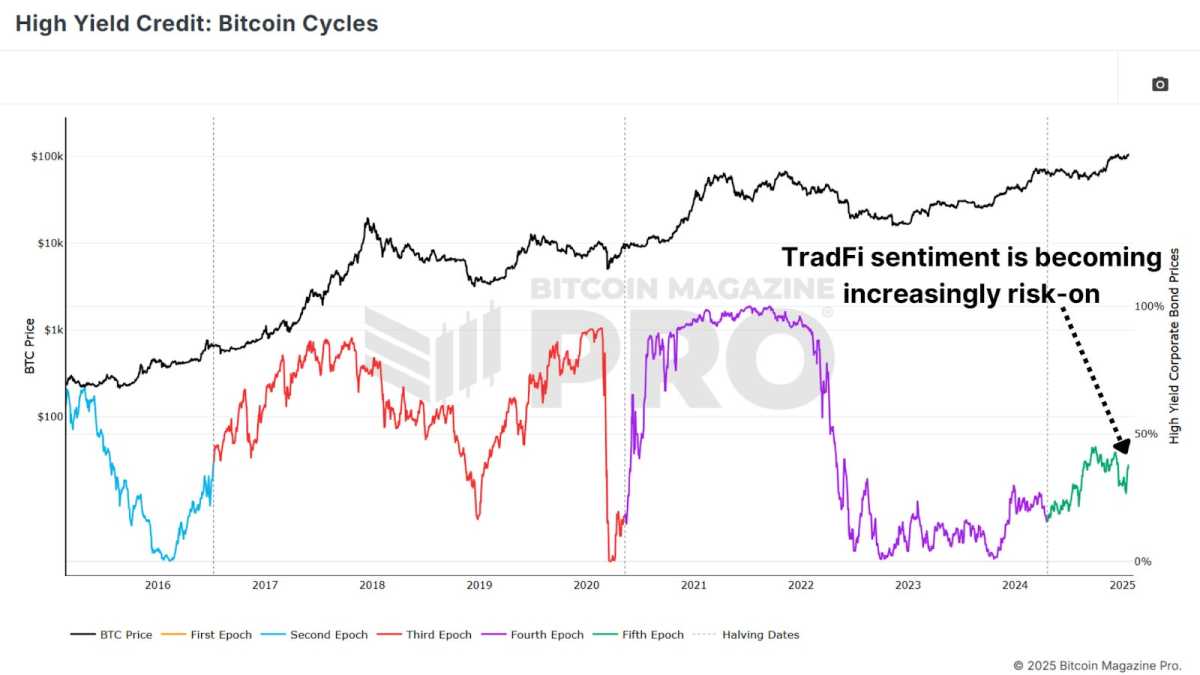
Risk Appetite Shifts
Traditional market sentiment is showing improving signals. High Yield Credit appetite is increasing as the macro-economic environment shifts to a more risk-on outlook. Looking at corporate bonds that offer higher interest rates due to their lower credit ratings compared to investment-grade bonds. Historically, there has been a strong correlation between Bitcoin’s performance and periods of heightened global risk appetite, which have often aligned with bullish phases in Bitcoin’s price.
Related: What Bitcoin Price History Predicts for February 2025
Conclusion
Bitcoin’s on-chain metrics, market sentiment, and macro perspective all point to a continuation of the current bull market. While short-term volatility is always possible, the convergence of these indicators suggests that Bitcoin is well-positioned to reach and potentially surpass our current all-time high in the near future.
For more detailed Bitcoin analysis and to access advanced features like live charts, personalized indicator alerts, and in-depth industry reports, check out Bitcoin Magazine Pro.
Disclaimer: This article is for informational purposes only and should not be considered financial advice. Always do your own research before making any investment decisions.
Source link


Bitcoin
Crypto Pundit Makes Case For Bitcoin Price At $260,000, But This Invalidation Level Threatens The Rally

Reason to trust
![]()
Strict editorial policy that focuses on accuracy, relevance, and impartiality
Created by industry experts and meticulously reviewed
The highest standards in reporting and publishing
Strict editorial policy that focuses on accuracy, relevance, and impartiality
Morbi pretium leo et nisl aliquam mollis. Quisque arcu lorem, ultricies quis pellentesque nec, ullamcorper eu odio.
A prominent crypto pundit has outlined a compelling case for the Bitcoin price outlook, predicting a surge to a target as high as $260,000 this bull cycle. However, a critical invalidation level stands in the way of this bullish scenario, threatening Bitcoin’s projected rally if breached.
On March 26, Gert van Lagen, a well-known crypto analyst on the X social media platform, predicted that the Bitcoin price could hit a bullish target between $200,000 and $300,000. The analyst’s chart suggests that Bitcoin’s price action in the past few years has closely followed a classic market cycle structure, moving through the Accumulation, Redistribution, Re-accumulation, and Distribution phases.
Bitcoin Price Eyes New ATH Above $260,000
Related Reading
After consolidating for seven months in mid-2023 – early 2024, Bitcoin formed a range, allowing the market to absorb supply before another price breakout. Notably, this trend continued in 2025, with BTC breaking out of a seven-month re-accumulation phase.
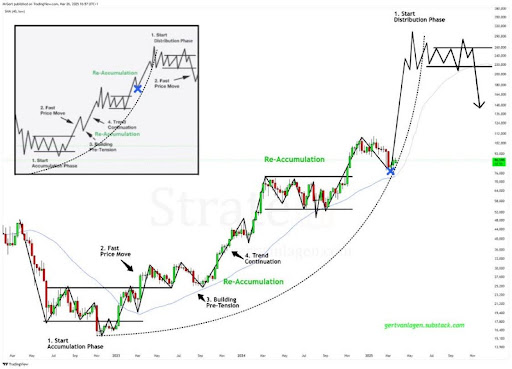
Based on the trajectory of Lagen’s price chart, Bitcoin’s next leg up is a sharp rise to $240,000, followed by a brief correction before rallying to a price peak between $290,000 and $300,000. After hitting this ATH, the analyst predicts that Bitcoin will decline and undergo a period of choppy trading, experiencing price fluctuations between $220,000 and $260,000.
Interestingly, Bitcoin’s projected rise to an ATH and the following sideways trading are expected to occur during its distribution phase, which is typically characterized by increased sell-offs and market volatility. Once BTC experiences a final surge to $260,000, Lagen predicts a price crash toward $148,000 – $136,000, marking the possible end of the bull rally and the start of the bear market.
Key Invalidation Level Threatening BTC’s Rally
Lagen’s optimistic price forecast for Bitcoin is being threatened by a key invalidation level, which could halt the cryptocurrency’s potential surge to $200,000 – $300,000. Although Bitcoin’s bullish structure remains intact, the analyst warns that a weekly close below the 40-week LSMA would invalidate its breakout.
Related Reading
As of writing, the Bitcoin price is consolidating above this key invalidation level at $73,900. As long as it holds above this level, Lagen believes that its bullish trajectory will be sustained. However, a drop below $73,900, which already represents a 15% decline from BTC’s current market price, could postpone the projected surge or cancel it altogether.
Featured image from Adobe Stock, chart from Tradingview.com
Source link

As the risk of tariff-related uncertainty persists into the second quarter, the crypto market could face another dip following the recent correction in March, analysts at Nansen say.
As the industry heads into April, Bitcoin (BTC) and the wider crypto market could be staring down another dip as uncertainty surrounding tariffs and U.S. trade policy might cause further volatility.
According to Nansen’s analysts, there’s a chance that the market may face another correction in the weeks after April 2. In fact, the researchers believe there’s a 70% likelihood that another price dip will occur after this date.

President Donald Trump had earlier promised to roll out new tariffs on April 2, calling it a key moment for the economy just weeks after the last round shook up markets and sparked recession worries.
In a recent interview with crypto.news, Aurelie Barthere, principal research analyst at Nansen, shared her outlook on the market, stating that after a brief correction following April 2, she expects the market to stabilize and pave the way for future growth.
“In my main scenario, 70% subjective likelihood, I expect another leg down in crypto prices after April 2 after we reached a local bottom in mid-March. After this second correction, I expect we will be bottoming for the rest of the year (continuation of the bull market and revisit of the ATHs for BTC).”
Aurelie Barthere
However, it’s not all doom and gloom for the crypto market. While another dip isn’t ruled out, Barthere suggests that after that correction, Bitcoin could rebound, benefiting from a supportive macro environment, including the growing adoption of crypto in the U.S. and a lack of recession signals. Still, Barthere remains cautious as for the remaining 30% “it would be if we have already bottomed or if this is just a dead cat bounce for U.S. equities and crypto,” she said.
“For the remaining 30%: it would be if we have already bottomed or if this is just a dead cat bounce for U.S. equities and crypto (in case of a recession, which is not my base case, I think the U.S. is just slowing from 3% to 1.5-2% growth).”
Aurelie Barthere
Uncertainty may last well into Q2
The tariff situation has been a significant driver of market volatility, with the U.S. policy uncertainty index reaching new highs. Trade discussions have become a key source of investor anxiety, but Nansen believes that uncertainty could peak soon.
As Treasury Secretary Bessent recently noted, many of the U.S. trading partners are already negotiating to lower their own trade barriers, which has helped to calm some fears. Even Trump recently hinted at potential tariff “exemptions” in certain circumstances. But as Barthere pointed out, while these talks may result in long-term growth benefits for the U.S., the lingering uncertainty may last well into Q2.
“Right now, I think that we are experiencing corrections within a crypto bull market. Why I see this as a bull market still: 1) Ongoing progress on crypto regulation and crypto institutionalization in the U.S., and 2) U.S. real growth has slowed but is not flashing ‘recession.’ Of course, this is my only main scenario, and I will continue to watch data and markets for signs that this is the correct reading.”
Aurelie Barthere
As Barthere put it, there’s a “50/50 chance that we’ve passed the peak of trade policy uncertainty,” adding that the true impact of these tariff negotiations might not be fully clear until mid-year. “We still see this peak uncertainty as more likely between April and June, especially with the start of U.S. tax cut package discussions,” she wrote in the research report.
The uncertainty, according to Nansen’s research, could trigger another short-term correction in both Bitcoin and U.S. equities.
No evidence of recession
Still, there’s reason for optimism. The report mentions that technicals are showing encouraging signs. “The dip is being bought, for BTC and for U.S. equities,” Barthere says, adding that spot Bitcoin ETFs recorded a “seven-day streak of net inflows, a first since crypto prices peaked.”
One way or the other, it’s clear that the market remains cautious. A lot of people are questioning whether the crypto bull run is still going strong or if we’re getting close to a peak. If history is any indication, times of economic uncertainty have often lined up with market downturns, making investors even more cautious.

After market sentiment hit extreme fear last week, with some investment banks raising the U.S. recession probability to 40% this year, hard economic data has eased these concerns. The latest U.S. March flash PMI report shows a 53.5 score, the highest in three months, suggesting a 1.9% annual growth rate. However, the growth for the whole quarter is lower at 1.5% due to weaker data in January and February.
Barthere emphasized that so far, there’s no hard evidence of a recession as “most of the data weakness has been in sentiment indicators, while hard economic data has held up.” She added that “there is no evidence of recession at this stage, so no evidence that we have transitioned to a bear market.”
While the coming months may bring more ups and downs, Nansen’s report suggests that the overall bull market is still in play. As Barthere puts it, the market is “likely to see a correction, but then we’ll bottom out for the rest of the year and head towards new highs.”
Source link
This week, GameStop quietly updated its investment policy to include Bitcoin as a treasury reserve asset. With approximately $4.78 billion in cash—nearly 37% of its $12.9 billion market cap—this move marks more than just a diversification of reserves.
JUST IN: @GameStop updates its investment policy to add #Bitcoin as a treasury reserve asset.
The company holds ~40% of its $11B market cap in cash reserves—that’s $4.62 BILLION of capital looking for a new home. pic.twitter.com/o62rrdwpKo
— Bitcoin For Corporations (@BitcoinForCorps) March 25, 2025
It’s a signal that corporate treasury strategy is evolving. That excess cash on the balance sheet can—and perhaps should—be more than idle. And that new asset classes are gaining legitimacy in the boardroom, not just on message boards. GameStop’s move may not be typical. But it is highly strategic—and increasingly relevant for CFOs evaluating how to preserve capital and unlock value in a shifting macro landscape. For companies with material cash holdings, the erosion of purchasing power is no longer theoretical—it’s measurable. Over the past decade, the U.S. dollar has declined in real terms by more than 25%, driven by inflation, expansionary monetary policy, and global fiscal uncertainty. Bitcoin presents a compelling counterweight to this degradation, particularly for balance sheets with the flexibility to tolerate mark-to-market volatility in pursuit of long-term strategic payoff. Consider its defining characteristics: For CFOs thinking in 3-, 5-, or 10-year increments, the case for allocating even a small portion of excess cash to Bitcoin is no longer fringe—it’s prudent exploration. Until recently, many finance teams ruled out Bitcoin simply due to unfavorable accounting treatment. Under legacy GAAP standards, Bitcoin had to be impaired when its price dropped, but could not be revalued when it recovered—an asymmetric model that distorted true economic value and discouraged adoption. In late 2024, that barrier was removed. The Financial Accounting Standards Board (FASB) approved new rules that now allow companies to measure Bitcoin at fair market value. Beginning in 2025, companies can: This change addresses one of the most common objections from CFOs and audit committees alike. It brings Bitcoin into compliance with modern reporting standards—making it viable not just for speculation, but for responsible treasury management. Every company has a unique capital structure, investor base, and operational profile. GameStop’s decision to allocate to Bitcoin wasn’t just bold—it was structurally appropriate. This doesn’t mean Bitcoin is a fit for every public company. But for those with excess reserves and a forward-looking treasury mindset, it deserves serious consideration. GameStop’s move is part of a broader rethinking of the traditional treasury reserve model. For decades, companies stored value in cash, short-term bonds, and dollar-denominated equivalents. But in today’s environment, those instruments may preserve nominal value while degrading purchasing power. Bitcoin introduces an alternative—and the macro backdrop is increasingly supportive. These tailwinds create space for CFOs to begin allocating conservatively—without needing to commit to a radical overhaul of reserve strategy. GameStop’s move didn’t come with a flashy press conference or social media fanfare. It came through a formal policy update—exactly how strategic treasury decisions are typically made. The signal it sends is simple but important: “We believe excess capital should be protected—and positioned for asymmetric upside.” Bitcoin is not a cure-all. But it is now, for the first time, auditable, liquid, and institutionally viable. For CFOs with flexibility and foresight, exploring Bitcoin is no longer about being first—it’s about preparing for what’s next. Disclaimer: This content was written on behalf of Bitcoin For Corporations. This article is intended solely for informational purposes and should not be interpreted as an invitation or solicitation to acquire, purchase, or subscribe for securities. Arthur Hayes, Murad’s Prediction For Meme Coins, AI & DeFi Coins For 2025 Expert Sees Bitcoin Dipping To $50K While Bullish Signs Persist Aptos Leverages Chainlink To Enhance Scalability and Data Access Bitcoin Could Rally to $80,000 on the Eve of US Elections Sonic Now ‘Golden Standard’ of Layer-2s After Scaling Transactions to 16,000+ per Second, Says Andre Cronje Institutional Investors Go All In on Crypto as 57% Plan to Boost Allocations as Bull Run Heats Up, Sygnum Survey Reveals Crypto’s Big Trump Gamble Is Risky Ripple-SEC Case Ends, But These 3 Rivals Could Jump 500xWhy Bitcoin—and Why Now?
Accounting Clarity Unlocks Strategic Action
Why GameStop Was a Natural Fit
The Bigger Picture: What It Means for Other Companies
A Quiet Signal to the Market
Source link 
Sei Foundation Explores Buying 23andMe to Put Genetic Data on Blockchain

Coinbase CLO Applauds US SEC Chair Nominee Paul Atkins Ahead of Senate Confirmation

Crypto Pundit Makes Case For Bitcoin Price At $260,000, But This Invalidation Level Threatens The Rally

$16.5B in Bitcoin options expire on Friday — Will BTC price soar above $90K?

$5,000,000,000,000 Asset Manager Fidelity To Launch a USD-Pegged Stablecoin: Report

Proposed Bipartisan Legislation Recognizes Bitcoin As A Technology That Supports Democracy

Wyoming Stablecoin Is Just a State-Issued CBDC by Another Name: Rep. Tom Emmer

Bitcoin faces 70% odds of another drop as April tariff fears shake markets, Nansen says

Political Endorsements Are Driving Rug Pulls

‘Trust the Cycle’ – Pro Says Dogecoin Price Could Suddenly Hit $1

Top Conglomerate Adds 580 $BTC Amid Unprecedented Crypto Popularity. Here’s Why BTC Bull Token Could 100x

Over 400 South Korean officials disclose $9.8M in crypto holdings

Copper Partners with Everstake to Deliver Secure Staking Services for Institutional Investors
![]()
GameStop’s Bitcoin Move Looks Bold—But It Might Be Brilliant

Elizabeth Warren Calls Stablecoin Bill a Trump and Musk ‘Grift’

Arthur Hayes, Murad’s Prediction For Meme Coins, AI & DeFi Coins For 2025

Expert Sees Bitcoin Dipping To $50K While Bullish Signs Persist

Aptos Leverages Chainlink To Enhance Scalability and Data Access

Bitcoin Could Rally to $80,000 on the Eve of US Elections

Sonic Now ‘Golden Standard’ of Layer-2s After Scaling Transactions to 16,000+ per Second, Says Andre Cronje

Institutional Investors Go All In on Crypto as 57% Plan to Boost Allocations as Bull Run Heats Up, Sygnum Survey Reveals

Crypto’s Big Trump Gamble Is Risky

Ripple-SEC Case Ends, But These 3 Rivals Could Jump 500x

Has The Bitcoin Price Already Peaked?

A16z-backed Espresso announces mainnet launch of core product

Xmas Altcoin Rally Insights by BNM Agent I

Blockchain groups challenge new broker reporting rule

Trump’s Coin Is About As Revolutionary As OneCoin

The Future of Bitcoin: Scaling, Institutional Adoption, and Strategic Reserves with Rich Rines

Is $200,000 a Realistic Bitcoin Price Target for This Cycle?


