
Bitcoin price
Key Levels to Watch as BTC Crashes Below $100K Today
Bitcoin (BTC) price traded as low as $91,231 on Binance on Monday Morning, as crypto markets buckle under pressure from escalating trade tariff war involving the United States.
Bitcoin (BTC) Plummets to $91K as Crypto Market Liquidations Hit $1.8 Billion
Bitcoin (BTC) plunged below the $91,200 mark on February 3, its lowest level in 20 days. This decline follows mounting economic concerns sparked by former U.S. President Donald Trump’s aggressive trade tariffs on China, Mexico, and Canada, which have triggered widespread financial market turbulence.
As fears of rising consumer prices escalate, social media reports suggest that American consumers are preparing for inflation by stockpiling essential goods. This has led to a shift in retail investor sentiment, with many liquidating riskier assets such as stocks and cryptocurrencies in favor of more stable stores of value.

As depicted above, Crypto market liquidations have exceeded $1.8 billion as BTC price plunged 7% in the last 24 hours, signaling unusually heavy capitulation from large investors.
This suggests that Bitcoin institutional investors are also responding to inflation risks, anticipating that the U.S. Federal Reserve may be forced to raise interest rates sooner than expected.
This has led many to shift capital toward government bonds before interest rate hikes push prices higher. Combined, these factors have exacerbated selling pressure in the crypto market, driving Bitcoin’s price down by 11% over the past three days.
Key Bitcoin (BTC) Price Levels to Watch
Amid the ongoing crypto market downturn, some crucial BTC trading signals indicate key levels that could be pivotal to Bitcoin price action as the week progresses.
Coinglass Liquidation Map Shows BTC’s Strongest Support Level Lies at $90,360
Bitcoin started the week under pressure due to the bearish sentiment surrounding the escalating trade war. Many U.S.-based traders likely set sell orders over the weekend, anticipating further downward movement as markets opened on Monday. This could result in heightened volatility in the early trading hours.
Coinglass’ liquidation map provides insight into the critical price levels where traders have placed leveraged positions. The chart displays Bitcoin’s aggregated leverage positions over the last 30 days, revealing key areas where liquidation events are likely.

The data suggests that bearish sentiment dominates, with $11.9 billion in short positions far exceeding the $3.04 billion in long positions. This confirms expectations of further downside risk.
However, bullish traders have concentrated $2.12 billion in leverage at the $90,358 level, accounting for 70% of total long leverage positions. This indicates strong potential support around $90,500, as traders seek to defend their positions from liquidation losses.
Other key support zones include $93,000 and $94,330, where long positions total $1 billion and $330 million, respectively. If Bitcoin’s price approaches these levels, we could see increased buying activity aimed at stabilizing the market.
Nevertheless, a prolonged bearish trend could persist unless global economic conditions improve or influential market participants intervene to stabilize sentiment.
The Double-Bottom Pattern Signals a Potential Breakout Toward $108,000
While the prevailing market sentiment remains bearish due to macroeconomic pressures, certain technical indicators suggest the possibility of a Bitcoin price recovery. The double-bottom pattern observed in recent trading activity hints at a potential breakout target of $108,000, provided market sentiment shifts positively.
Savvy investors might capitalize on the current price dip, increasing their Bitcoin holdings around the $90,300, $93,000, and $94,300 support levels. Some Bitcoin maximalists believe that prolonged trade tensions could drive sovereign entities to seek BTC as an inflation hedge. Notably, the Czech Republic and Bhutan have recently explored Bitcoin acquisitions, and U.S. states and corporations may increasingly turn to blockchain solutions to circumvent trade barriers.
Bitcoin Price Forecast: Can BTC Rebound to $108K?
From a technical analysis standpoint, Bitcoin price forecast shows BTC trading near recent significant lows highlighted double-bottom pattern, which often precedes a bullish breakout.
In terms of key levels to watch, BTC must maintains support above $90,500 to keep alive rebound hopes of reclaiming the $96,150 territory. If the trade war sparks a BTC buying frenzy among nations and institutions, the ensuing BTC price recovery could gain enough momentum to test the $102,000-$105,000 range. A sustained rally above these levels could open the door to the $108,000 breakout target.

The Bollinger Bands indicator also highlights key resistance levels that Bitcoin must overcome to reclaim bullish momentum. The upper band suggests significant resistance at $105,800, followed by a more substantial barrier near $108,000. If Bitcoin can consolidate above these levels, it may establish a new bullish trend, counteracting the recent downturn.
In Summary:
While Bitcoin’s 11% decline in 3 consecutive losing days has rattled investors with $1.8 billion market liquidations. However, key technical indicators point to potential support around $90,500 and possible recovery scenarios. The ongoing trade war and economic uncertainty continue to influence market sentiment, but long-term investors and institutional players could take advantage of lower prices. Should positive sentiment return, Bitcoin could break out toward $108,000, reinforcing its status as a politically-neutral asset.
Frequently Asked Questions (FAQs)
Bitcoin’s decline is linked to global economic uncertainty, including the U.S.-Canada trade war, rising inflation concerns, and mass market liquidations.
The strongest BTC support level lies at $90,360, with additional support at $93,000 and $94,330, where leveraged long positions are heavily concentrated.
If Bitcoin holds the $90,500 support and market sentiment improves, the double-bottom pattern suggests a potential breakout toward $108,000.
ibrahim
Disclaimer: The presented content may include the personal opinion of the author and is subject to market condition. Do your market research before investing in cryptocurrencies. The author or the publication does not hold any responsibility for your personal financial loss.
Source link


Reason to trust
![]()
Strict editorial policy that focuses on accuracy, relevance, and impartiality
Created by industry experts and meticulously reviewed
The highest standards in reporting and publishing
Strict editorial policy that focuses on accuracy, relevance, and impartiality
Morbi pretium leo et nisl aliquam mollis. Quisque arcu lorem, ultricies quis pellentesque nec, ullamcorper eu odio.
Bitcoin’s long-term holders have resumed accumulation in what is a notable shift in investor sentiment despite the turbulence that has gripped the market in recent weeks. Particularly, data from on-chain analytics platform Glassnode shows that the “BTC: Long-term holder net position change” metric has flipped positive for the first time this year. This suggests that long-term Bitcoin investors are capitalizing on market conditions to add significant amounts of BTC to their holdings.
Long-Term Holders Add 167,000 BTC Amid March Crash
Earlier this month, Bitcoin’s price plunged from above $90,000 to around $80,000 during a rapid sell-off. This price stunned many traders and triggered a continuous wave of liquidations among short-term investors. Yet despite this steep correction, long-term holders treated the sub-$90,000 levels as a buying opportunity rather than a reason to capitulate.
Related Reading
In other words, coins are moving into wallets that haven’t spent their BTC in a long time, which is a notable reversal after starting 2025 with a negative net position change. This marks the first net accumulation by these “HODLers” in 2025. Glassnode’s Long-Term Holder Net Position Change metric, which had been in the red, flipped “green” as long-term investors aggressively accumulated through the downturn.
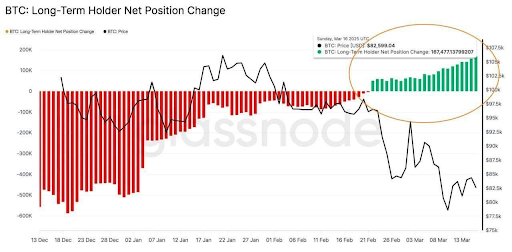
On-chain data shows that this flip to green has seen long-term holders increase their net Bitcoin holdings by more than 167,000 BTC in the past month. This notable influx is valued at nearly $14 billion. In short, the cohort of seasoned holders began scooping up cheap BTC while short-term sentiment was at its bleakest.
Is A Bitcoin Price Recovery Brewing?
The timing of this flip from red selloff to green accumulation among long-term holders is striking, considering what the Bitcoin price went through in the past two weeks. This data suggests that a large part of the Bitcoin crash was caused by panic-selling among short-term holders. This behavior aligns with past market cycles between August and September 2024, where long-term holders accumulated aggressively during a price dip.
Related Reading
Interestingly, Glassnode’s long-term holder metric isn’t the only one pointing to positive Bitcoin sentiment among large holders. After weeks of uncertainty, Bitcoin exchange-traded funds (ETFs) have started seeing net inflows again. On March 17, spot Bitcoin ETFs collectively drew in about $274.6 million, the largest single-day inflow in 28 days and a clear signal of renewed investor interest.
The very next day brought another wave of fresh capital, with roughly $209 million pouring into Bitcoin funds on March 18. In fact, this three-day streak represents the first sustained run of positive inflows since February 18, a period during which Bitcoin funds have experienced consecutive days of outflows.
At the time of writing, Bitcoin is trading at $83,500.
Featured image from Unsplash, chart from Tradingview.com
Source link
Reason to trust
![]()
Strict editorial policy that focuses on accuracy, relevance, and impartiality
Created by industry experts and meticulously reviewed
The highest standards in reporting and publishing
Strict editorial policy that focuses on accuracy, relevance, and impartiality
Morbi pretium leo et nisl aliquam mollis. Quisque arcu lorem, ultricies quis pellentesque nec, ullamcorper eu odio.
CryptoQuant CEO Ki Young Ju announced today that Bitcoin’s bull cycle “is over” and warned investors to brace for “6–12 months of bearish or sideways price action.” This development comes after the on-chain analytics veteran had previously urged caution but maintained a measured outlook on the market as recently as two weeks ago.
Is The Bitcoin Bull Run Over?
In a post shared today via X, Ki stated:“Bitcoin bull cycle is over, expecting 6–12 months of bearish or sideways price action.”
Related Reading
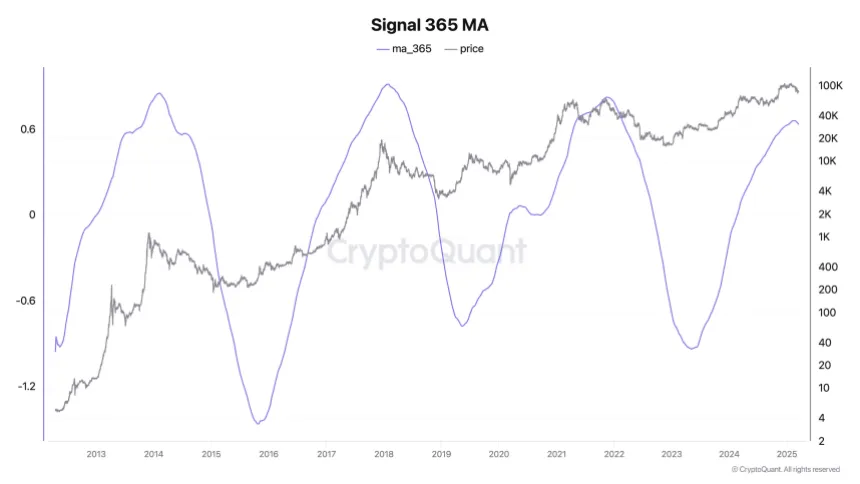
Along with the comment, the CEO highlighted the Bitcoin PnL Index Cyclical Signals—an index that aggregates multiple on-chain metrics, such as MVRV, SOPR, and NUPL, to pinpoint market tops, bottoms, and cyclical turning points in Bitcoin’s price. According to Ki, this indicator has historically offered reliable buy and sell signals.
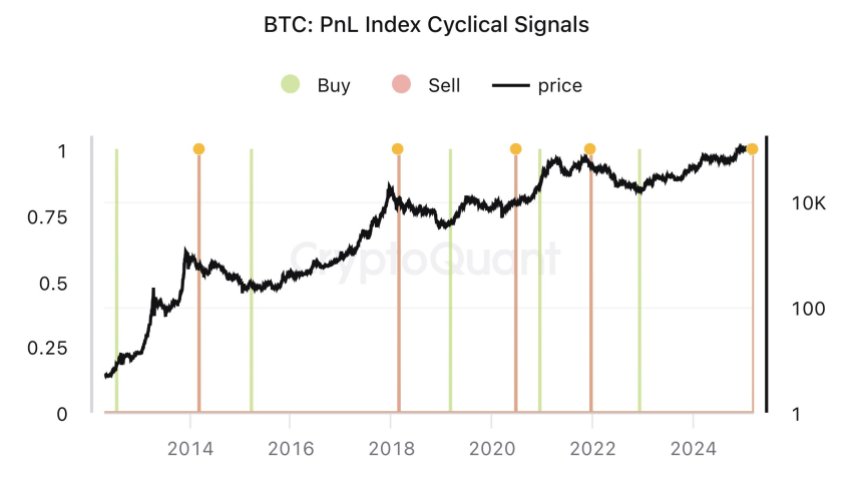
He further explained how an automated alert, previously sent to his subscribers, combined these metrics into a 365-day moving average. Once the trend in this 1-year moving average changes, it often signals a significant market inflection point. As proof, Ki also shared a chart: “This alert applies PCA to on-chain indicators like MVRV, SOPR, and NUPL to compute a 365-day moving average. This signal identifies inflection points where the trend of the 1-year moving average changes.”
Ki pointed to drying liquidity and fresh selling pressure by “new whales” who, he said, are unloading Bitcoin at lower prices. Notably, he revealed that CryptoQuant users who subscribed to his alerts received this signal before today’s public announcement. “With fresh liquidity drying up, new whales are selling Bitcoin at lower prices. Cryptoquant users who subscribed to my alerts received this signal a few days ago. I assume they’ve already adjusted their positions, so I’m posting this now.”
Related Reading
This latest declaration contrasts remarks from just four days ago, on March 14, when Ki struck a more cautious tone, stating: “Bitcoin demand seems stuck, but it’s too early to call it a bear market.”
At that time, he shared a chart of the Bitcoin Apparent Demand (30-day sum) indicator, which had turned slightly negative—an early signal that demand might be tapering off. Although Ki pointed out that demand could still rebound (as it has in past sideways phases), he acknowledged the possibility of Bitcoin teetering on the edge of a bear market.
The pivot in sentiment is especially notable given Ki’s stance from two weeks ago. In that earlier post, he opined that the “bull cycle is still intact,” crediting strong fundamentals and growing mining capacity: “There’s no significant on-chain activity, and key indicators are neutral, suggesting the bull cycle is still intact. Fundamentals remain strong, with more mining rigs coming online.”
However, he also cautioned that the market could turn if sentiment did not improve, particularly in the United States. With today’s announcement, the warning has evidently crystallized. Reflecting on the potential downside scenario, Ki said at the time: “If the cycle ends here, it’s an outcome no one wanted—not old whales, mining companies, TradFi, or even Trump. (FYI, the market doesn’t care about retail.)”
At press time, BTC traded at $83,059.
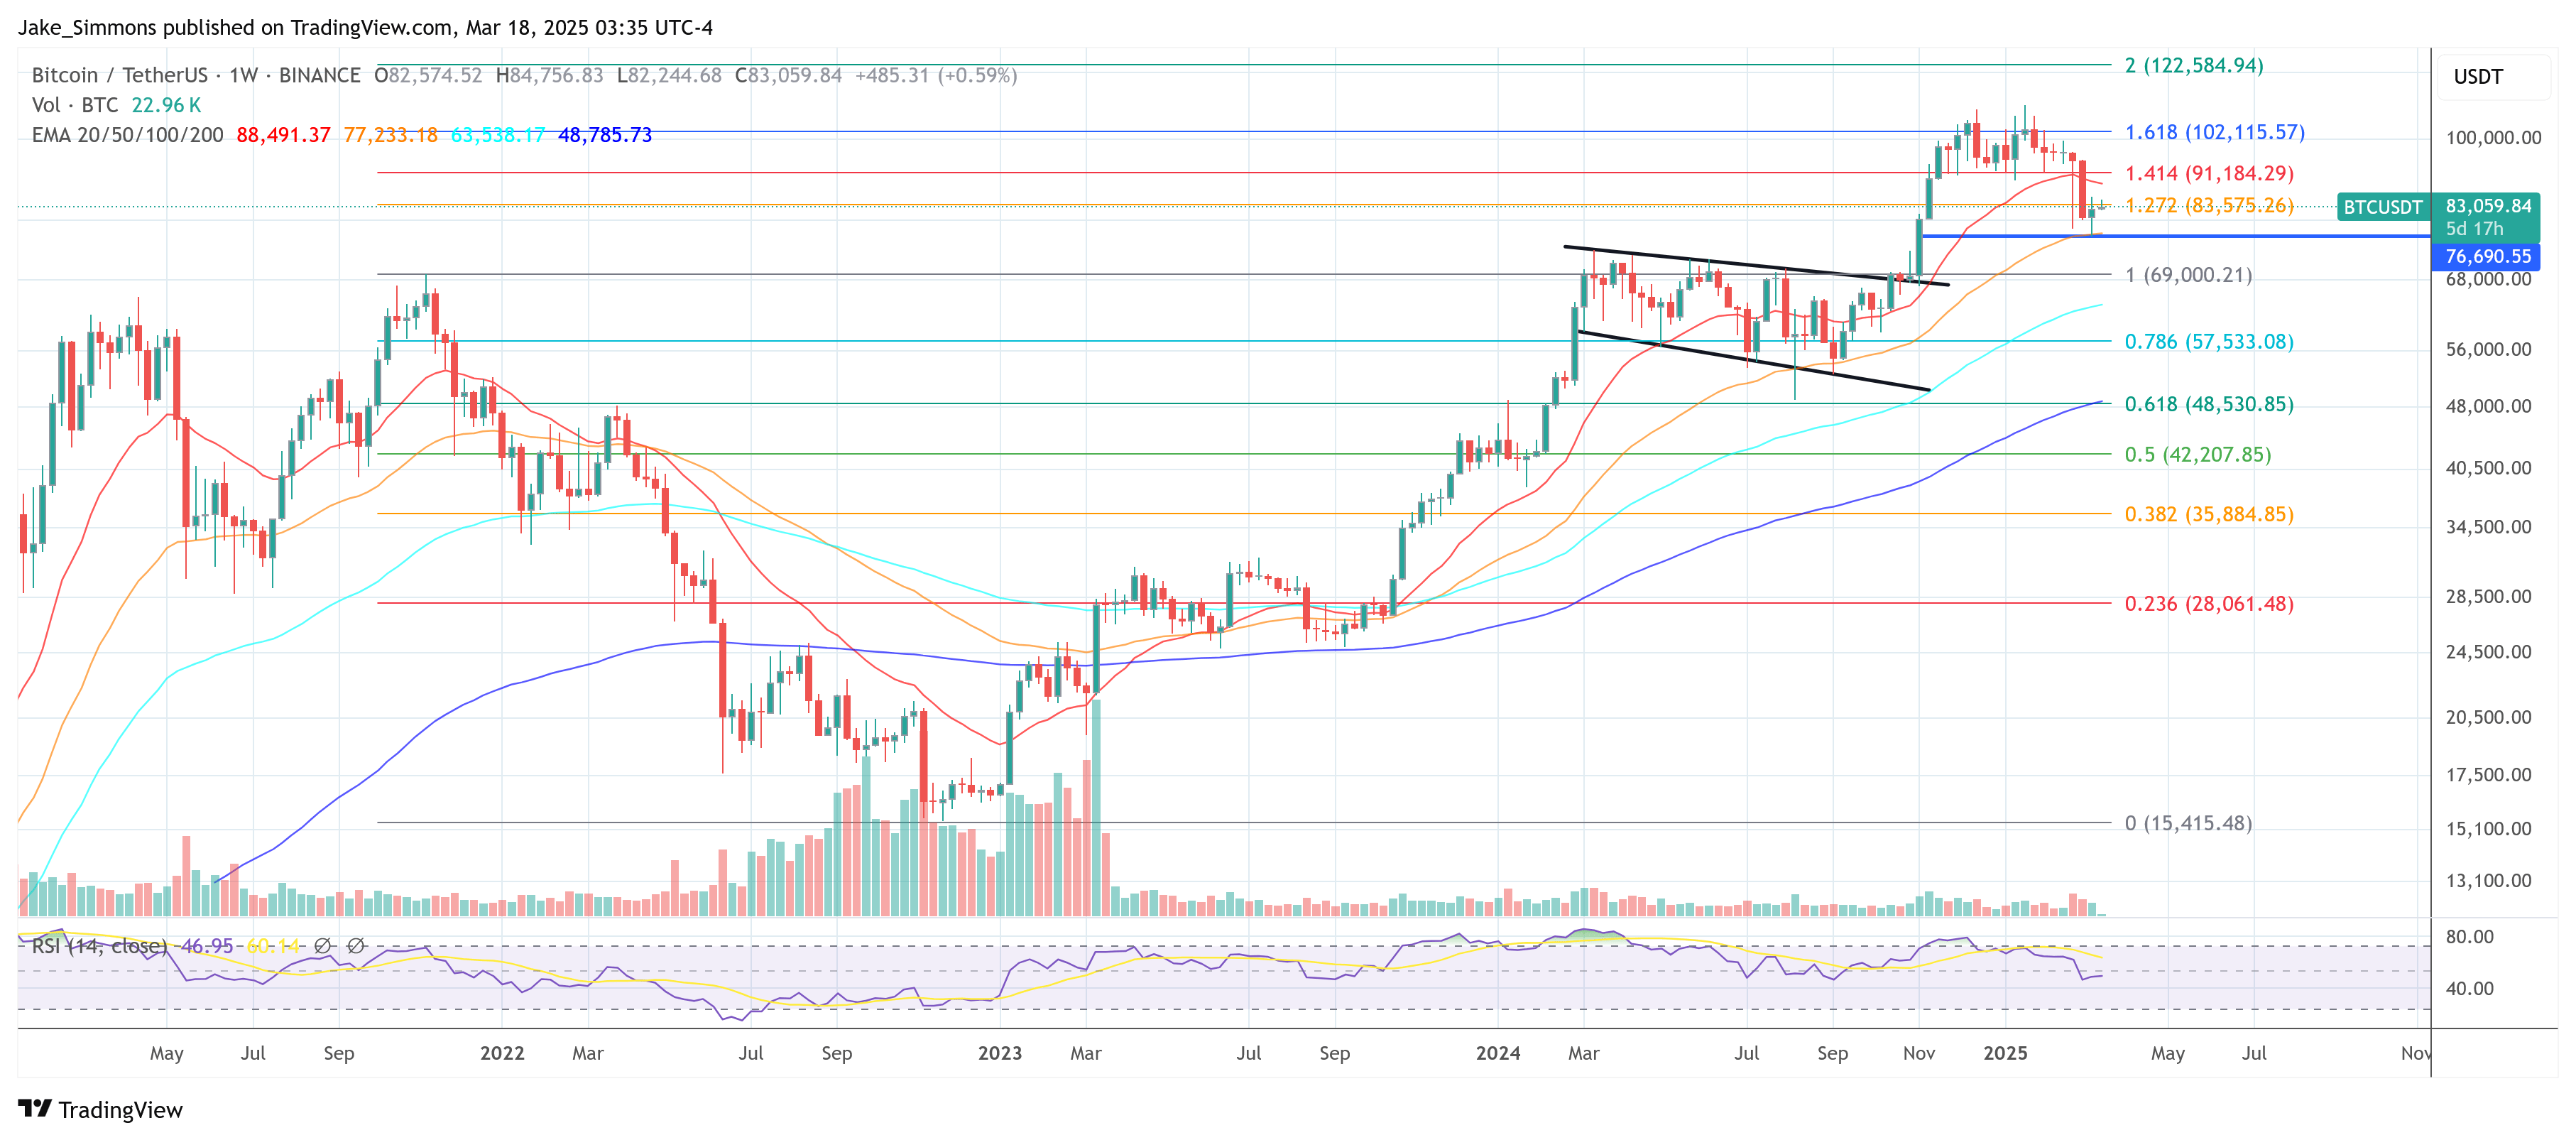
Featured image created with DALL.E, chart from TradingView.com
Source link
Reason to trust
![]()
Strict editorial policy that focuses on accuracy, relevance, and impartiality
Created by industry experts and meticulously reviewed
The highest standards in reporting and publishing
Strict editorial policy that focuses on accuracy, relevance, and impartiality
Morbi pretium leo et nisl aliquam mollis. Quisque arcu lorem, ultricies quis pellentesque nec, ullamcorper eu odio.
In a new publication titled The Mustard Seed, Joe Burnett—Director of Market Research at Unchained—outlines a thesis that envisions Bitcoin reaching $10 million per coin by 2035. This inaugural quarterly letter takes the long view, focusing on “time arbitrage” as it surveys where Bitcoin, technology, and human civilization could stand a decade from now.
Burnett’s argument revolves around two principal transformations that, he contends, are setting the stage for an unprecedented migration of global capital into Bitcoin: (1) the “Great Flow of Capital” into an asset with absolute scarcity, and (2) the “Acceleration of Deflationary Technology” as AI and robotics reshape entire industries.
A Long-Term Perspective On Bitcoin
Most economic commentary zooms in on the next earnings report or the immediate price volatility. In contrast, The Mustard Seed announces its mission clearly: “Unlike most financial commentary that fixates on the next quarter or next year, this letter takes the long view—identifying profound shifts before they become consensus.”
At the core of Burnett’s outlook is the observation that the global financial system—comprising roughly $900 trillion in total assets—faces ongoing risks of “dilution or devaluation.” Bonds, currencies, equities, gold, and real estate each have expansionary or inflationary components that erode their store-of-value function:
- Gold ($20 trillion): Mined at approximately 2% annually, increasing supply and slowly diluting its scarcity.
- Real Estate ($300 trillion): Expands at around 2.4% per year due to new development.
- Equities ($110 trillion): Company profits are constantly eroded by competition and market saturation, contributing to devaluation risk.
- Fixed Income & Fiat ($230 trillion): Structurally subject to inflation, which reduces purchasing power over time.
Burnett describes this phenomenon as capital “searching for a lower potential energy state,” likening the process to water cascading down a waterfall. In his view, all pre-Bitcoin asset classes were effectively “open bounties” for dilution or devaluation. Wealth managers could distribute capital among real estate, bonds, gold, or stocks, but each category carried a mechanism by which its real value could erode.
Related Reading
Enter Bitcoin, with its 21-million-coin hard cap. Burnett sees this digital asset as the first monetary instrument incapable of being diluted or devalued from within. Supply is fixed; demand, if it grows, can directly translate into price appreciation. He cites Michael Saylor’s “waterfall analogy”: “Capital naturally seeks the lowest potential energy state—just as water flows downhill. Before bitcoin, wealth had no true escape from dilution or devaluation. Wealth stored in every asset class acted as a market bounty, incentivizing dilution or devaluation.”
As soon as Bitcoin became widely recognized, says Burnett, the game changed for capital allocation. Much like discovering an untapped reservoir far below existing water basins, the global wealth supply found a new outlet—one that cannot be augmented or diluted.
To illustrate Bitcoin’s unique supply dynamics, The Mustard Seed draws a parallel with the halving cycle. In 2009, miners received 50 BTC per block—akin to Niagara Falls at full force. As of today, the reward dropped to 3.125 BTC, reminiscent of halving the Falls’ flow repeatedly until it is significantly reduced. In 2065, Bitcoin’s newly minted supply will be negligible compared to its total volume, mirroring a waterfall reduced to a trickle.
Though Burnett concedes that attempts to quantify Bitcoin’s global adoption rely on uncertain assumptions, he references two models: the Power Law Model which projects $1.8 million per BTC by 2035 and Michael Saylor’s Bitcoin model which suggests $2.1 million per BTC by 2035.
He counters that these projections might be “too conservative” because they often assume diminishing returns. In a world of accelerating technological adoption—and a growing realization of Bitcoin’s properties—price targets could overshoot these models significantly.
The Acceleration Of Deflationary Technology
A second major catalyst for Bitcoin’s upside potential, per The Mustard Seed, is the deflationary wave brought on by AI, automation, and robotics. These innovations rapidly increase productivity, lower costs, and make goods and services more abundant. By 2035, Burnett believes global costs in several key sectors could undergo dramatic reductions.
Adidas’ “Speedfactories” cut sneaker production from months to days. The scaling of 3D printing and AI-driven assembly lines could slash manufacturing costs by 10x. 3D-printed homes already go up 50x faster at far lower costs. Advanced supply-chain automation, combined with AI logistics, could make quality housing 10x cheaper. Autonomous ride-hailing can potentially reduce fares by 90% by removing labor costs and improving efficiency.
Burnett underscores that, under a fiat system, natural deflation is often “artificially suppressed.” Monetary policies—like persistent inflation and stimulus—inflate prices, masking technology’s real impact on lowering costs.
Bitcoin, on the other hand, would let deflation “run its course,” increasing purchasing power for holders as goods become more affordable. In his words: “A person holding 0.1 BTC today (~$10,000) could see its purchasing power increase 100x or more by 2035 as goods and services become exponentially cheaper.”
To illustrate how supply growth erodes a store of value over time, Burnett revisits gold’s performance since 1970. Gold’s nominal price from $36 per ounce to roughly $2,900 per ounce in 2025 appears substantial, but that price gain was continuously diluted by the annual 2% increase in gold’s overall supply. Over five decades, the global stock of gold almost tripled.
If gold’s supply had been static, its price would have hit $8,618 per ounce by 2025, according to Burnett’s calculations. This supply constraint would have bolstered gold’s scarcity, possibly pushing demand and price even higher than $8,618.
Related Reading
Bitcoin, by contrast, incorporates precisely the fixed supply condition that gold never had. Any new demand will not spur additional coin issuance and thus should drive the price upward more directly.
Burnett’s forecast for a $10 million Bitcoin by 2035 would imply a total market cap of $200 trillion. While that figure sounds colossal, he points out that it represents only about 11% of global wealth—assuming global wealth continues to expand at a ~7% annual rate. From this vantage point, allocating around 11% of the world’s assets into what The Mustard Seed calls “the best long-term store of value asset” might not be far-fetched. “Every past store of value has perpetually expanded in supply to meet demand. Bitcoin is the first that cannot.”
A key piece of the puzzle is the security budget for Bitcoin: miner revenue. By 2035, Bitcoin’s block subsidy will be down to 0.78125 BTC per block. At $10 million per coin, miners could earn $411 billion in aggregate revenue each year. Since miners sell the Bitcoin they earn to cover costs, the market would have to absorb $411 billion of newly mined BTC annually.
Burnett draws a parallel with the global wine market, which was valued at $385 billion in 2023 and is projected to reach $528 billion by 2030. If a “mundane” sector like wine can sustain that level of consumer demand, an industry securing the world’s leading digital store of value reaching similar scale, he argues, is well within reason.
Despite public perception that Bitcoin is becoming mainstream, Burnett highlights an underreported metric: “The number of people worldwide with $100,000 or more in bitcoin is only 400,000… that’s 0.005% of the global population—just 5 in 100,000 people.”
Meanwhile, studies might show around 39% of Americans have some level of “direct or indirect” Bitcoin exposure, but this figure includes any fractional ownership—such as holding shares of Bitcoin-related equities or ETFs through mutual funds and pension plans. Real, substantial adoption remains niche. “If Bitcoin is the best long-term savings technology, we would expect anyone with substantial savings to hold a substantial amount of bitcoin. Yet today, virtually no one does.”
Burnett emphasizes that the road to $10 million does not require Bitcoin to supplant all money worldwide—only to “absorb a meaningful percentage of global wealth.” The strategy for forward-looking investors, he contends, is simple but non-trivial: ignore short-term noise, focus on the multi-year horizon, and act before global awareness of Bitcoin’s properties becomes universal. “Those who can see past the short-term volatility and focus on the bigger picture will recognize bitcoin as the most asymmetric and overlooked bet in global markets.”
In other words, it is about “front-running the capital migration” while Bitcoin’s user base is still comparatively minuscule and the vast majority of traditional wealth remains in legacy assets.
At press time, BTC traded at $83,388.
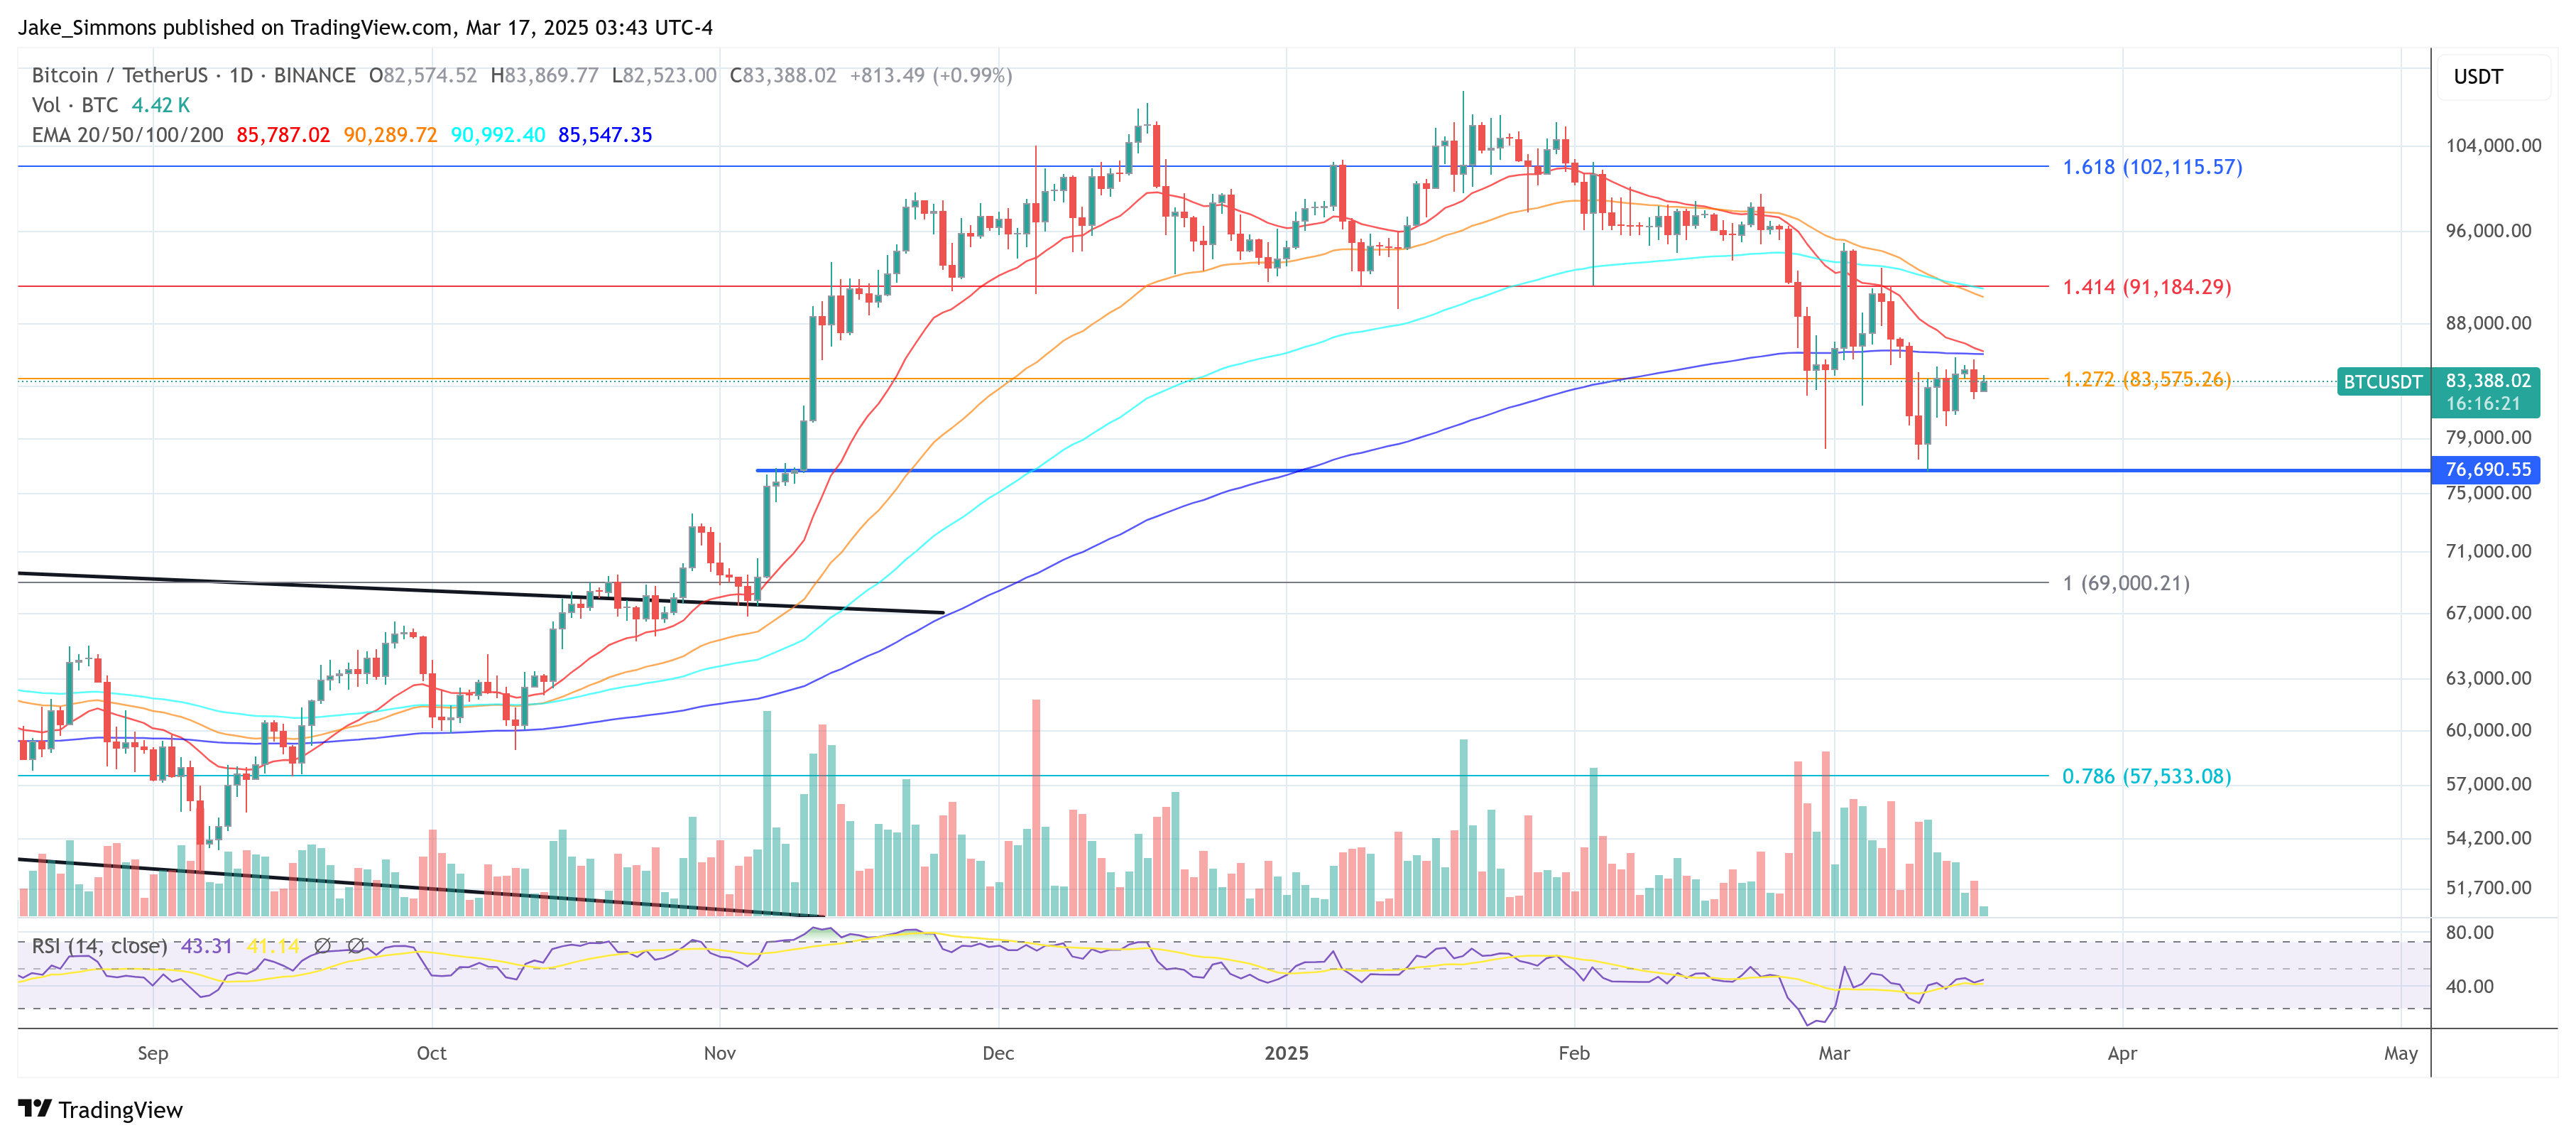
Featured image created with DALL.E, chart from TradingView.com
Source link
Here’s Where Support & Resistance Lies For Solana, Based On On-Chain Data

President Trump To Address The Digital Assets Summit Tomorrow

Analyst Says Bitcoin Primed for ‘Party Time’ if BTC Breaks Above Critical Level, Updates Outlook on Chainlink

Binance adds a new EUR market tier to its fiat liquidity provider program

Authorities Target Crypto Scammers Posing as Binance in Australia

Why Is Solana Price Up 6% Today?

Ripple CEO Confident of XRP Being Included in U.S. Strategic Reserve, Says IPO is 'Possible'

Bitnomial drops SEC lawsuit ahead of XRP futures launch in the US
Bitcoin Long-Term Holder Net Position Turns Green For The First Time In 2025

BIGGER THAN ORDINALS. MORE THAN ART

Leading Shiba Inu Rival Flashing Bullish Signals Hinting at Price Reversal, According to Santiment

Binance’s USDT pair with Turkish lira sees largest amplitude since 2024 after key Erdogan rival detained

Treasury Expands Financial Surveillance of Cash Transactions—What About Crypto?

Bitcoin Price Eyes 90K rally at Blackrock-led ETFs Buy $512M BTC 3-Days before US Fed Decision

Bitcoin Reclaims $85k and Stocks Head Higher Despite Analysts Warning of Pain Ahead


 24/7 Cryptocurrency News4 months ago
Arthur Hayes, Murad’s Prediction For Meme Coins, AI & DeFi Coins For 2025

 Bitcoin2 months ago
Expert Sees Bitcoin Dipping To $50K While Bullish Signs Persist

 24/7 Cryptocurrency News2 months ago
Aptos Leverages Chainlink To Enhance Scalability and Data Access

 Bitcoin4 months ago
Bitcoin Could Rally to $80,000 on the Eve of US Elections

 Altcoins2 months ago
Sonic Now ‘Golden Standard’ of Layer-2s After Scaling Transactions to 16,000+ per Second, Says Andre Cronje

 Bitcoin4 months ago
Institutional Investors Go All In on Crypto as 57% Plan to Boost Allocations as Bull Run Heats Up, Sygnum Survey Reveals

 Opinion5 months ago
Crypto’s Big Trump Gamble Is Risky

 Price analysis4 months ago
Ripple-SEC Case Ends, But These 3 Rivals Could Jump 500x

✓ Share: