
chainlink
Chainlink Price Slumps 15%; Is Now the Right Time to Buy LINK?
Chainlink (LINK) price has declined over 15% in the past 24 hours, reflecting broader crypto market struggles. The downturn follows significant liquidations, pushing Bitcoin below $100k. Despite the drop, LINK remains above the $20 support level. Investors are assessing whether this presents a buying opportunity or signals further downside amid ongoing volatility in early 2025’s crypto landscape.
Chainlink Price Falls 15%; Is This a Buying Opportunity?
Chainlink price has fallen by 15%, sparking discussions about a potential buying opportunity. The cryptocurrency started 2025 with sluggish momentum, which has led to mixed price predictions. Despite the recent dip, analysts remain largely optimistic about LINK’s long-term prospects, pointing to potential bullish signals.
January ended positively for Chainlink, with the token climbing 15% after a weak start to the month. However, the past 24 hours have seen significant corrections across the crypto market. Many investors have faced liquidations as prices dropped sharply, contributing to uncertainty.
LINK Price Could Surge as Stablecoin Issuer Adopts Key Services
Chainlink price sees a boost as a major stablecoin issuer with $1.2 billion in assets integrates its infrastructure. Usually, the issuer of USD0 and USD0++ now utilizes Chainlink’s Price Feeds, Cross-Chain Interoperability Protocol (CCIP), and Proof of Reserve.
This move enhances security and transparency in Usual’s ecosystem. Co-founder Adli Takkal Bataille emphasized the integration’s role in driving stablecoin adoption and enabling safe cross-chain transactions. The partnership highlights Chainlink’s growing influence in tokenized real-world assets and institutional finance.
Chainlink Price Analysis
LINK price hovered at $20.93, showing a decrease in the past 24 hours, with the cryptocurrency attempting to recover from recent losses. Technical indicators suggest a mixed outlook for Chainlink in the short term.
The Relative Strength Index (RSI) is currently at 47, indicating that LINK is in a neutral zone. The Moving Average Convergence Divergence (MACD) shows a bearish trend, with the MACD line at -0.98 below the signal line at -1.23.
Key Levels To Watch
Key resistance levels are identified at $25 and $30. If the Chainlink price prediction breaks above the $25 resistance, it could target the $30 mark. Conversely, significant support lies at $15. A decline below this level could trigger further downside towards $12.

Chainlink price drop raises questions about its next move. While technical indicators signal caution, long-term adoption trends and key partnerships could support a recovery, making LINK a potential opportunity for investors.
Frequently Asked Questions (FAQs)
Analysts are divided, but long-term adoption trends remain positive.
Support at $15; resistance at $25 and $30 for potential upside.
Partnerships like stablecoin integrations boost confidence in LINK’s utility.
Coingape Staff
CoinGape comprises an experienced team of native content writers and editors working round the clock to cover news globally and present news as a fact rather than an opinion. CoinGape writers and reporters contributed to this article.
Disclaimer: The presented content may include the personal opinion of the author and is subject to market condition. Do your market research before investing in cryptocurrencies. The author or the publication does not hold any responsibility for your personal financial loss.
Source link


Altcoins
Analyst Says Bitcoin Primed for ‘Party Time’ if BTC Breaks Above Critical Level, Updates Outlook on Chainlink

Crypto strategist Michaël van de Poppe says Bitcoin (BTC) may take off on a series of rallies if it can break through a key resistance level in the coming days.
The analyst tells his 782,000 followers on the social media platform X that Bitcoin needs to flip $84,500 into support this week in order to regain bullish momentum.
However, he warns if Bitcoin fails to break through $84,500, the flagship crypto asset may collapse in price.
“I really want to see some momentum on Bitcoin. If it doesn’t happen this week and we’ll break sub $82,000, likely we’ll see some new lows. Break $84,500 equals party time.”
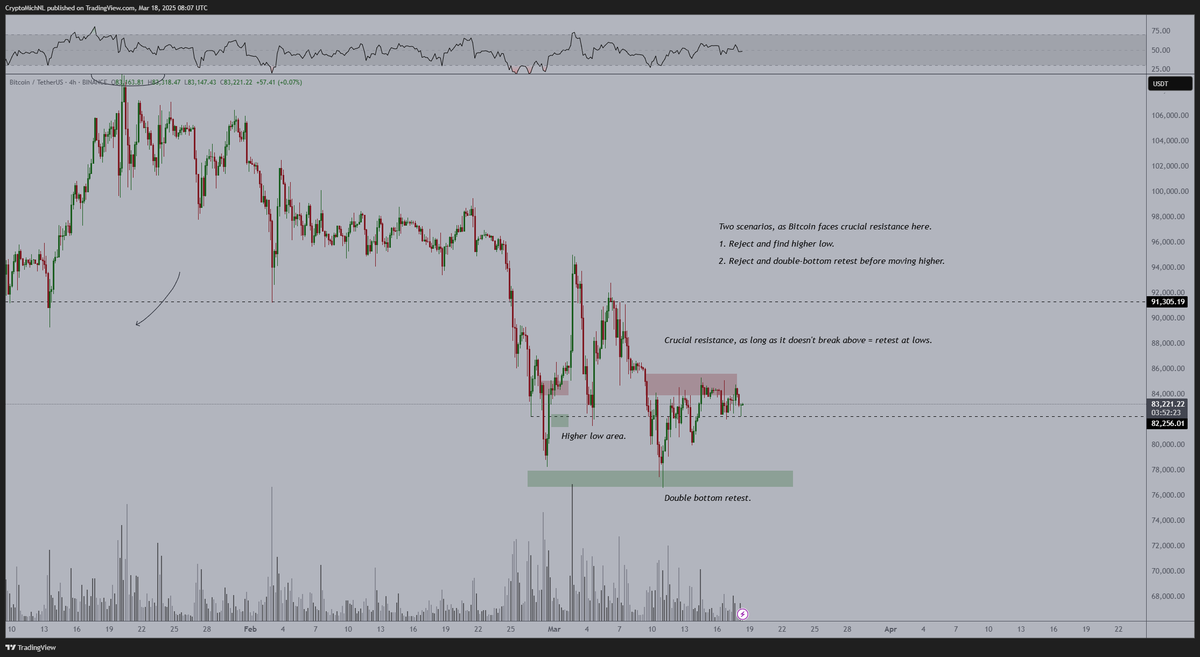
Looking at his chart, the analyst says if Bitcoin fails to reclaim $84,500 as support this week, there are two likely outcomes.
“Two scenarios, as Bitcoin faces crucial resistance here:
- Reject and find a higher low [around $82,000].
- Reject and double-bottom retest [in the $70,000 range] before moving higher.”
Bitcoin is trading for $87,315 at time of writing, up 5.7% in the last 24 hours.
Next up, the analyst says that the decentralized oracle network Chainlink may be printing a double-bottom pattern against Bitcoin (LINK/BTC) on the weekly chart.
A double-bottom pattern is typically considered a bullish reversal pattern as buyers step in to create a price floor for an asset.
“LINK doing a double bottom test and back to the range low. Weekly firing up nicely. Things are heating up the right way.”
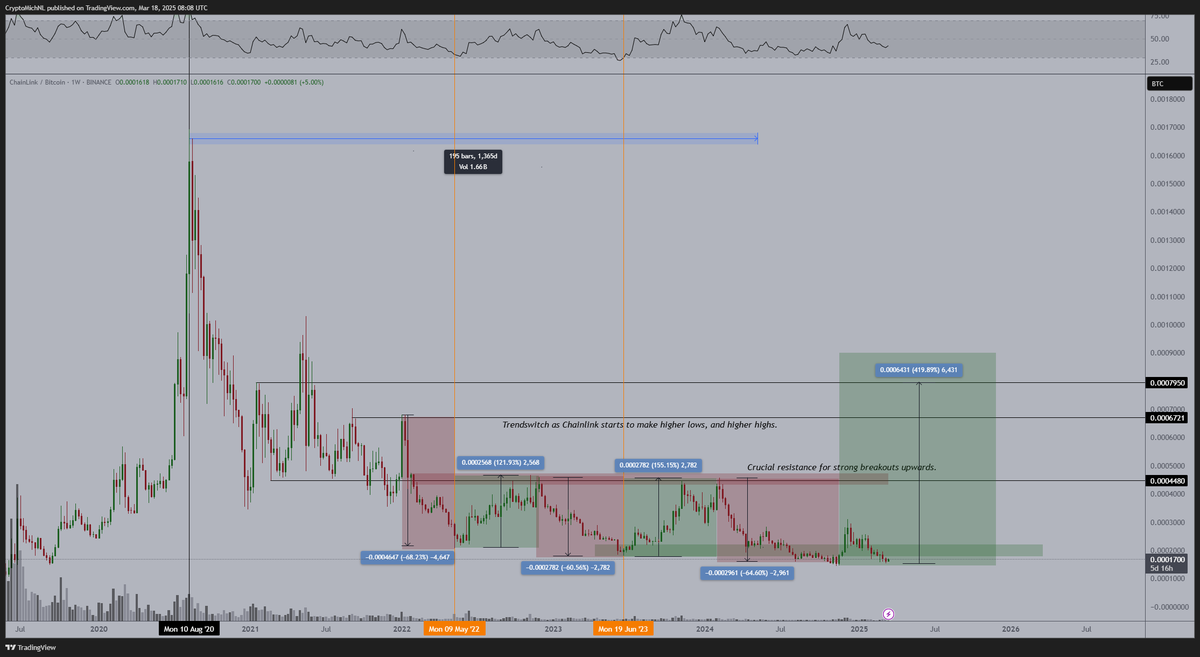
Based on the trader’s chart, he seems to predict that LINK/BTC will soar to as high as 0.000795 BTC worth $68.39.
LINK/BTC is trading for 0.0001719 BTC ($14.92) at time of writing, up nearly 2% in the last 24 hours.
Follow us on X, Facebook and Telegram
Don’t Miss a Beat – Subscribe to get email alerts delivered directly to your inbox
Check Price Action
Surf The Daily Hodl Mix
 

Disclaimer: Opinions expressed at The Daily Hodl are not investment advice. Investors should do their due diligence before making any high-risk investments in Bitcoin, cryptocurrency or digital assets. Please be advised that your transfers and trades are at your own risk, and any losses you may incur are your responsibility. The Daily Hodl does not recommend the buying or selling of any cryptocurrencies or digital assets, nor is The Daily Hodl an investment advisor. Please note that The Daily Hodl participates in affiliate marketing.
Generated Image: Midjourney
Source link
Reason to trust
![]()
Strict editorial policy that focuses on accuracy, relevance, and impartiality
Created by industry experts and meticulously reviewed
The highest standards in reporting and publishing
Strict editorial policy that focuses on accuracy, relevance, and impartiality
Morbi pretium leo et nisl aliquam mollis. Quisque arcu lorem, ultricies quis pellentesque nec, ullamcorper eu odio.
Chainlink (LINK) is currently trading below crucial resistance levels, which could trigger a strong rally if bulls manage to reclaim them. However, volatility and uncertainty have dominated the market since the start of the month, keeping LINK’s price action unstable.
Related Reading
The token has seen wild price swings, moving from $17 down to $13, briefly rebounding to $16, and then collapsing to a low of $11.8. Bulls are now fighting to push LINK back above the $15 mark, but momentum remains weak, and the market appears to be consolidating around current levels.
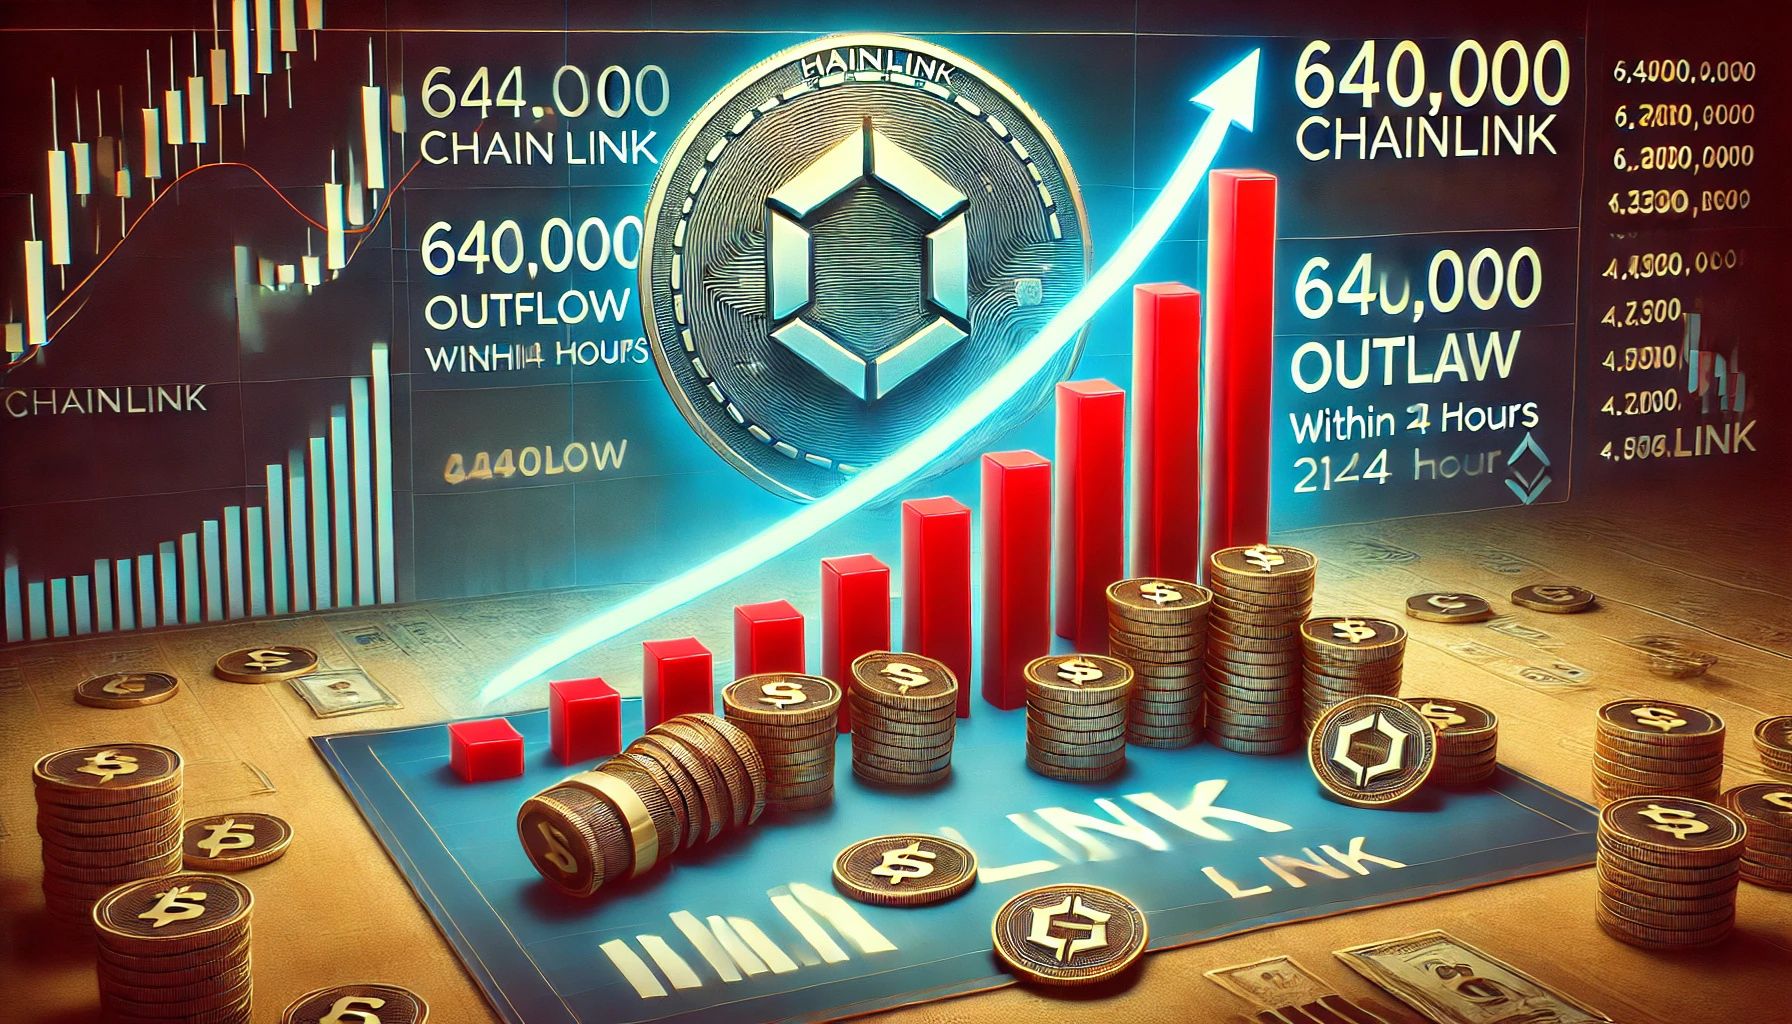
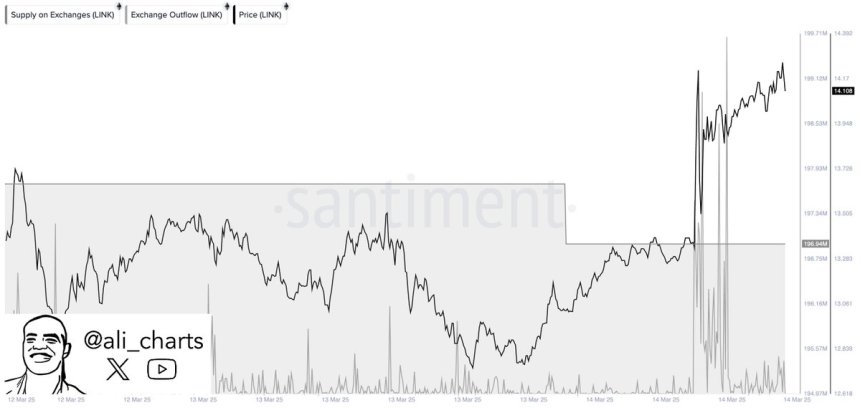
Despite this uncertainty, on-chain data is showing promising signs. Metrics from Santiment reveal that 640,000 LINK were pulled off exchanges in the last 24 hours, which is typically a bullish signal. Large withdrawals from exchanges often indicate long-term accumulation, as investors move their holdings into private wallets instead of keeping them available for immediate selling.
With exchange outflows rising, traders are watching closely to see if LINK can break through resistance levels and confirm a shift toward bullish momentum. The next few trading sessions will be key in determining whether LINK can recover or if further consolidation is ahead.
Uncertainty Looms As Investors Watch For A Breakout
Chainlink is currently holding above the $13.5 mark, struggling to reclaim higher levels as selling pressure and market uncertainty persist. Despite its recent recovery attempts, LINK remains stuck below key resistance, making investors cautious about its short-term direction.
Analysts and traders are concerned about a potential drop below the current range, as on-chain metrics suggest a distribution phase may be unfolding. If LINK fails to hold its support zone, it could see renewed selling pressure, sending the price toward lower demand levels.
However, not all signals are bearish. Crypto expert Ali Martinez shared Santiment data on X, revealing that 640,000 LINK were pulled off exchanges in the last 24 hours. This is often seen as a bullish indicator, as large investors typically withdraw their holdings from exchanges when they anticipate higher prices in the future.
When whales and long-term holders accumulate, it reduces selling pressure on the market and strengthens price stability. If LINK manages to break key resistance levels, this accumulation trend could set the stage for a strong recovery rally.
Related Reading
For now, bulls must defend the $13.5 support and push LINK above the $15 mark to confirm a bullish trend reversal. The next few days will be critical as investors watch for a breakout or further downside movement.
Chainlink Bulls Defend Key Support Levels
Chainlink (LINK) is currently trading at $14, facing resistance at the $15 level as bulls struggle to reclaim higher ground. The market remains under pressure, and LINK must hold current levels to avoid a deeper correction.
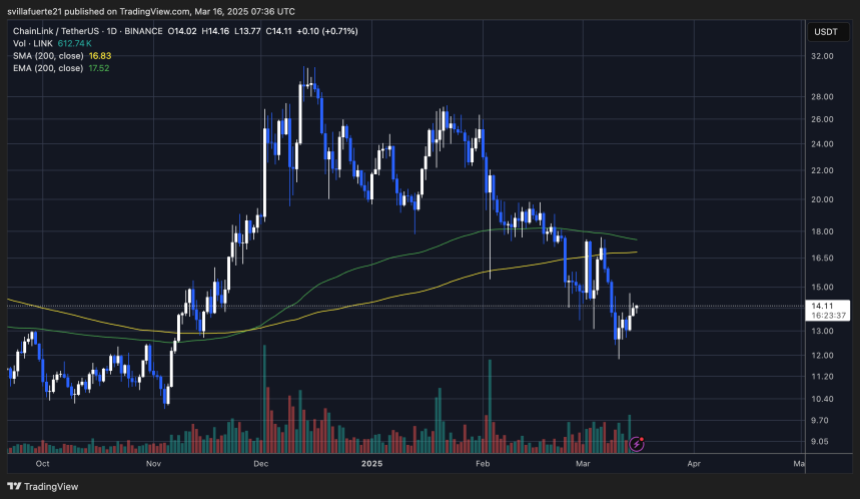
For a recovery rally to take shape, bulls need to defend the $13 support zone and build momentum toward a breakout above $15. If LINK successfully pushes past this resistance, the next major target is the $17 level, where it must reclaim the 200-day moving average (MA) and the exponential moving average (EMA) to confirm a bullish trend reversal.
However, if LINK fails to hold its current support levels, selling pressure could intensify, driving the price toward the $10 range or even lower levels. This would put LINK in a deeper downtrend, making a short-term recovery more difficult.
Related Reading
With market conditions still uncertain, the next few trading sessions will be crucial in determining whether LINK can stabilize and recover or face further downside risks. Bulls must step in soon to regain control and push prices back into an uptrend.
Featured image from Dall-E, chart from TradingView
Source link
Celestia
Market Cap of Top Five Stablecoins Surges to New All-Time High of $204,700,000,000, According to Analyst

A closely followed analyst says that the total market cap of the five largest stablecoins has reached heights never seen before.
Crypto trader Ali Martinez tells his 131,400 followers on the social media platform X that the top five dollar-pegged crypto assets by market cap have a total valuation of $204.7 billion.
The five largest stablecoins in the market include Tether’s USDT, Circle’s USDC, USDS, Ethena’s USDe and DAI, according to data from CoinGecko.

A soaring stablecoin market cap suggests more buying power on the sidelines. It may also suggest that investors are unloading their crypto assets in favor of dollar-pegged coins.
Looking at Ethena (ENA), a decentralized protocol designed to provide a crypto-based alternative to the traditional banking system, Martinez says the altcoin is flashing a bullish signal based on the Tom DeMark Sequential indicator.
Traders use the TD Sequential Indicator to predict potential trend reversals for tokens based on the closing prices of their 13 previous bars or candles.
“Ethena ENA is flashing bullish signals! A buy signal from the TD Sequential indicator on the weekly chart, combined with a hammer candlestick at key support, suggests a strong rebound could be ahead.”

A hammer candlestick pattern is typically viewed as a bullish reversal signal with the candle wick indicating demand.
At time of writing, ENA is trading for $0.44.
The trader adds that the decentralized oracle network Chainlink (LINK) and the modular blockchain Celestia (TIA) are also showing signs of a potential rebound based on the TD Sequential indicator.
At time of writing, LINK is worth $14.30 and TIA is trading for $3.11.
Don’t Miss a Beat – Subscribe to get email alerts delivered directly to your inbox
Check Price Action
Follow us on X, Facebook and Telegram
Surf The Daily Hodl Mix
 
Disclaimer: Opinions expressed at The Daily Hodl are not investment advice. Investors should do their due diligence before making any high-risk investments in Bitcoin, cryptocurrency or digital assets. Please be advised that your transfers and trades are at your own risk, and any losses you may incur are your responsibility. The Daily Hodl does not recommend the buying or selling of any cryptocurrencies or digital assets, nor is The Daily Hodl an investment advisor. Please note that The Daily Hodl participates in affiliate marketing.
Featured Image: Shutterstock/Natalia Siiatovskaia/Tithi Luadthong
Source link

Bitcoin Correction to $76,000 Likely a Downside Deviation, According to Crypto Analyst – Here’s Why

GameStop Approves Adding Bitcoin To Treasury Reserves

Cboe Exchange Submits Filing to List Fidelity Solana ETF

How Strategy is Redefining Corporate Leverage?

Tokenized Treasuries Hit $5B Milestone as Fidelity Investments Touts RWA Potential as Collateral

Cardano Price Eyes $0.85 as Whales Scoop Up 240 Million ADA

Dogecoin Price Mirroring This 2017 Pattern Suggests That A Rise To $4 Could Happen

SEC closes investigation into Immutable nearly 5 months after Wells notice

Solana Rises As BlackRock Brings Its $1,700,000,000 Tokenized Treasury Fund to Ethereum Rival’s Chain

BlackRock Launches Bitcoin ETP In Europe

Crypto holds on to Gains, US may reverse Biden BTC sales, Tesla leads bounce

Cardano price could surge to $2 as whale purchases rise

Bitcoin Cash (BCH) Falls 1.9%, Leading Index Lower

Analyst Sets ‘Conservative’ XRP Price Target At $15, What’s Next?

XRP Breakout On Hold? Financial Expert Reveals What’s Missing


 24/7 Cryptocurrency News5 months ago
Arthur Hayes, Murad’s Prediction For Meme Coins, AI & DeFi Coins For 2025

 Bitcoin2 months ago
Expert Sees Bitcoin Dipping To $50K While Bullish Signs Persist

 24/7 Cryptocurrency News3 months ago
Aptos Leverages Chainlink To Enhance Scalability and Data Access

 Bitcoin5 months ago
Bitcoin Could Rally to $80,000 on the Eve of US Elections

 Altcoins2 months ago
Sonic Now ‘Golden Standard’ of Layer-2s After Scaling Transactions to 16,000+ per Second, Says Andre Cronje

 Bitcoin4 months ago
Institutional Investors Go All In on Crypto as 57% Plan to Boost Allocations as Bull Run Heats Up, Sygnum Survey Reveals

 Opinion5 months ago
Crypto’s Big Trump Gamble Is Risky

 Price analysis5 months ago
Ripple-SEC Case Ends, But These 3 Rivals Could Jump 500x

✓ Share: