
Bitcoin
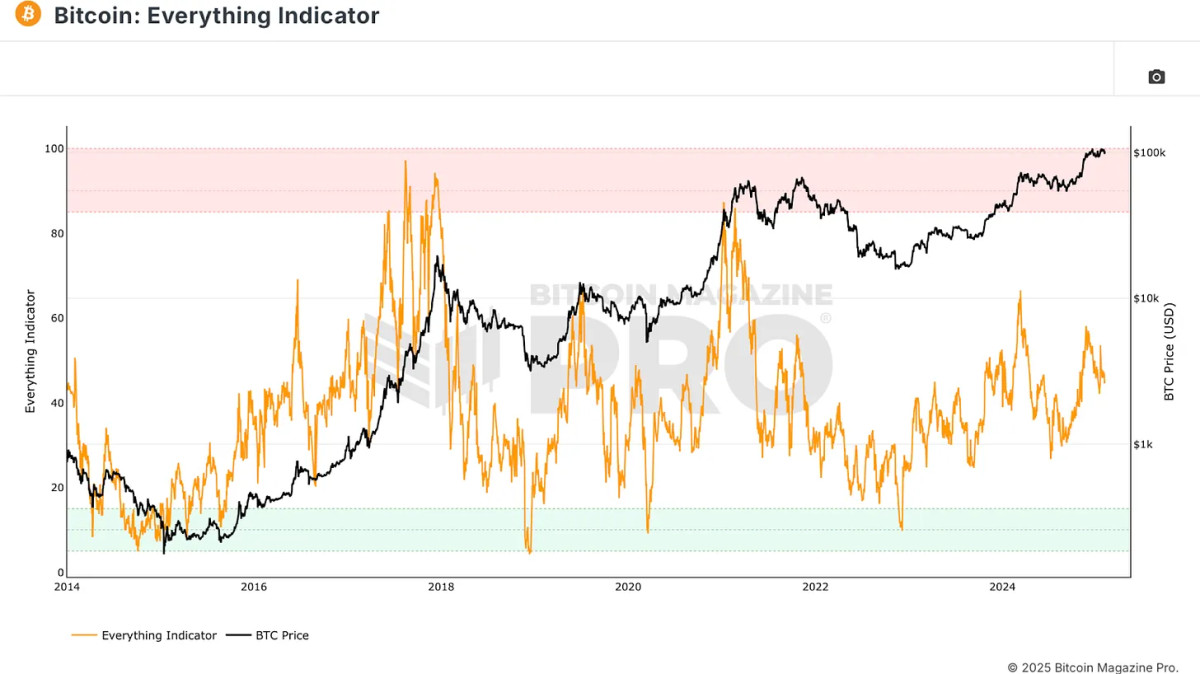
Introducing the Bitcoin Everything Indicator

Wouldn’t it be great if we had one all-encompassing metric to guide our Bitcoin investing decisions? That’s precisely what has been created, the Bitcoin Everything Indicator. Recently added to Bitcoin Magazine Pro, this indicator aims to consolidate multiple metrics into a single framework, making Bitcoin analysis and investment decision-making more streamlined.
For a more in-depth look into this topic, check out a recent YouTube video here: The Official Bitcoin EVERYTHING Indicator
Why We Need a Comprehensive Indicator
Investors and analysts typically rely on various metrics, such as on-chain data, technical analysis, and derivative charts. However, focusing too much on one aspect can lead to an incomplete understanding of Bitcoin’s price movements. The Bitcoin Everything Indicator attempts to solve this by integrating key components into one clear metric.

The Core Components of the Bitcoin Everything Indicator
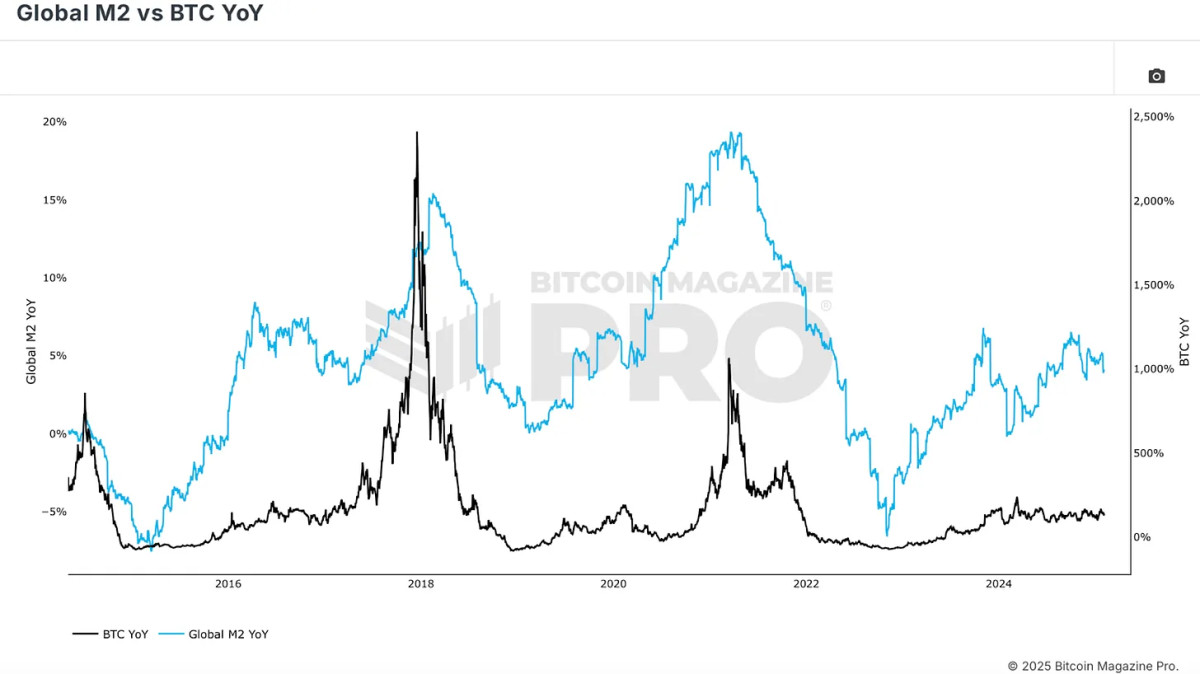
Bitcoin’s price action is deeply influenced by global liquidity cycles, making macroeconomic conditions a fundamental pillar of this indicator. The correlation between Bitcoin and broader financial markets, especially in terms of Global M2 money supply, is clear. When liquidity expands, Bitcoin typically appreciates.
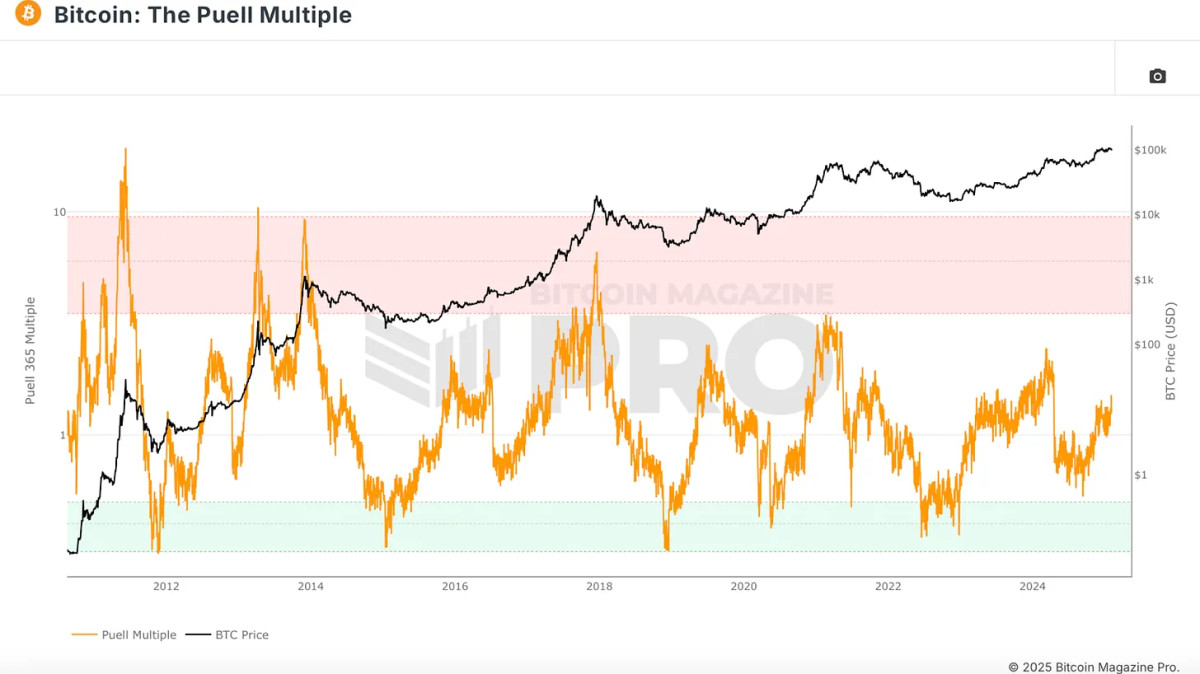
Fundamental factors like Bitcoin’s halving cycles and miner strength play an essential role in its valuation. While halvings decrease new Bitcoin supply, their impact on price appreciation has diminished as over 94% of Bitcoin’s total supply is already in circulation. However, miner profitability remains crucial. The Puell Multiple, which measures miner revenue relative to historical averages, provides insights into market cycles. Historically, when miner profitability is strong, Bitcoin tends to be in a favorable position.
On-chain indicators help assess Bitcoin’s supply and demand dynamics. The MVRV Z-Score, for example, compares Bitcoin’s market cap to its realized cap (average purchase price of all coins). This metric identifies accumulation and distribution zones, highlighting when Bitcoin is overvalued or undervalued.

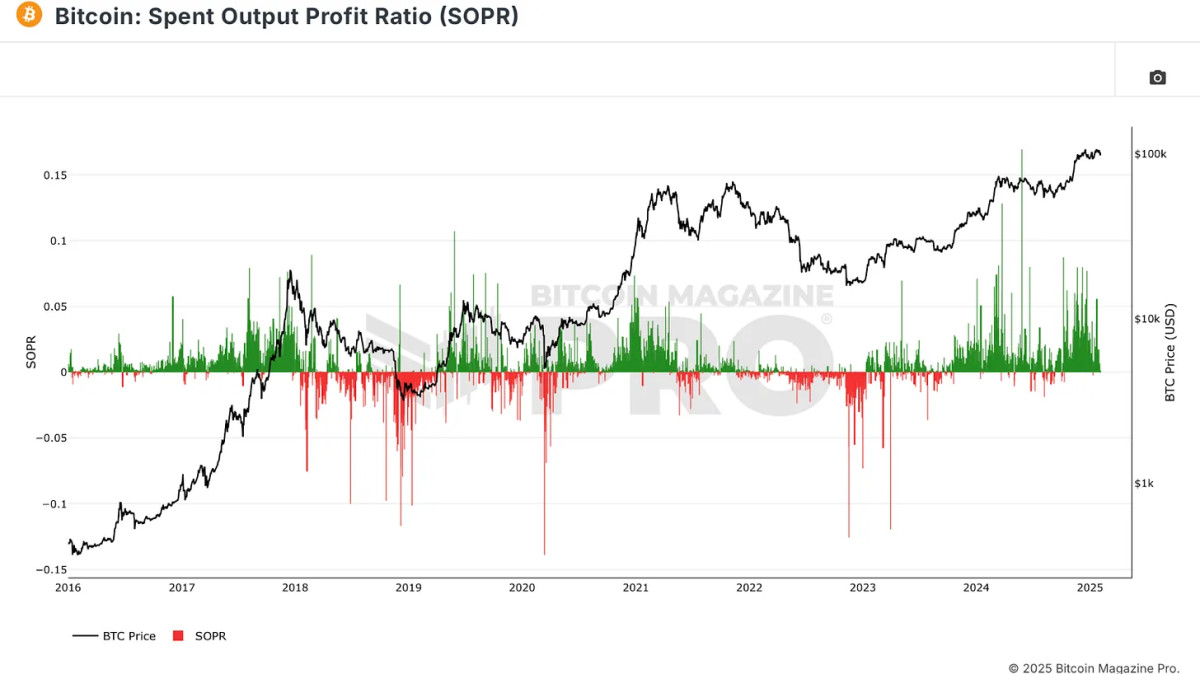
Another critical on-chain metric is the Spent Output Profit Ratio (SOPR), which examines the profitability of coins being spent. When Bitcoin holders realize massive profits, it often signals a market peak, whereas high losses indicate a market bottom.
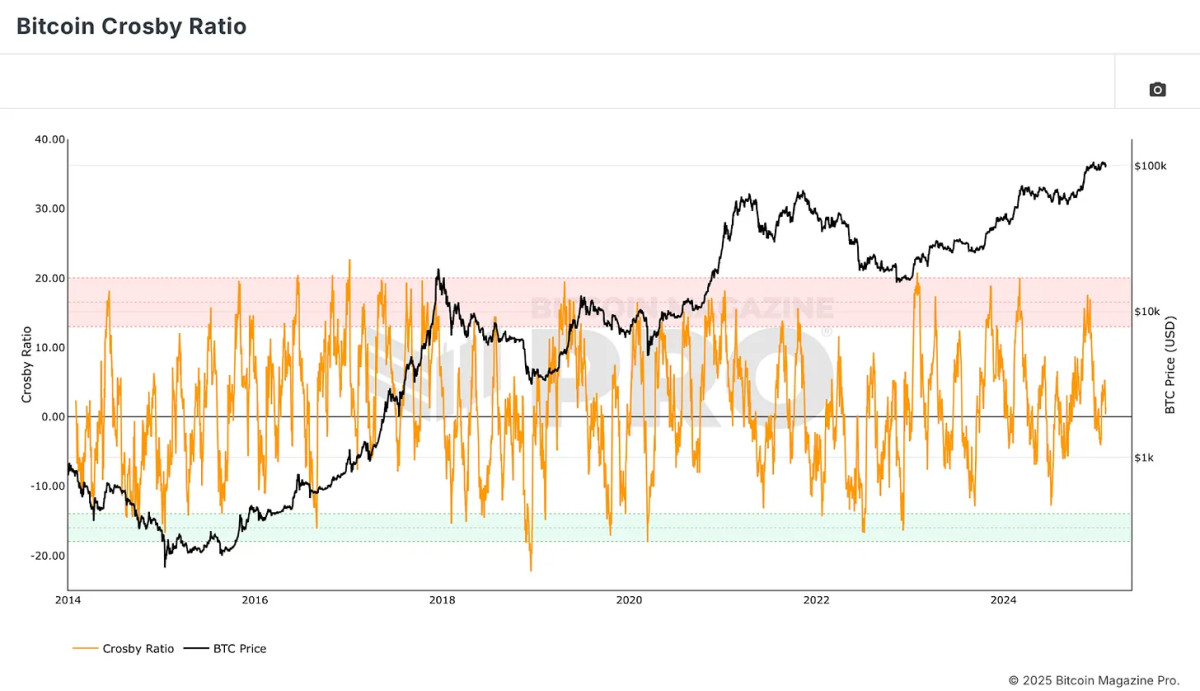
The Bitcoin Crosby Ratio is a technical metric that assesses Bitcoin’s overextended or discounted conditions purely based on price action. This ensures that market sentiment and momentum are also accounted for in the Bitcoin Everything Indicator.
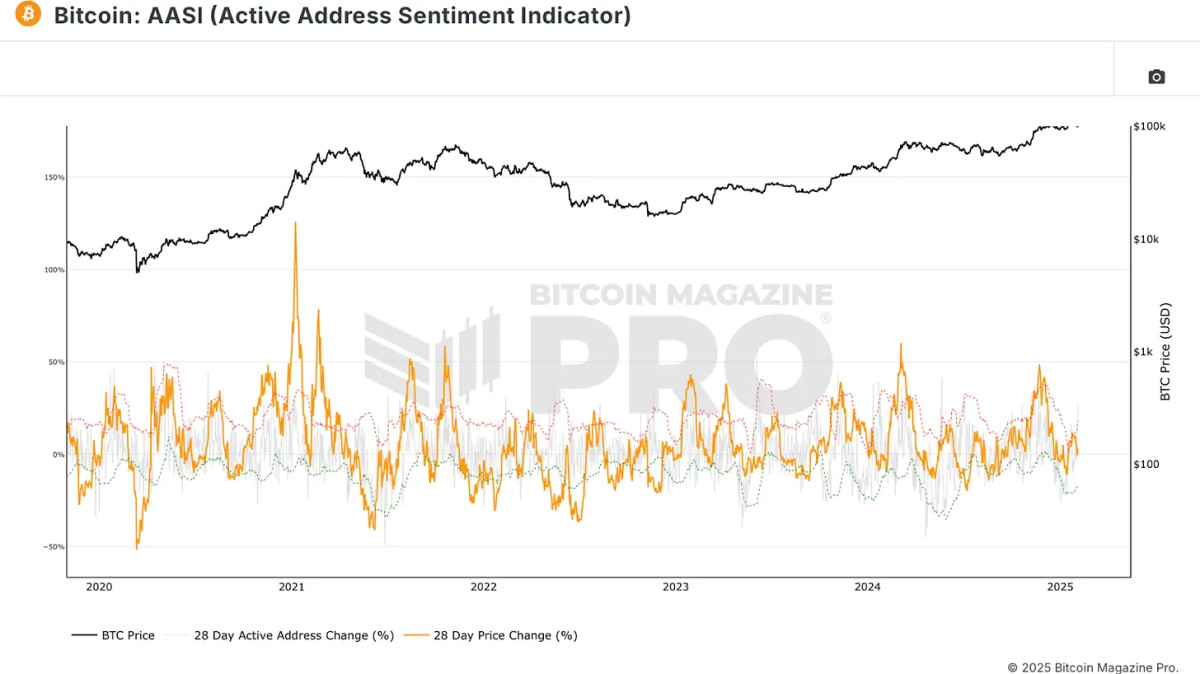
Network usage can offer vital clues about Bitcoin’s strength. The Active Address Sentiment Indicator measures the percentage change in active addresses over 28 days. A rise in active addresses generally confirms a bullish trend, while stagnation or decline may signal price weakness.
How the Bitcoin Everything Indicator Works
By blending these various metrics, the Bitcoin Everything Indicator ensures that no single factor is given undue weight. Unlike models that rely too heavily on specific signals, such as the MVRV Z-Score or the Pi Cycle Top, this indicator distributes influence equally across multiple categories. This prevents overfitting and allows the model to adapt to changing market conditions.

Historical Performance vs. Buy-and-Hold Strategy
One of the most striking findings is that the Bitcoin Everything Indicator has outperformed a simple buy-and-hold strategy since Bitcoin was valued at under $6. Using a strategy of accumulating Bitcoin during oversold conditions and gradually selling in overbought zones, investors using this model would have significantly increased their portfolio’s performance with lower drawdowns.
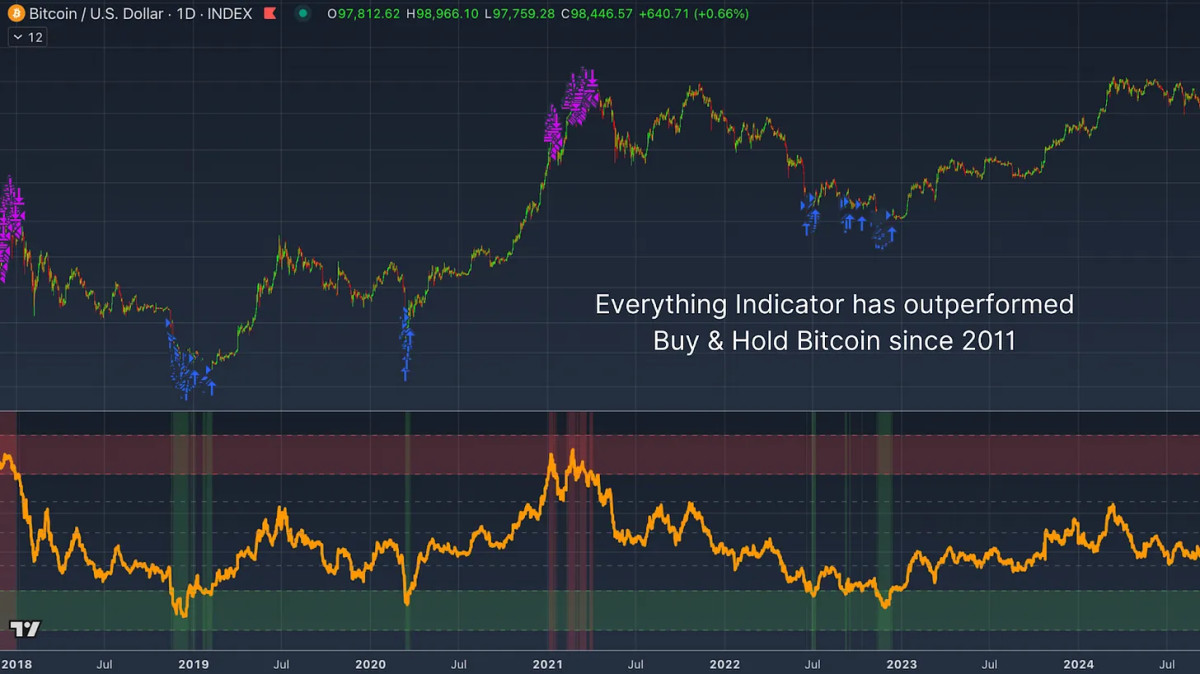
For instance, this model maintains a 20% drawdown compared to the 60-90% declines typically seen in Bitcoin’s history. This suggests that a well-balanced, data-driven approach can help investors make more informed decisions with reduced downside risk.
Conclusion
The Bitcoin Everything Indicator simplifies investing by merging the most critical aspects influencing Bitcoin’s price action into a single metric. It has historically outperformed buy-and-hold strategies while mitigating risk, making it a valuable tool for both retail and institutional investors.
For more detailed Bitcoin analysis and to access advanced features like live charts, personalized indicator alerts, and in-depth industry reports, check out Bitcoin Magazine Pro.
Disclaimer: This article is for informational purposes only and should not be considered financial advice. Always do your own research before making any investment decisions.
Source link


President Donald Trump is expected to deliver a speech tomorrow via a recording at Blockworks’ Digital Asset Summit (DAS) in New York City. This will be the first time a sitting U.S. president has addressed a Bitcoin and crypto conference, highlighting the growing influence of digital assets in mainstream financial policy.
Trump has previously engaged with the Bitcoin community, having spoken in person at the world’s largest Bitcoin conference in Nashville last summer while on the campaign trail. His return to the stage now as president further highlights the continued support from the U.S. government on Bitcoin.
Trump’s upcoming address at DAS comes only a couple weeks after moving forward with officially integrating Bitcoin into his national strategy, when he signed an executive order establishing the U.S. Strategic Bitcoin Reserve, positioning BTC as a key asset for the country’s financial future.
Joining the lineup tomorrow at DAS is Strategy’s Michael Saylor, who will deliver a keynote speech and engage in a fireside chat with Bitcoin historian Pete Rizzo. Additionally, Bloomberg ETF analyst James Seyffart will host a panel discussion with BlackRock’s Head of Digital Assets Robbie Mitchnick and Nasdaq’s Head of U.S. Equities & Exchange-Traded Products Giang Bui, where they will delve into the evolving landscape of Bitcoin ETFs and institutional adoption.
The announcement of Trump’s participation follows remarks from Bo Hines, Executive Director on Digital Assets for President Trump, who spoke earlier this week at DAS. Hines reaffirmed the administration’s commitment to accumulating Bitcoin for the Strategic Bitcoin Reserve, stating:
“I think it’s high time that our President started accumulating assets for the American people, which is what President Trump is doing rather than taking it away.”
He also emphasized the administration’s approach to acquiring Bitcoin in budget-neutral ways, likening BTC accumulation to gold reserves:
“You know, I’ve been asked all the time, it’s like how much do you want? Well, that’s like asking a country how much gold do you want – as much as we can get.”
JUST IN –
President Trump’s Executive Director on digital assets: “We talked about ways of acquiring more Bitcoin in budget neutral ways.”
We want “as much as we can get.”
pic.twitter.com/zK8PyQK1Rw
— Bitcoin Magazine (@BitcoinMagazine) March 18, 2025
Trump’s executive order has already sparked legislative action aiming to build on this momentum. Senator Cynthia Lummis and Congressman Nick Begich have each proposed plans for the U.S. to acquire 1 million BTC over the next five years, ensuring a long-term reserve of the scarce asset. Earlier today at DAS, House Majority Whip and Congressman Tom Emmer stated that he believes this legislation will be enacted “before this congress is done.”
JUST IN:
— Bitcoin Magazine (@BitcoinMagazine) March 19, 2025
Source link
Altcoins
Analyst Says Bitcoin Primed for ‘Party Time’ if BTC Breaks Above Critical Level, Updates Outlook on Chainlink

Crypto strategist Michaël van de Poppe says Bitcoin (BTC) may take off on a series of rallies if it can break through a key resistance level in the coming days.
The analyst tells his 782,000 followers on the social media platform X that Bitcoin needs to flip $84,500 into support this week in order to regain bullish momentum.
However, he warns if Bitcoin fails to break through $84,500, the flagship crypto asset may collapse in price.
“I really want to see some momentum on Bitcoin. If it doesn’t happen this week and we’ll break sub $82,000, likely we’ll see some new lows. Break $84,500 equals party time.”
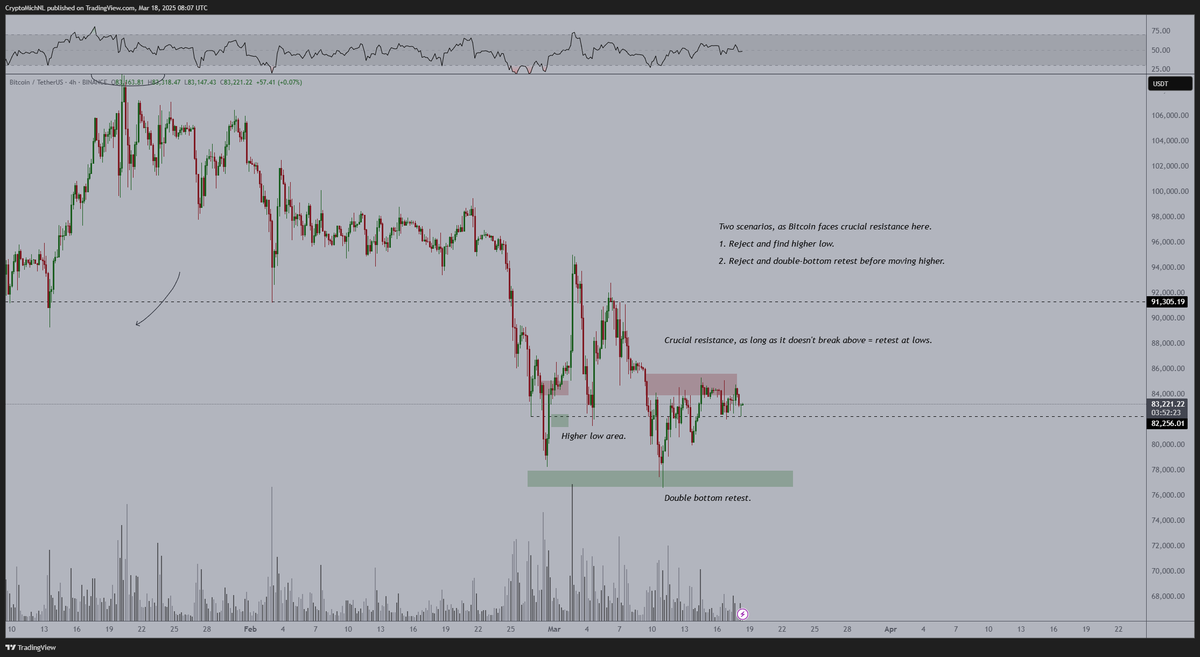
Looking at his chart, the analyst says if Bitcoin fails to reclaim $84,500 as support this week, there are two likely outcomes.
“Two scenarios, as Bitcoin faces crucial resistance here:
- Reject and find a higher low [around $82,000].
- Reject and double-bottom retest [in the $70,000 range] before moving higher.”
Bitcoin is trading for $87,315 at time of writing, up 5.7% in the last 24 hours.
Next up, the analyst says that the decentralized oracle network Chainlink may be printing a double-bottom pattern against Bitcoin (LINK/BTC) on the weekly chart.
A double-bottom pattern is typically considered a bullish reversal pattern as buyers step in to create a price floor for an asset.
“LINK doing a double bottom test and back to the range low. Weekly firing up nicely. Things are heating up the right way.”
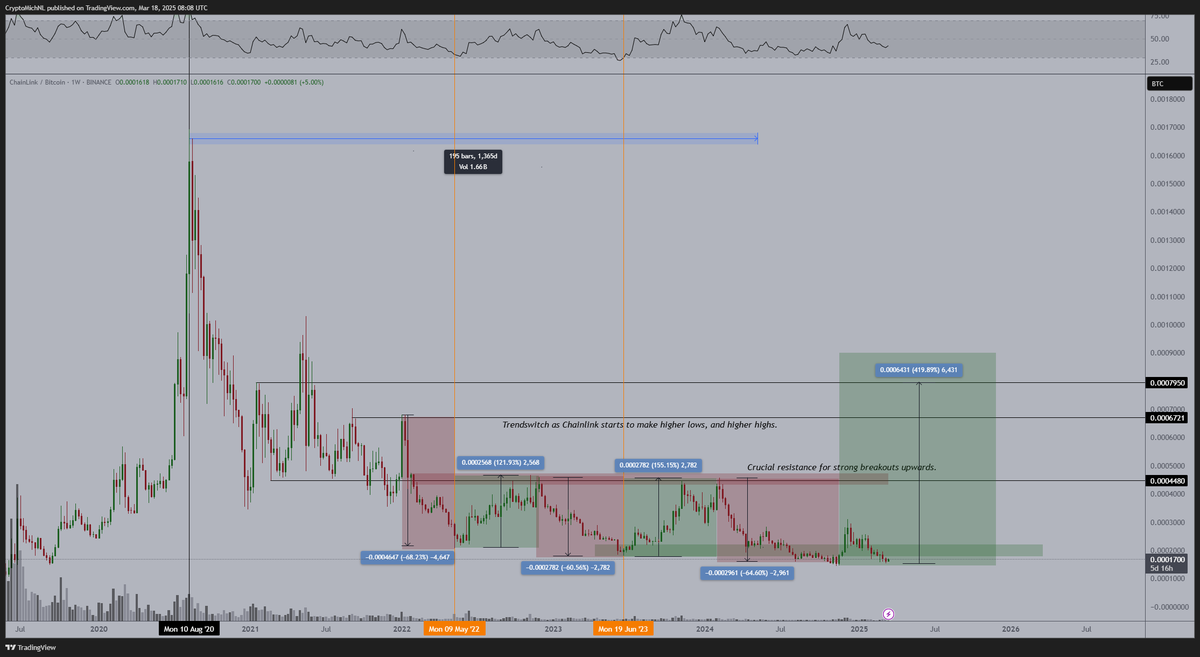
Based on the trader’s chart, he seems to predict that LINK/BTC will soar to as high as 0.000795 BTC worth $68.39.
LINK/BTC is trading for 0.0001719 BTC ($14.92) at time of writing, up nearly 2% in the last 24 hours.
Follow us on X, Facebook and Telegram
Don’t Miss a Beat – Subscribe to get email alerts delivered directly to your inbox
Check Price Action
Surf The Daily Hodl Mix
 

Disclaimer: Opinions expressed at The Daily Hodl are not investment advice. Investors should do their due diligence before making any high-risk investments in Bitcoin, cryptocurrency or digital assets. Please be advised that your transfers and trades are at your own risk, and any losses you may incur are your responsibility. The Daily Hodl does not recommend the buying or selling of any cryptocurrencies or digital assets, nor is The Daily Hodl an investment advisor. Please note that The Daily Hodl participates in affiliate marketing.
Generated Image: Midjourney
Source link
Reason to trust
![]()
Strict editorial policy that focuses on accuracy, relevance, and impartiality
Created by industry experts and meticulously reviewed
The highest standards in reporting and publishing
Strict editorial policy that focuses on accuracy, relevance, and impartiality
Morbi pretium leo et nisl aliquam mollis. Quisque arcu lorem, ultricies quis pellentesque nec, ullamcorper eu odio.
Bitcoin’s long-term holders have resumed accumulation in what is a notable shift in investor sentiment despite the turbulence that has gripped the market in recent weeks. Particularly, data from on-chain analytics platform Glassnode shows that the “BTC: Long-term holder net position change” metric has flipped positive for the first time this year. This suggests that long-term Bitcoin investors are capitalizing on market conditions to add significant amounts of BTC to their holdings.
Long-Term Holders Add 167,000 BTC Amid March Crash
Earlier this month, Bitcoin’s price plunged from above $90,000 to around $80,000 during a rapid sell-off. This price stunned many traders and triggered a continuous wave of liquidations among short-term investors. Yet despite this steep correction, long-term holders treated the sub-$90,000 levels as a buying opportunity rather than a reason to capitulate.
Related Reading
In other words, coins are moving into wallets that haven’t spent their BTC in a long time, which is a notable reversal after starting 2025 with a negative net position change. This marks the first net accumulation by these “HODLers” in 2025. Glassnode’s Long-Term Holder Net Position Change metric, which had been in the red, flipped “green” as long-term investors aggressively accumulated through the downturn.
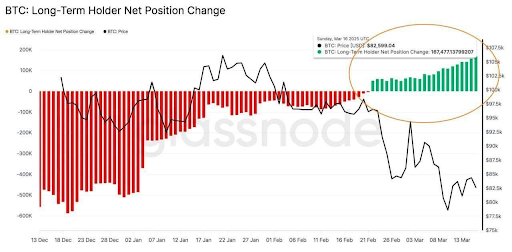
On-chain data shows that this flip to green has seen long-term holders increase their net Bitcoin holdings by more than 167,000 BTC in the past month. This notable influx is valued at nearly $14 billion. In short, the cohort of seasoned holders began scooping up cheap BTC while short-term sentiment was at its bleakest.
Is A Bitcoin Price Recovery Brewing?
The timing of this flip from red selloff to green accumulation among long-term holders is striking, considering what the Bitcoin price went through in the past two weeks. This data suggests that a large part of the Bitcoin crash was caused by panic-selling among short-term holders. This behavior aligns with past market cycles between August and September 2024, where long-term holders accumulated aggressively during a price dip.
Related Reading
Interestingly, Glassnode’s long-term holder metric isn’t the only one pointing to positive Bitcoin sentiment among large holders. After weeks of uncertainty, Bitcoin exchange-traded funds (ETFs) have started seeing net inflows again. On March 17, spot Bitcoin ETFs collectively drew in about $274.6 million, the largest single-day inflow in 28 days and a clear signal of renewed investor interest.
The very next day brought another wave of fresh capital, with roughly $209 million pouring into Bitcoin funds on March 18. In fact, this three-day streak represents the first sustained run of positive inflows since February 18, a period during which Bitcoin funds have experienced consecutive days of outflows.
At the time of writing, Bitcoin is trading at $83,500.
Featured image from Unsplash, chart from Tradingview.com
Source link

Tether’s US treasury holdings surpass Canada, Taiwan, ranks 7th globally
Here’s Where Support & Resistance Lies For Solana, Based On On-Chain Data

President Trump To Address The Digital Assets Summit Tomorrow

Analyst Says Bitcoin Primed for ‘Party Time’ if BTC Breaks Above Critical Level, Updates Outlook on Chainlink

Binance adds a new EUR market tier to its fiat liquidity provider program

Authorities Target Crypto Scammers Posing as Binance in Australia

Why Is Solana Price Up 6% Today?

Ripple CEO Confident of XRP Being Included in U.S. Strategic Reserve, Says IPO is 'Possible'

Bitnomial drops SEC lawsuit ahead of XRP futures launch in the US
Bitcoin Long-Term Holder Net Position Turns Green For The First Time In 2025

BIGGER THAN ORDINALS. MORE THAN ART

Leading Shiba Inu Rival Flashing Bullish Signals Hinting at Price Reversal, According to Santiment

Binance’s USDT pair with Turkish lira sees largest amplitude since 2024 after key Erdogan rival detained

Treasury Expands Financial Surveillance of Cash Transactions—What About Crypto?

Bitcoin Price Eyes 90K rally at Blackrock-led ETFs Buy $512M BTC 3-Days before US Fed Decision

Arthur Hayes, Murad’s Prediction For Meme Coins, AI & DeFi Coins For 2025

Expert Sees Bitcoin Dipping To $50K While Bullish Signs Persist

Aptos Leverages Chainlink To Enhance Scalability and Data Access

Bitcoin Could Rally to $80,000 on the Eve of US Elections

Sonic Now ‘Golden Standard’ of Layer-2s After Scaling Transactions to 16,000+ per Second, Says Andre Cronje

Institutional Investors Go All In on Crypto as 57% Plan to Boost Allocations as Bull Run Heats Up, Sygnum Survey Reveals

Crypto’s Big Trump Gamble Is Risky

Ripple-SEC Case Ends, But These 3 Rivals Could Jump 500x

Has The Bitcoin Price Already Peaked?

A16z-backed Espresso announces mainnet launch of core product

Xmas Altcoin Rally Insights by BNM Agent I

Blockchain groups challenge new broker reporting rule

Trump’s Coin Is About As Revolutionary As OneCoin

Is $200,000 a Realistic Bitcoin Price Target for This Cycle?

The Future of Bitcoin: Scaling, Institutional Adoption, and Strategic Reserves with Rich Rines
 24/7 Cryptocurrency News4 months ago
Arthur Hayes, Murad’s Prediction For Meme Coins, AI & DeFi Coins For 2025
 Bitcoin2 months ago
Expert Sees Bitcoin Dipping To $50K While Bullish Signs Persist
 24/7 Cryptocurrency News2 months ago
Aptos Leverages Chainlink To Enhance Scalability and Data Access
 Bitcoin4 months ago
Bitcoin Could Rally to $80,000 on the Eve of US Elections
 Altcoins2 months ago
Sonic Now ‘Golden Standard’ of Layer-2s After Scaling Transactions to 16,000+ per Second, Says Andre Cronje
 Bitcoin4 months ago
Institutional Investors Go All In on Crypto as 57% Plan to Boost Allocations as Bull Run Heats Up, Sygnum Survey Reveals
 Opinion5 months ago
Crypto’s Big Trump Gamble Is Risky
 Price analysis4 months ago
Ripple-SEC Case Ends, But These 3 Rivals Could Jump 500x
