
Price analysis
Will SHIB Rebound or Decline Further?
Shiba Inu (SHIB) price has been struggling near key support after recent market corrections. The token has been trading below a critical level, reflecting ongoing volatility. SHIB dropped from its December peak of $0.0000329 and remains in a downward trend. Analysts predict a possible rebound, but market conditions suggest uncertainty about its next direction.
Shiba Inu Price Analysis: What’s Next for SHIB in the Market?
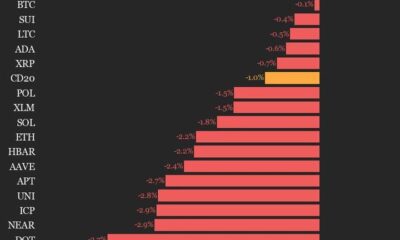
Shiba Inu price dropped sharply as the broader meme coin market faced losses. After a strong start to March, assets like Dogecoin and SHIB saw a downturn. This decline pushed Shiba Inu lower in market rankings, reflecting the overall weakness in the crypto sector.
Meme coins, including Dogecoin, WIF, PENGU, BONK, and PEPE, have recorded notable price decreases. The trend follows the broader market correction affecting digital assets. Shiba Inu’s price movement has been in line with this sentiment, signaling uncertainty among traders.
Despite the slump, three potential catalysts could boost SHIB’s price. The most significant factor is its rising burn rate. On March 8, the daily burn rate surged by 3,250% to 29 million tokens. Since its inception, over 410 trillion SHIB tokens have been removed from circulation, reducing supply to 584 trillion.
Analyst Predicts Shiba Inu Breakout With 422% Surge
Crypto analyst reports indicate that the SHIB price may have broken out of a Falling Wedge pattern. The breakout suggests a potential price surge, with projections hinting at a significant increase. Analysts highlight that if momentum sustains, the asset could experience a rise exceeding 422%, targeting $0.00008841.
Market sentiment around Shiba Inu remains strong, with traders monitoring technical signals. The meme-based asset has drawn attention amid discussions about its bullish trajectory.
SHIB Price Dips; Key Levels To Watch
As of 9th March, the SHIB price is trading at $0.00001254, reflecting a 0.40% decline over the past 24- hours.
The price remains within a narrow range as bearish sentiment persists. Key support is holding near $0.00001, while resistance sits around $0.000015. SHIB has struggled to break past these levels, signaling weakened momentum.
The MACD indicator shows a negative trend, with the MACD line hovering below the signal line. The histogram reveals growing red bars, indicating selling pressure. If the MACD line fails to cross above the signal line, downward movement may continue.
The RSI stands at 33, moving closer to the oversold zone. This suggests weak buying momentum.
Shiba Inu price prediction remains confined to a tight price channel, failing to establish a strong upward trend. The recent drop signals continued weakness, with buyers hesitant to step in. A breakout above $0.000015 may shift momentum toward bullish territory, while a fall below $0.00001 could extend losses. A sustained move above $0.000015 could open doors for bullish to target $0.000018 and $0.00002 resistance levels.

To sum up, the Shiba Inu price remains under pressure, struggling to hold key support. Analysts observe mixed signals, with traders closely watching technical indicators. The market’s next move will determine if SHIB rebounds or continues its decline.
Frequently Asked Questions (FAQs)
The key support level is near $0.00001, while resistance sits around $0.000015. A breakout could determine its next trend.
SHIB’s burn rate increase, technical breakout patterns, and overall market recovery could support a potential price rise.
If SHIB sustains a breakout above resistance, it may reach the projected target, but market conditions remain uncertain.
Coingape Staff
CoinGape comprises an experienced team of native content writers and editors working round the clock to cover news globally and present news as a fact rather than an opinion. CoinGape writers and reporters contributed to this article.
Disclaimer: The presented content may include the personal opinion of the author and is subject to market condition. Do your market research before investing in cryptocurrencies. The author or the publication does not hold any responsibility for your personal financial loss.
Source link


Bitcoin
Bitcoin Price Eyes 90K rally at Blackrock-led ETFs Buy $512M BTC 3-Days before US Fed Decision
Bitcoin price surged by 4% on Wednesday, hitting a 10-day peak . This rally follows three consecutive days of substantial Bitcoin ETF inflows, totaling $512 million. As BTC flirts with the critical $90,000 resistance level, investors are closely watching the impact of the Federal Reserve’s policy decision on global markets.
Bitcoin (BTC) Price Hits 10-Day Peak on Fed Rate Decision
Bitcoin (BTC) surged by 4% on Wednesday, reaching a 10-day high of $85,900 as the U.S. Federal Reserve’s decision to pause interest rate hikes aligned with investor expectations.

This bullish momentum follows three consecutive days of strong institutional inflows into Bitcoin ETFs, totalling $512 million. With BTC price facing critical resistance at $90,000, market participants are watching closely to see whether institutional demand and macroeconomic conditions will trigger more gains in the coming trading sessions.
ETF Inflows Surged $512M ahead of Fed Rate Decision
Since their introduction, Bitcoin ETFs have become a key gauge of institutional sentiment in the cryptocurrency market. After 3-week selling spree, Bitcoin ETFs have recored positive inflows over the past three trading days, according to SosoValue data

On Tuesday alone, Bitcoin ETFs saw $209 million in inflows, marking one of the strongest demand periods in weeks. The funds have accumulated over $512 million in Bitcoin purchases, underscoring strong demand from corporate and institutional investors.
Historically, such sustained inflows have often preceded significant price breakouts, suggesting that institutional investors swung bullish BTC’s short-term price prospects as markets priced in a 99% chance of a rate pause at the start of the week.
BTC Faces Key Resistance at $90,000 Amid Short Squeeze Pressure
Despite its recent gains, Bitcoin price is showing more upside potential. According to the latest derivatives data from Coinglass, over $290 million worth of BTC short positions were closed near the $85,000 level.
Short traders, who profit when prices decline, are making last-ditch efforts to defend their positions and avoid a wave of forced liquidations.

However, liquidation heatmaps suggest that BTC short liquidations at the $85,000 level may have weaken ed neighboring resistance zones. If Bitcoin sustains momentum and breaks above $90,000, it could trigger a cascading effect, forcing more short sellers to cover their positions and further driving up the price.
US Fed Rate Pause Boosts Risk Asset Appetite
The Federal Reserve’s decision to maintain interest rates at current levels has provided additional support for Bitcoin’s rally. A pause in rate hikes signals a more accommodative stance toward financial markets, which typically benefits risk assets such as cryptocurrencies.

Lower interest rates make traditional savings and fixed-income investments less attractive, prompting investors to seek higher returns in alternative assets like Bitcoin. If institutional investors interpret the Fed’s stance as a green light for continued Bitcoin accumulation, ETF inflows could remain strong, further reinforcing the bullish outlook.
Bitcoin Price Outlook: Path to $90K and Beyond?
With ETF inflows surging and macroeconomic conditions remaining favorable, Bitcoin price forecast signals appears well-positioned for a continued uptrend. However, to sustain its bullish momentum, BTC must overcome key resistance levels:
- $90,000 – A major psychological level that could trigger a new wave of buying or profit-taking.
- $92,500 – The next upside target if BTC breaks through $90K.

On the downside, strong support levels include:
- $85,000 – A key level where short liquidations have already been triggered.
- $82,500 – A potential retest zone if BTC faces rejection at $90,000.
The ongoing BTC price surge is fuelled by strong institutional demand and a favorable macroeconomic backdrop. With $512 million in ETF inflows and short sellers under pressure, BTC’s path to $90,000 looks increasingly viable. However, breaking through this critical resistance will be key in determining whether Bitcoin can extend its rally toward new all-time highs.
Frequently Asked Questions (FAQs)
Bitcoin’s recent price surge is fueled by strong ETF inflows, institutional demand, and macroeconomic factors like the Federal Reserve’s rate pause.
The $90,000 level represents a major psychological and technical barrier where large short positions could trigger a short squeeze or a pullback.
Bitcoin ETFs allow institutional investors to gain exposure to BTC, and significant inflows often drive price surges due to increased market confidence.
ibrahim
Crypto analyst covering derivatives markets, macro trends, technical analysis, and DeFi. His works feature in-depth market insights, price forecasts, and institutional-grade research on digital assets.
Disclaimer: The presented content may include the personal opinion of the author and is subject to market condition. Do your market research before investing in cryptocurrencies. The author or the publication does not hold any responsibility for your personal financial loss.
Source link

Pi Network price has crashed over the past few weeks, erasing some of the gains made after its mainnet launch in February.
Pi Network (PI) has dropped to $1.13, down from an all-time high of $3, bringing its market cap to $7.73 billion from an all-time high of nearly $20 billion. This article explores the top four catalysts that may push the Pi coin to $10 in the long term.
Crypto market rally
A crypto market rally is the most important catalyst that may push the Pi coin price to $10. Such a rally would happen if Bitcoin rebounds from the current correction and surges above its all-time high.
Altcoins have historically performed well when Bitcoin is in a strong uptrend. This surge is usually driven by increased demand from investors and a rise in the crypto fear and greed index.
Potential catalysts for the next crypto market rally include a dovish Federal Reserve, greater regulatory clarity, and more ETF approvals.
Pi Network burn mechanism
Another potential catalyst for Pi Network’s price is a token burn mechanism. A burn refers to a situation where tokens are moved into an inaccessible wallet, reducing supply and helping to control inflation.
Token burns could help offset the ongoing unlocks. Over 188 million Pi coins will be unlocked this month, with another 1.6 billion expected over the next 12 months. More token unlocks will happen in the future since only 6.84 billion are currently in circulation out of a total supply of 100 billion.
Pi Network has various ways of burning tokens. It can burn tokens from users who have not migrated them to the mainnet. It can also burn fees generated from its ecosystem, and the Pi Foundation can voluntarily burn some of its tokens.

Potental Pi coin ETF appoval
Another potential catalyst that could push Pi Network’s price to $10 is a spot ETF application and approval by the Securities and Exchange Commission. Pi meets most of the conditions needed for approval.
It is a larger cryptocurrency than others that have received ETF applications, such as Sui (SUI), Litecoin (LTC), and Polkadot (DOT). It is also more liquid than some of these coins since its daily volume is often over $1 billion.
Pi Network is also a proof-of-work cryptocurrency, meaning that its technology is similar to that of Bitcoin (BTC) and Ethereum.
Exchange listings would benefit Pi Network price
Another key catalyst for Pi Network is potential exchange listings by major platforms like Coinbase, Binance, Upbit, and Kraken. It would also benefit from listings on decentralized exchanges like Uniswap and Raydium through a wrapped version of the token.
A Binance listing would expose it to over 200 million global customers. A Coinbase and Kraken listing would broaden its reach among American customers, while Upbit would open access to South Korean traders.
Source link

Bubblemaps’ token, BMT crypto, has gone up by nearly 30% following its debut on Binance. Just a day prior, the token reached a new all-time high.
According to data from CoinGecko, the BubbleMaps token has gone up by 28.8% only a day after it was listed on Binance. Less than 24 hours ago, the token reached new heights when it bounded up by nearly 45% to a new all-time high of $0.3173.
At press time, the token is trading hands at $0.24 with a market cap of $62 million. Meanwhile, BMT crypto’s fully diluted valuation stands at $242 million.
According to the official announcement, Binance listed BMT crypto on its platform on March 18 at 15:00 UTC and opened trading for BMT paired with major tokens including USDT (USDT), USDC (USDC), BNB (BNB), FDUSD (FDUSD), and TRY. However, the crypto exchange warned users that it will applying the seed tag, considering the token is still fairly new to the market.

Despite having just listed on the crypto exchange yesterday, Binance has already claimed the top spot on Bubblemaps’ trading markets, contributing the largest share of the token’s trading volume at 23.47%. In the past 24 hours, as much as $131 million worth of BMT crypto has been processed on Binance.
In fact, Bubblemaps trading volume skyrocketed by 442.8% to a total of $562 million in the past 24 hours. This means that the token has experienced a significant rise in market activity since its Binance listing.
Launched on March 11, BMT is the native token for Bubblemaps. Bubblemaps is an on-chain analytics platform that provides users with blockchain data visualization for token analytics and NFT owenrship. BMT serves as its governance utility token, granting holders access to advanced analytical features on the platform.
During Bubblemaps’ token generation event for BMT, it received an overwhelming number of subscriptions, around 202,990 BNB, which is13,500% more than the project’s initial target.
Disclosure: This article does not represent investment advice. The content and materials featured on this page are for educational purposes only.
Source link

Avalanche (AVAX) Drops 4.5%, Leading Index Lower

Tether’s US treasury holdings surpass Canada, Taiwan, ranks 7th globally
Here’s Where Support & Resistance Lies For Solana, Based On On-Chain Data

President Trump To Address The Digital Assets Summit Tomorrow

Analyst Says Bitcoin Primed for ‘Party Time’ if BTC Breaks Above Critical Level, Updates Outlook on Chainlink

Binance adds a new EUR market tier to its fiat liquidity provider program

Authorities Target Crypto Scammers Posing as Binance in Australia

Why Is Solana Price Up 6% Today?

Ripple CEO Confident of XRP Being Included in U.S. Strategic Reserve, Says IPO is 'Possible'

Bitnomial drops SEC lawsuit ahead of XRP futures launch in the US
Bitcoin Long-Term Holder Net Position Turns Green For The First Time In 2025

BIGGER THAN ORDINALS. MORE THAN ART

Leading Shiba Inu Rival Flashing Bullish Signals Hinting at Price Reversal, According to Santiment

Binance’s USDT pair with Turkish lira sees largest amplitude since 2024 after key Erdogan rival detained

Treasury Expands Financial Surveillance of Cash Transactions—What About Crypto?


 24/7 Cryptocurrency News4 months ago
Arthur Hayes, Murad’s Prediction For Meme Coins, AI & DeFi Coins For 2025

 Bitcoin2 months ago
Expert Sees Bitcoin Dipping To $50K While Bullish Signs Persist

 24/7 Cryptocurrency News2 months ago
Aptos Leverages Chainlink To Enhance Scalability and Data Access

 Bitcoin4 months ago
Bitcoin Could Rally to $80,000 on the Eve of US Elections

 Altcoins2 months ago
Sonic Now ‘Golden Standard’ of Layer-2s After Scaling Transactions to 16,000+ per Second, Says Andre Cronje

 Bitcoin4 months ago
Institutional Investors Go All In on Crypto as 57% Plan to Boost Allocations as Bull Run Heats Up, Sygnum Survey Reveals

 Opinion5 months ago
Crypto’s Big Trump Gamble Is Risky

 Price analysis4 months ago
Ripple-SEC Case Ends, But These 3 Rivals Could Jump 500x

✓ Share: