
Bitcoin
This Crypto Analyst Correctly Predicted XRP Price Crash Below $2, Here’s The Rest Of The Forecast

Reason to trust
![]()
Strict editorial policy that focuses on accuracy, relevance, and impartiality
Created by industry experts and meticulously reviewed
The highest standards in reporting and publishing
Strict editorial policy that focuses on accuracy, relevance, and impartiality
Morbi pretium leo et nisl aliquam mollis. Quisque arcu lorem, ultricies quis pellentesque nec, ullamcorper eu odio.
A new XRP price forecast has emerged, offering insights into the cryptocurrency’s next bearish move. A crypto analyst who previously predicted XRP‘s crash below $2 has provided a more comprehensive outlook, outlining key support and resistance areas that will determine XRP’s next target.
According to TradingView crypto analyst, ‘MMBTrader,’ the XRP price is set to dump below the $2 threshold. As of writing, CoinMarketCap reports that XRP is trading at $2.2, reflecting a modest 3% increase in value in the last 24 hours.
XRP Price Projected To Crash To $1.5
Related Reading
The TradingView crypto expert has identified a Head and Shoulder pattern on the XRP daily chart, consisting of three peaks: left shoulder, head, and right shoulder. Typically, a classic Head and Shoulder pattern is considered one of the most common indicators of a potential price breakdown, with the price of a cryptocurrency expected to reverse from bullish to bearish.
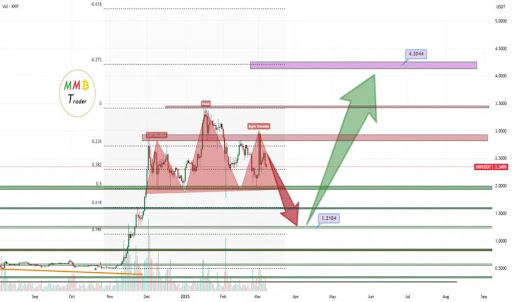
Looking at the price chart, a break below the pattern’s neckline around the $1.95 price point would confirm XRP’s bearish position. If the cryptocurrency fails to hold the $1.95 support level, a sharp drop, possibly up to 50%, is expected. This massive crash would effectively place the price around the $1.5 level or even as low as $1.2.
While he expects a possible crash to $1.5, MMBTrader also projects an alternative bullish scenario in which the XRP price initiates a strong rebound. The analyst revealed that if the cryptocurrency consolidates near $2 without breaking lower, then a bounce to new highs could follow.
Additionally, the TradingView expert believes that the asset could also experience a significant rally toward $5 after its projected 50% price crash. He highlights that if XRP can hold the support level near $1.5, then a strong reversal could occur, potentially triggering a bullish move between $4 and $4.5.
Whales Scoop Up $385 Million Amid Market Downtrend
While XRP experiences slow momentum due to the market’s recent decline, whales are seizing the opportunity to buy the dip, accumulating a significant amount of the token. According to crypto analyst Brett, an XRP whale has executed a large-scale transaction, buying over 167 million XRP, valued at $368.4 million, in a single purchase.
Related Reading
Brett revealed that this whale purchase was made as the market panicked over increasing volatility and price declines. Over the past few weeks, XRP has struggled to recover from bearish trends, joining the ranks of top cryptocurrencies like Bitcoin and Ethereum, which recorded a major price crash earlier in February.
CoinMarketCap’s data shows that the the altcoin’s price has fallen by 11.6% in just one week. This decline comes as the broader crypto market faces massive liquidations totaling hundreds of millions of dollars.
Featured image from Adobe Stock, chart from Tradingview.com
Source link


Reason to trust
![]()
Strict editorial policy that focuses on accuracy, relevance, and impartiality
Created by industry experts and meticulously reviewed
The highest standards in reporting and publishing
Strict editorial policy that focuses on accuracy, relevance, and impartiality
Morbi pretium leo et nisl aliquam mollis. Quisque arcu lorem, ultricies quis pellentesque nec, ullamcorper eu odio.
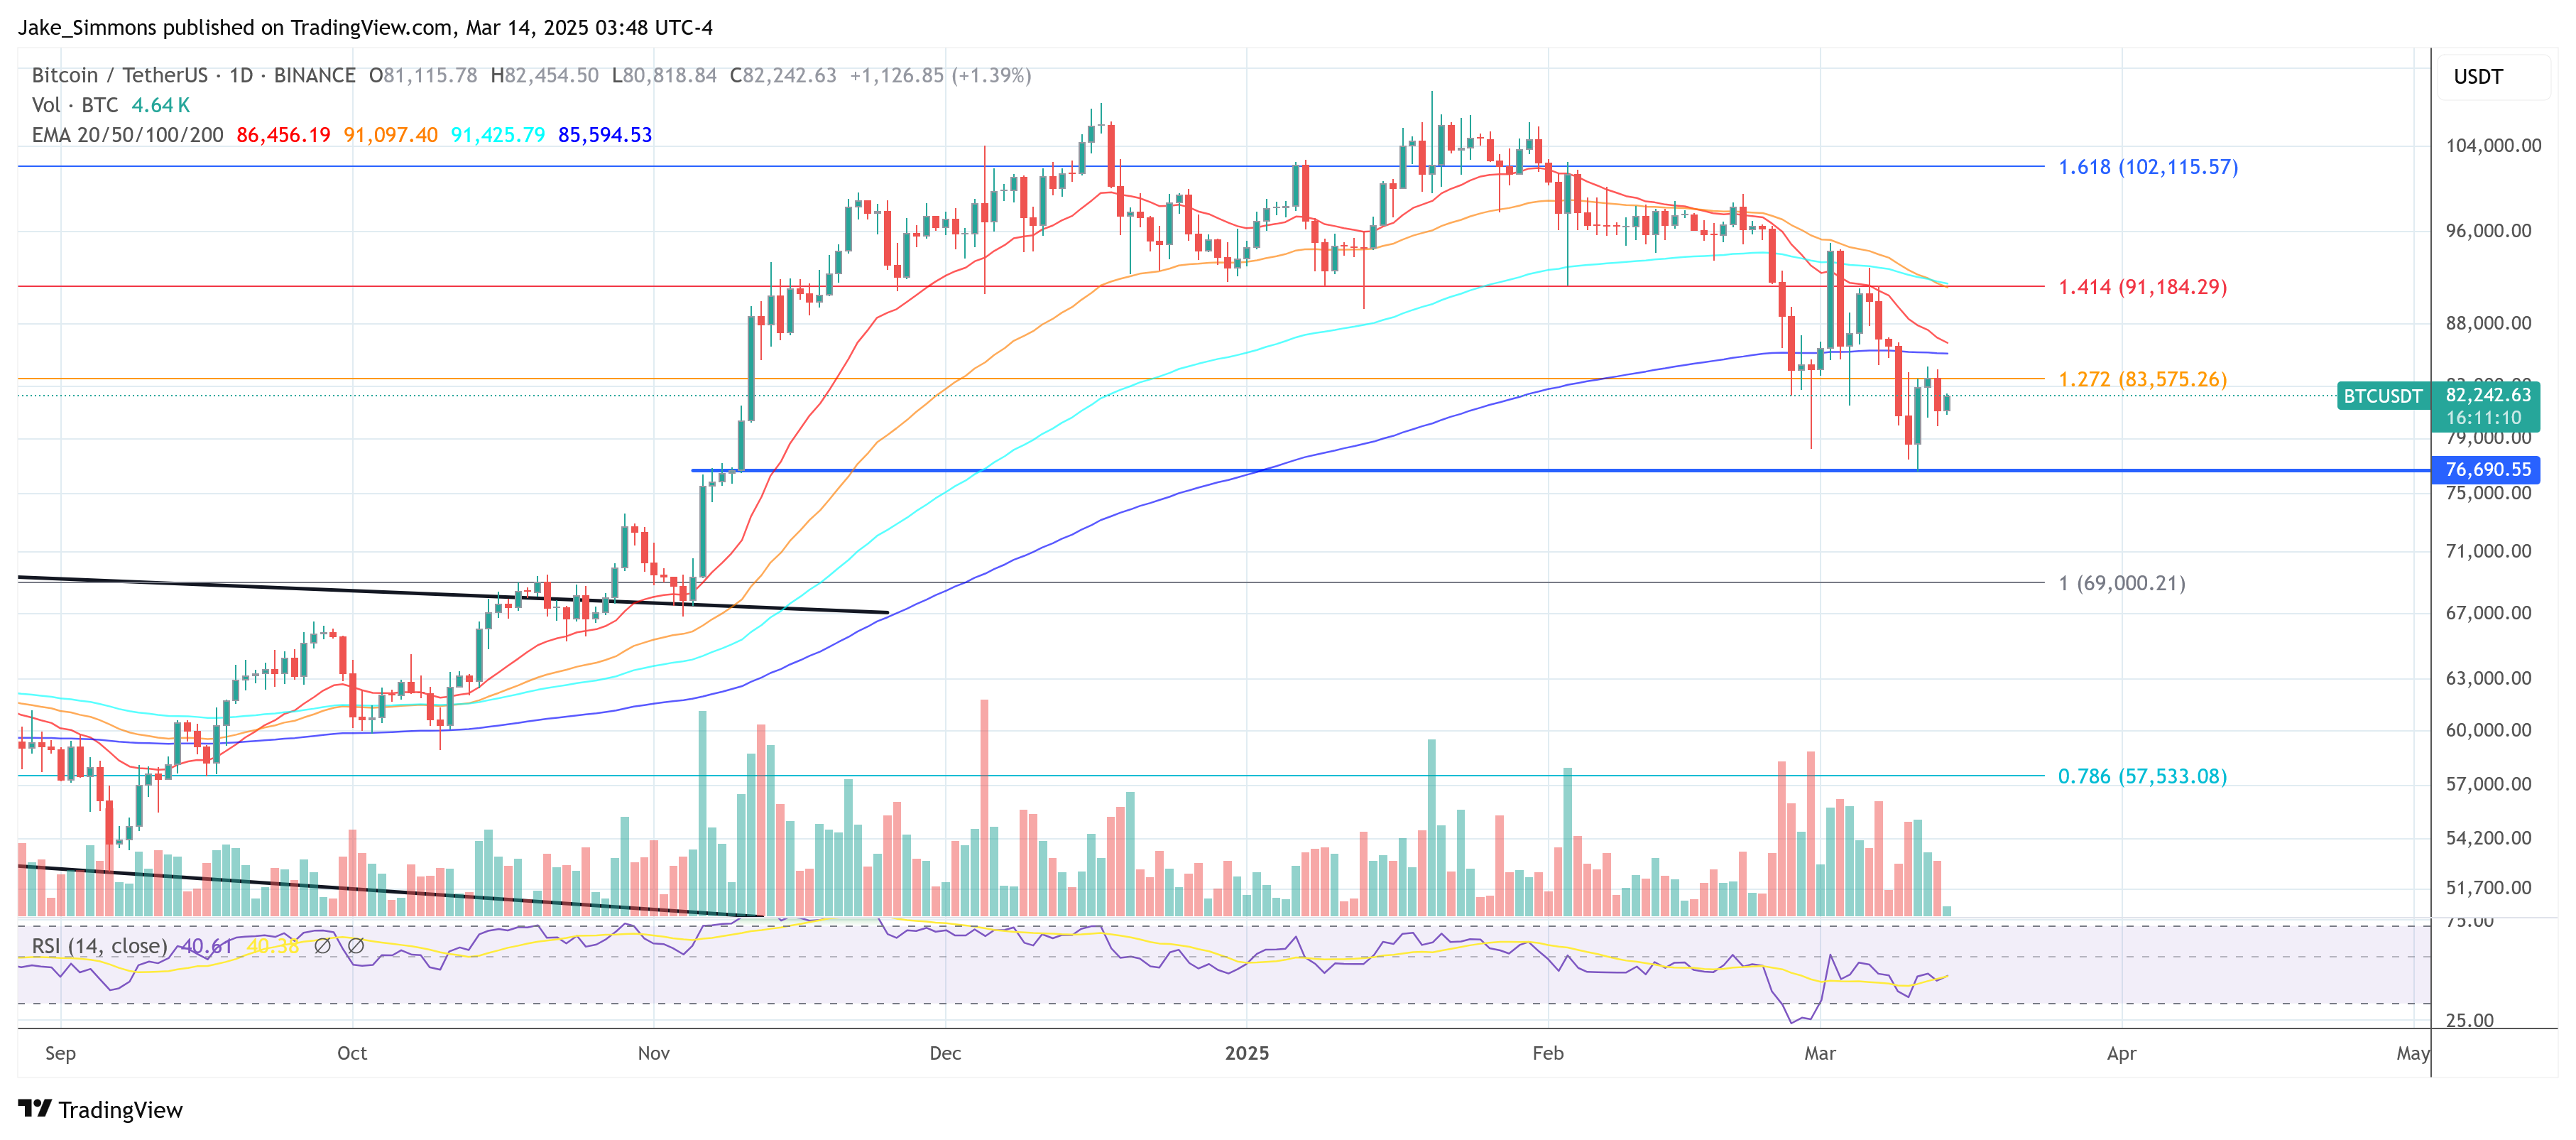
US President Trump’s outspoken acceptance of near-term economic hardship has placed risk assets—including Bitcoin (BTC) and the broader crypto market—under mounting pressure. According to a thread by The Kobeissi Letter on X, President Trump’s strategy revolves around tolerating significant “short term pain” in order to drive down inflation and facilitate the refinancing of over $9 trillion in US debt.
Will Crypto Survive Trump’s ‘Short-Term Pain’ Strategy?
The impact on cryptocurrencies has been immediate and pronounced. While US equities have shed an estimated $5 trillion in market value this year, digital assets have also suffered steep losses. Since President Trump’s inauguration on January 21, Bitcoin (BTC) has declined by approximately -23%, Ethereum (ETH) has tumbled by roughly -43% and the broader crypto market has experienced even more dramatic price drops.
Related Reading
Although high volatility is nothing new in crypto, the synchronized downturn suggests that crypto assets are not immune to macroeconomic forces. The Kobeissi Letter adds, “Based on our research, President Trump made this conclusion BEFORE inauguration. However, he began formally articulating it on March 6th. Below is the headline that destroyed investor confidence in 2025. President Trump is no longer the ‘stock market’s President’ (for now).”
The Kobeissi Letter points to March 9 as the date President Trump further confirmed his stance by noting that America is in a “period of transition” and that it will “take a little time,” implying a willingness to tolerate near-term market turbulence. During this period, Commerce Secretary Lutnick’s statement on March 6—“Stock market not driving outcomes for this admin”—was followed by Treasury Secretary Bessent’s remark, “Not concerned about a little volatility.”
Although The Kobeissi Letter’s analysis notes that the administration’s viewpoint solidified before inauguration, it cites President Trump’s urgent focus on the year 2025, when $9.2 trillion in US debt will either mature or need to be refinanced. The thread states, “First, as we have previously noted, the US is facing a massive refinancing task. In 2025, $9.2 TRILLION of US debt will either mature or need to be refinanced. The quickest way to LOWER rates ahead of this colossal refinancing would be a recession.”
Related Reading
Beyond debt concerns, The Kobeissi Letter also highlights the administration’s drive to reduce oil prices and the US trade deficit as part of the same economic calculation. Since President Trump took office, oil has fallen by over 20%. “Furthermore, a clearly defined part of President Trump’s strategy has been to LOWER oil prices. Oil prices are down 20%+ since Trump took office. This morning, Citigroup said oil prices falling to $53 would lower inflation to 2%. What would lower oil prices? A recession.”
Meanwhile, the administration’s extensive use of tariffs, which The Kobeissi Letter describes as “levying tariffs on almost ALL US trade partners,” is chipping away at GDP growth estimates, further hinting that a deliberate slowdown is in motion.
The Kobeissi Letter also notes, “On top of this, DOGE and Trump are attempting to cut TONS of government jobs. These are the same jobs that have accounted for much of the recent job ‘growth’ in the US. Government jobs have risen by 2 million over the last 4.5 years. Cutting these jobs will spur a recession.” DOGE leader Elon Musk appears resigned to short-term declines. Even after Tesla (TSLA) recorded its seventh-largest historical drop on March 10, Musk posted that “It will be fine long-term.”
For crypto traders and investors, the “short term pain” scenario by Trump is currently dictating the price action. The question, the analysts from The Kobeissi Letter posit, is whether this will lead to a more favorable economic landscape in the long run. “Is the ‘short term pain’ worth the ‘long term gain’ in President Trump’s economic strategy?”.
At press time, the BTC price remained under heavy downward pressure and traded at $82,000.
Featured image from Shutterstock, chart from TradingView.com
Source link
Yesterday evening, the Kentucky Senate unanimously passed a bill aimed at protecting Bitcoin self-custody rights and digital asset mining operations. With a decisive 37-0 vote, the legislation, titled AN ACT relating to blockchain digital assets (HB 701), now moves to the Governor’s desk for final approval.
NEW:
Kentucky Senate passes bill that will protect Bitcoin self custody rights with 0 votes against it.
The bill now heads to the Governors desk. pic.twitter.com/HPciWIgpZO
— Bitcoin Magazine (@BitcoinMagazine) March 14, 2025
Sponsored by Representatives Adam Bowling and T.J. Roberts, the bill affirms the right of individuals to self-custody digital assets through self-hosted wallets. Additionally, it prevents local zoning laws from discriminating against digital asset mining businesses, ensuring that Bitcoin miners can operate freely within the state.
The bill outlines several key provisions, including:
- Protection for Bitcoin self-custody: Individuals have the legal right to use and store digital assets in self-hosted wallets.
- Prohibition of discriminatory zoning laws: Local governments cannot impose zoning changes that unfairly target digital asset mining businesses.
- Exemptions from money transmitter licensing: Home Bitcoin miners and digital asset mining businesses are exempt from Kentucky’s money transmitter requirements.
- Clarification of securities laws: Digital asset mining and staking as a service are explicitly not classified as securities under Kentucky law.
After passing through the Kentucky House with a 91-0 vote on February 28, 2025, the bill moved swiftly through the Senate. The March 13 vote saw full bipartisan support, with 37 senators voting in favor, zero opposed, and one not voting.
The legislation now awaits the Governor’s signature, which would officially enshrine Bitcoin self-custody protections and digital asset mining rights into Kentucky law. If signed, Kentucky will become one of the more Bitcoin-friendly states in the country, setting a precedent for other states to follow.
Source link

Bitcoin (BTC) price has been consolidating within a roughly $5,500 range since March 9 as the $84,000 level represents stiff overhead resistance.
Data from Cointelegraph Markets Pro and Bitstamp shows BTC price oscillating between $78,599 and $84,000, as shown in the chart below.

BTC/USD daily chart. Source: Cointelegraph/TradingView
Key reasons why Bitcoin price remains flat today include:
Trump’s trade war tensions causing uncertainty in the market.
Weakening demand for Bitcoin and neutral funding rates.
BTC price remains pinned below the 200-day SMA.
Broader economic uncertainty, weakening demand
Bitcoin’s price stagnation is partially due to the broader economic and geopolitical factors that are currently at play.
What to know:
Trump’s new policies, such as his proposed trade tariffs on Mexico and Canada, have unnerved the market.
Investors, wary of inflation concerns and a potential tariff war, are avoiding risk assets like Bitcoin.
As Cointelegraph recently reported, Bitcoin’s rally post-Trump’s November election has lost steam amid a weakening global economy.
This has resulted in weaker demand for Bitcoin, according to Glassnode.
For instance, the cost basis of 1w–1m short-term holders flattened out above that of the longer-term holders (1m–3m) in Q1, “marking an early sign of weakening demand in the immediate term.”
Related: Bitcoin price drops 2% as falling inflation boosts US trade war fears
Bitcoin’s drop below the $95,000 level saw the 1w–1m cost basis slide below the 1m–3m cost basis, “confirming a transition into net capital outflows.”
Glassnode noted:
“This reversal indicates that macro uncertainty has spooked demand, reducing new inflows… and suggests that new buyers are now hesitant to absorb sell-side pressure, reinforcing the shift from post-ATH euphoria into a more cautious market environment.”

Bitcoin STH capital flow. Source: Glassnode
Until the current trend changes due to macroeconomic tailwinds, such as Fed rate cuts, Bitcoin could struggle to break out of the current range, leaving it vulnerable to pullbacks toward $70,000.
Another clear signal of Bitcoin’s stagnation is in the perpetual futures funding rates. BTC funding rates, which reflect the cost of holding long or short positions in crypto futures, are hovering close to 0%, indicating increasing indecisiveness among traders.

Bitcoin perpetual futures funding rates across all exchanges. Source: Glassnode
Without speculative fuel, Bitcoin is struggling to move in either direction, leaving its price stuck in a tight range as traders wait for the next catalyst.
Bitcoin price faces stiff resistance on the upside
Bitcoin also trades below key resistance areas, as shown in the chart below:
On March 9, BTC fell below the 200-day simple moving average (SMA) at $83,736.
This trendline has stifled the latest efforts for a sustained recovery.

BTC/USD daily chart. Source: Cointelegraph/TradingView
Popular crypto analyst Daan Crypto Trades says that the 200-day SMA at around $83,700 and the 200-day EMA at $86,000 are key levels as they are “solid indicators of the mid/long term trend and overall strength of the market.”
In other words, failure to produce a decisive close above the 200-day SMA and flipping it into a new support level could lead to a longer consolidation period for Bitcoin price.
This article does not contain investment advice or recommendations. Every investment and trading move involves risk, and readers should conduct their own research when making a decision.
Arthur Hayes, Murad’s Prediction For Meme Coins, AI & DeFi Coins For 2025 Expert Sees Bitcoin Dipping To $50K While Bullish Signs Persist Aptos Leverages Chainlink To Enhance Scalability and Data Access Bitcoin Could Rally to $80,000 on the Eve of US Elections Institutional Investors Go All In on Crypto as 57% Plan to Boost Allocations as Bull Run Heats Up, Sygnum Survey Reveals Sonic Now ‘Golden Standard’ of Layer-2s After Scaling Transactions to 16,000+ per Second, Says Andre Cronje Crypto’s Big Trump Gamble Is Risky Ripple-SEC Case Ends, But These 3 Rivals Could Jump 500x
Source link 
Wales Man Loses Appeal to Dig Out Hard Drive Holding $676 Million in Bitcoin

VanEck Files S-1 for Avalanche ETF With US SEC

Deep Dive on the Trump Reserve Token Whose Blockchain Ignores TVL

Is Trump intentionally crashing the market?
![]()
Crypto Faces Uncertainty As Trump’s ‘Short-Term Pain’ Unfolds

Kentucky Senate Passes Bill Protecting Bitcoin Self-Custody Rights

Crypto Fintech Giant MoonPay Continues Acquisition Spree With Purchase of Stablecoin Infrastructure Platform
![]()
Solana price slowly forms a rare pattern: can SOL surge 270%?

Ethereum Flat as Devs Prepare for Hooli Testnet Ahead of Pectra Upgrade

Dogecoin Price Nears Key Support as Analysts Predict Rally To $20
![]()
ZKsync Sunsets Liquidity Rewards Program, Citing Bearish Market Conditions

Why is Bitcoin price stuck?

Bitcoin Needs Weekly Close Above This Level To Confirm Market Bottom, Analyst Says

California Legislators Endorse Bitcoiner For $500 Billion Pension Board

‘There’s Every Reason To Be Cautious’: Trader Issues Alert on Bitcoin Amid Major Resistance – Here’s His Outlook

Arthur Hayes, Murad’s Prediction For Meme Coins, AI & DeFi Coins For 2025

Expert Sees Bitcoin Dipping To $50K While Bullish Signs Persist

Aptos Leverages Chainlink To Enhance Scalability and Data Access

Bitcoin Could Rally to $80,000 on the Eve of US Elections

Institutional Investors Go All In on Crypto as 57% Plan to Boost Allocations as Bull Run Heats Up, Sygnum Survey Reveals

Sonic Now ‘Golden Standard’ of Layer-2s After Scaling Transactions to 16,000+ per Second, Says Andre Cronje

Crypto’s Big Trump Gamble Is Risky

Ripple-SEC Case Ends, But These 3 Rivals Could Jump 500x

A16z-backed Espresso announces mainnet launch of core product

Has The Bitcoin Price Already Peaked?

Xmas Altcoin Rally Insights by BNM Agent I

Blockchain groups challenge new broker reporting rule

Trump’s Coin Is About As Revolutionary As OneCoin

Ripple Vs. SEC, Shiba Inu, US Elections Steal Spotlight

Is $200,000 a Realistic Bitcoin Price Target for This Cycle?


