
Altcoin
Dogecoin Price Primed for a 320% Rally—Can DOGE Deliver?
Reason to trust
![]()
Strict editorial policy that focuses on accuracy, relevance, and impartiality
Created by industry experts and meticulously reviewed
The highest standards in reporting and publishing
Strict editorial policy that focuses on accuracy, relevance, and impartiality
Morbi pretium leo et nisl aliquam mollis. Quisque arcu lorem, ultricies quis pellentesque nec, ullamcorper eu odio.
A popular meme coin has shown signs of recovery as it entered bullish territory with analysts showing optimism for the future of the crypto in the upcoming months. Analysts predict that Dogecoin’s current momentum will push it to a possible 318% rally, giving their insights on what is driving this move upward.
Related Reading
Price Rally Around The Corner?
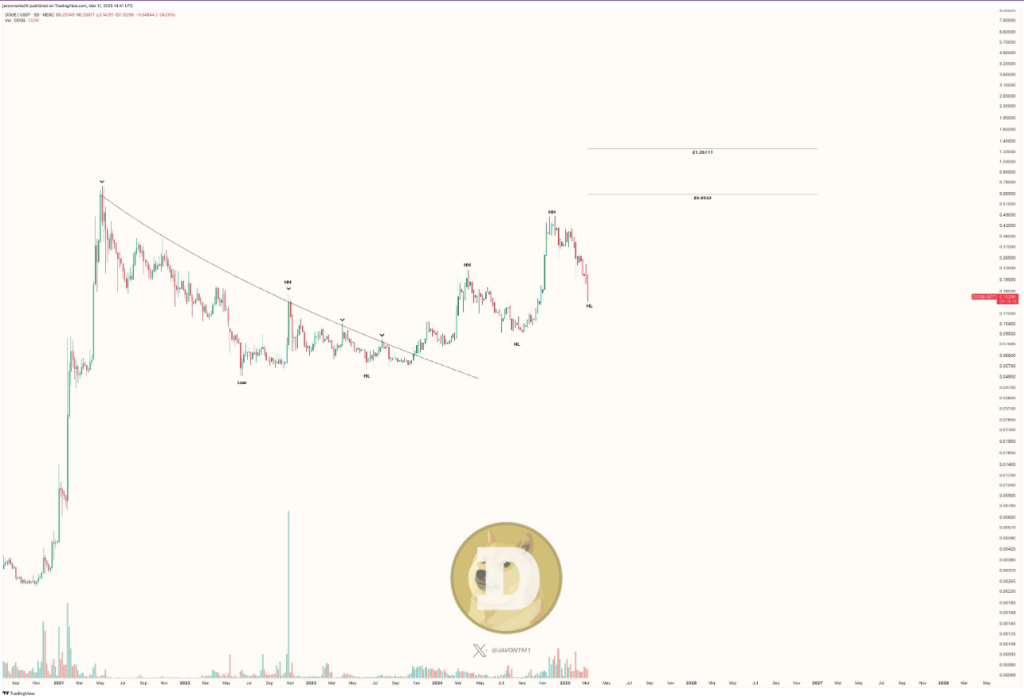
An analyst said in a post that Dogecoin could be heading for a 318% increase, which is possible since the breakout experienced by the meme coin aligns with its historical price movements.
“With the breakout target at $0.6533, another +318% increase to reach it can be in the works and prices may only be preparing here to do so,” JavonTM1 said.
Prices of $DOGE (Dogecoin) are still up nearly +129% since breaking out of the pictured resisting trend and with prices still broken out and in a position to confirm another set of Higher Lows, even more upside can be coming!
With the breakout target at $0.6533, another +318%… https://t.co/nhmMIkJgqv pic.twitter.com/Qum16794Li
— JAVON
MARKS (@JavonTM1) March 11, 2025
JavonTM1 made the prediction after the meme coin soared by 129% following a breach of a critical resistance trendline. “Prices of $DOGE (Dogecoin) are still up nearly +129% since breaking out of the pictured resisting trend, and with prices still broken out and, in a position to confirm another set of Higher Lows, even more upside can be coming!”
The Bullish Impulse Wave
Analysts used the Elliott Wave Theory to explain the future of DOGE. According to the charts, Dogecoin’s price might be “in the middle of a bullish impulse wave.” They argued that the coin’s volume spikes showed that there was an increase in market participation, supporting the possibility of sustained upward movement.
Meanwhile, a curved trendline on the chart indicates that the meme coin has shifted from a prolonged correction phase into a breakout phase.
Last month, JavonTM1 noted that Dogecoin, hitting $0.6533, is just around the corner. “It’s only a matter of time here with such a major breakout response and climb thus far but a move above is looking more and more likely!”
Potential Rebound
Another analyst believes that DOGE is heading towards a potential price rebound, reinforcing the coin’s bullish outlook.
Ali Martinez used the TD Sequential indicator to explain the likely surge, saying that the indicator has flashed a buy signal on the daily chart, a cue used by investors to identify trend reversals.
Martinez added that this usually happens after a bearish phase, indicating that the meme coin could be moving toward the recovery phase.
Related Reading
Data showed that DOGE remains in a strong position following the price breakout, indicating possible further gains.
At press time, Dogecoin is traded at $0.1720 per coin with a market cap of more than $25 billion.
Featured image from Pexels, chart from TradingView
Source link


Reason to trust
![]()
Strict editorial policy that focuses on accuracy, relevance, and impartiality
Created by industry experts and meticulously reviewed
The highest standards in reporting and publishing
Strict editorial policy that focuses on accuracy, relevance, and impartiality
Morbi pretium leo et nisl aliquam mollis. Quisque arcu lorem, ultricies quis pellentesque nec, ullamcorper eu odio.
Ripple’s XRP, one of the top-performing cryptos last year, is trading between $2.15 and $2.30. The token’s current price is a far cry from its 52-week high of $3.38 last January 17th, which was spurred by the industry’s excitement over US President Donald Trump’s reelection.
Related Reading
Although XRP joins the downtrend of the broader crypto market, a few commentators and analysts expect that Ripple is due for a major rally. According to crypto analyst Egrag Crypto, Ripple’s XRP is set for another price run after it compares the asset’s current Elliot Wave structure with its 2017 fractals.
XRP Continues To Weather The Storm
Egrag Crypto’s latest price analysis and projection for XRP come as the altcoin and the broader crypto market slump. The Ripple’s coin is holding steady above the critical $2 price support, which suggests it follows the broad five-wave Elliott Wave chart. Traditionally, assets replicating the Elliott Wave structure often incur significant price action.
#XRP = Thread (1/7) #XRP: Double Digits This Cycle, Triple Digits Next!
The thread below about #XRP was shared in the Subscribers section on February 12, 2025.
We’ve built together the Full Elliot Wave Count to assess our next Targets:
Take an in-depth look at it!
… pic.twitter.com/NKv00Y5MZD
— EGRAG CRYPTO (@egragcrypto) March 12, 2025


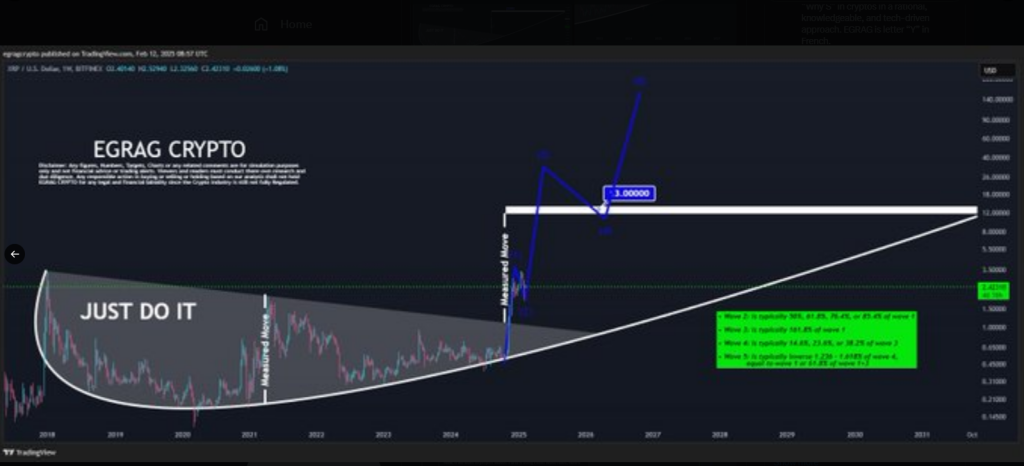
Based on Egrag’s assessment, XRP is currently in the second wave of the Elliot Wave structure, which is traditionally defined by high price volatility and corrections.
Traders And Investors Must Watch Out For The Larger Wave Structure
In a Twitter/X post, Egrag explained that XRP is in its corrective wave two and is primed for a price run to double digits or even over $100.
The analysts elaborated that a Wave 2 often retraces a part of Wave 1, usually matching 50%, 76% or even 85.4% of the initial movement. Ripple’s XRP, he shares, is solidifying its hold in the correction phase.
The asset faces bearish pressure, and the market can expect a double bottom soon before it moves into its Wave 3. EGRAG warns that Wave 3 is the most aggressive part of the cycle, with more volatility.
Can XRP Hit $100 Or More?
Previously, XRP’s Wave 1 pattern submitted a huge 733% increase in price. And by using the Elliot Wave extension formula, the popular analyst projects that XRP’s Wave 3 can extend by 1.618x the gain of the first wave. Using this calculation, Egrag offers a potential surge of 1,185x, translating to XRP’s price range between $22 to $24.
Once XRP hits the peak of Wave 3, the fourth wave and a price correction follows. For this wage, the retracement level ranges between 14% to 38.2% of Wave 3. If this happens, Egrag predicts that XRP’s price can drop to $8.
Related Reading
Wave 5 of the Elliot Wave follows, where price can be predicted using three methods. First, if XRP’s price grows between 1.236% and 1.618%, the asset’s price can hit between $32 and $48. Second, if Wave 5 replicates Wave 1, the price can be between $60 and $70. Third, if there’s a 61.8% extension of the movements of Waves 1 and 3, then there’s a chance that XRP’s price can hit $100.
Featured image from Medium, chart from TradingView
Source link

Reason to trust
![]()
Strict editorial policy that focuses on accuracy, relevance, and impartiality
Created by industry experts and meticulously reviewed
The highest standards in reporting and publishing
Strict editorial policy that focuses on accuracy, relevance, and impartiality
Morbi pretium leo et nisl aliquam mollis. Quisque arcu lorem, ultricies quis pellentesque nec, ullamcorper eu odio.
Crypto analyst ElmoX has asserted that the XRP price is still bullish despite the recent crypto market crash. His analysis revealed that XRP is set to face major resistance at $2.9, although he is confident that the crypto will eventually break this resistance and rally to as high as $20.
XRP Price Faces Resistance At $2.9 But Could Still Rally To $20
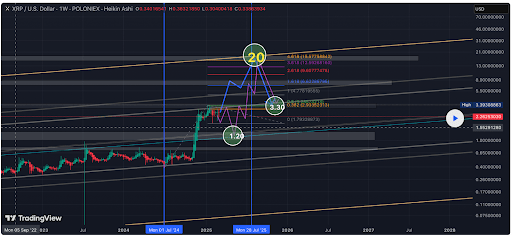
In a TradingView post, ElmoX outlined two scenarios for the XRP price as it eyes a rally to $20, although he noted that the crypto will retest the major resistance at around $2.92 either way, on its way to a new all-time high (ATH). For the first scenario, the analyst stated that XRP would break this resistance and then skyrocket to $20.
Related Reading
Meanwhile, in the second scenario, ElmoX stated that the XRP price could face another rejection, sending it below the $1.5 level before it witnesses a bullish reversal and rallies to a new ATH. The analyst revealed that he is betting on this second scenario since there is usually a swift crash before an impulsive move to the upside.
ElmoX remarked that the XRP price has barely corrected, which is also why he believes there could still be a massive crash before a rally to a new ATH. Meanwhile, the analyst didn’t provide an exact timing for the potential price correction and subsequent rally to a new ATH and the $20 price target.
Instead, he simply told market participants to be patient. He further warned that the XRP price might sit in price discovery until at least mid-July. His accompanying chart showed that XRP will first drop to as low as $1.20 before it witnesses an impulsive move to as high as $20.
The Altcoin Records A Bullish Close
In an X post, crypto analyst CasiTrades noted that although the XRP price briefly broke below the $2 trendline, the candle closed back above this trendline, reclaiming the consolidation range. She remarked that this is exactly what bulls needed to see. However, the analyst added that a confirmation is needed with XRP holding the range between $2 and $2.03 as support.
Related Reading
CasiTrades stated that a breakdown from consolidation usually leads to further downsides, but the XRP price managed to recover the level quickly, showing that buyers are stepping in. She also noted that the bullish divergence is still holding up to the 1-hour RSI even after the dip with selling pressure weakening, which suggests a shift in momentum is possible.
If the XRP price holds the support between $2 and $2.03, CasiTrades predicts that the crypto could bounce and rally toward $2.25 and $2.70. On the other hand, if XRP loses this level, she stated that the next major support sits at $1.90 which is the 0.5 Fibonacci retracement level. Meanwhile, there is also the possibility that XRP could drop to the 0.618 Fib retracement level at $1.54.
At the time of writing, the XRP price is trading at around $2.10, down over 4% in the last 24 hours, according to data from CoinMarketCap.
Featured image from Adobe Stock, chart from Tradingview.com
Source link

Reason to trust
![]()
Strict editorial policy that focuses on accuracy, relevance, and impartiality
Created by industry experts and meticulously reviewed
The highest standards in reporting and publishing
Strict editorial policy that focuses on accuracy, relevance, and impartiality
Morbi pretium leo et nisl aliquam mollis. Quisque arcu lorem, ultricies quis pellentesque nec, ullamcorper eu odio.
Ethereum has struggled to gain momentum, remaining stuck below critical resistance for over a year. Despite multiple attempts, the second-largest cryptocurrency by market capitalization has been unable to break through key technical levels since the beginning of this year.
Related Reading
Ethereum’s price action over the past two weeks has shown more weakness. An interesting analysis from analyst Tony “The Bull” Severino shows that the cryptocurrency recently failed to break above a resistance indicator and is now at risk of more catastrophic price drops.
Ethereum Fails To Breach Long-Term Resistance
Tony “The Bull” Severino, in a technical analysis shared on social media platform X, highlighted Ethereum’s persistent failure to overcome major resistance levels. He pointed out that Ethereum has been unable to tag the quarterly (three-month) Parabolic SAR despite more than a year of attempts. This indicator, often used to determine the direction of an asset’s trend, shows that Ethereum is locked in a prolonged struggle against resistance on a larger downtrend.
“This feels like it sends a message — resistance won’t be broken,” the analyst said.
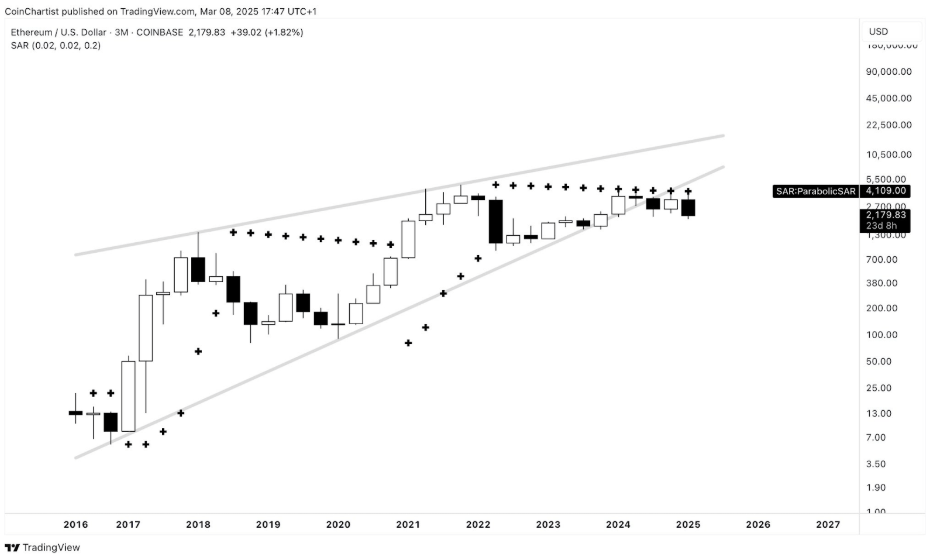
Image From X: Tony “The Bull” Severino
Adding to the failure to break resistance, Tony Severino also noted in another analysis that Ethereum has repeatedly faced rejection from the quarterly (3M) SuperTrend dynamic resistance, further solidifying the case that buyers have been unable to regain control.
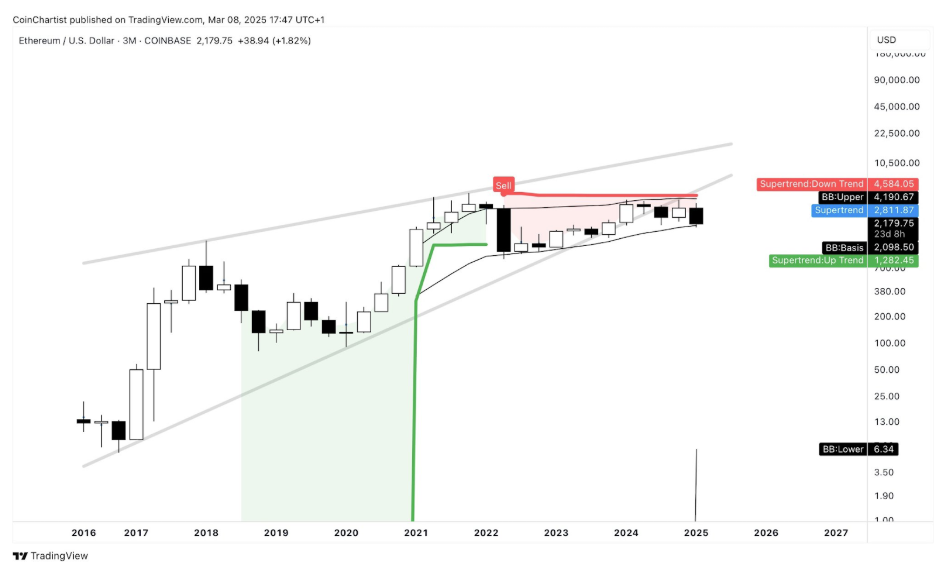
Image From X: Tony “The Bull” Severino
A Monthly Close Below $2,100 Could Be Catastrophic
Ethereum’s inability to sustain key price levels has been a dominant theme in the past six months. Interestingly, this inability was shown further in the past two weeks. After failing to hold above $2,800, the cryptocurrency has seen a steady drop, losing multiple support zones along the way.
Currently, Ethereum is trading below $2,200, edging dangerously close to breaking below the crucial $2,100 threshold. A drop beneath this level is particularly concerning, not just because it signifies the loss of yet another psychological support but because technical indicators suggest that a monthly close below $2,100 could have severe consequences.
One of the most significant warning signs comes from the quarterly Bollinger Bands indicator, which has tracked Ethereum’s price action since February 2022. According to this indicator, Ethereum has remained within a defined range, with the upper Bollinger Band currently positioned at $4,190 and the lower band at $2,098. The worrying part is that a monthly close below $2,100 would effectively translate to breaking beneath the lower Bollinger Band and removing a long-standing support level.
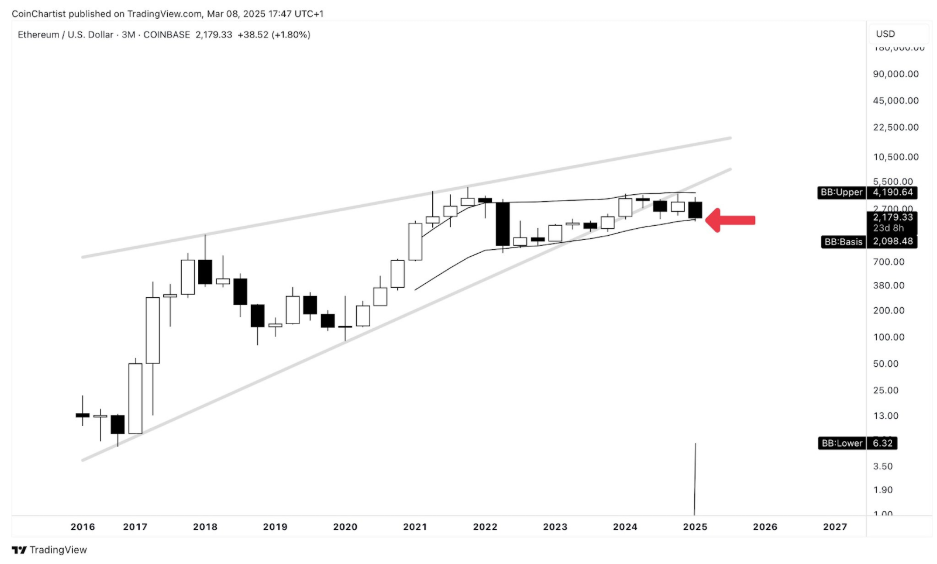
Image From X: Tony “The Bull” Severino
Related Reading
At the time of writing, Ethereum is trading at $2,178, having gained 2.2% in the past 24 hours after starting the day at $2,120. Ethereum’s sentiment is now at its lowest level this year. The next few weeks will be crucial to see if Ethereum can reclaim lost ground and prevent a monthly close below $2,100.
Featured image from Tech Magazine, chart from TradingView
Source link

Wales Man Loses Appeal to Dig Out Hard Drive Holding $676 Million in Bitcoin

VanEck Files S-1 for Avalanche ETF With US SEC

Deep Dive on the Trump Reserve Token Whose Blockchain Ignores TVL

Is Trump intentionally crashing the market?
Crypto Faces Uncertainty As Trump’s ‘Short-Term Pain’ Unfolds

Kentucky Senate Passes Bill Protecting Bitcoin Self-Custody Rights

Crypto Fintech Giant MoonPay Continues Acquisition Spree With Purchase of Stablecoin Infrastructure Platform
Solana price slowly forms a rare pattern: can SOL surge 270%?

Ethereum Flat as Devs Prepare for Hooli Testnet Ahead of Pectra Upgrade

Dogecoin Price Nears Key Support as Analysts Predict Rally To $20
ZKsync Sunsets Liquidity Rewards Program, Citing Bearish Market Conditions

Why is Bitcoin price stuck?

Bitcoin Needs Weekly Close Above This Level To Confirm Market Bottom, Analyst Says

California Legislators Endorse Bitcoiner For $500 Billion Pension Board

‘There’s Every Reason To Be Cautious’: Trader Issues Alert on Bitcoin Amid Major Resistance – Here’s His Outlook


 24/7 Cryptocurrency News4 months ago
Arthur Hayes, Murad’s Prediction For Meme Coins, AI & DeFi Coins For 2025

 Bitcoin2 months ago
Expert Sees Bitcoin Dipping To $50K While Bullish Signs Persist

 24/7 Cryptocurrency News2 months ago
Aptos Leverages Chainlink To Enhance Scalability and Data Access

 Bitcoin4 months ago
Bitcoin Could Rally to $80,000 on the Eve of US Elections

 Bitcoin4 months ago
Institutional Investors Go All In on Crypto as 57% Plan to Boost Allocations as Bull Run Heats Up, Sygnum Survey Reveals

 Altcoins1 month ago
Sonic Now ‘Golden Standard’ of Layer-2s After Scaling Transactions to 16,000+ per Second, Says Andre Cronje

 Opinion4 months ago
Crypto’s Big Trump Gamble Is Risky

 Price analysis4 months ago
Ripple-SEC Case Ends, But These 3 Rivals Could Jump 500x
