
ETH
‘Welcome to Pain’ – Analyst Benjamin Cowen Says Ethereum Mirroring 2019 Market Cycle’s Playbook

A popular crypto analyst thinks Ethereum (ETH) will have to endure some “pain” before rebounding.
In a new YouTube video, Benjamin Cowen tells his 886,000 subscribers that there probably needs to be a change in monetary policy in order for ETH’s chart against Bitcoin (BTC) to bottom.
“But in order to have a change in monetary policy, you have to have pain. Welcome to the pain. This is the pain that you ultimately need. Remember last cycle [in 2019], ETH/Bitcoin bottomed after ETH/USD broke support.”
Cowen notes that ETH fell below its support level against the US dollar in 2019 right before the Federal Reserve ended quantitative tightening.
The analyst says that everything that happened in the previous cycle is “basically happening this cycle, it’s just taking place on a longer timeframe.” Cowen also notes that most of the price points of the current cycle are roughly 10x what they were in the 2019 market.
“The reason why people are having a hard time navigating this cycle and why it feels so different is because monetary policy never changed this cycle. In the last cycle, we saw a change in monetary policy in the pre-halving year. We’re now in the post-halving year and we still haven’t seen a change to the quantitative tightening. We’ve seen them taper it a little bit. They’ve slowed it down, but they’ve never actually stopped it.”
ETH is trading at $1,907 at time of writing. The second-ranked crypto asset by market cap is down more than 1% in the past 24 hours.
Don’t Miss a Beat – Subscribe to get email alerts delivered directly to your inbox
Check Price Action
Follow us on X, Facebook and Telegram
Surf The Daily Hodl Mix
 

Disclaimer: Opinions expressed at The Daily Hodl are not investment advice. Investors should do their due diligence before making any high-risk investments in Bitcoin, cryptocurrency or digital assets. Please be advised that your transfers and trades are at your own risk, and any losses you may incur are your responsibility. The Daily Hodl does not recommend the buying or selling of any cryptocurrencies or digital assets, nor is The Daily Hodl an investment advisor. Please note that The Daily Hodl participates in affiliate marketing.
Generated Image: Midjourney
Source link


Bitcoin
Bitcoin Ready To Rally After Hitting Same ‘Extreme Fear’ Levels of COVID Crash and 2022 Bear Market: Trader

A widely followed crypto analyst says that one metric suggests Bitcoin (BTC) is gearing up for a massive breakout.
In a new strategy session, pseudonymous crypto trader Inmortal tells his 230,900 followers on the social media platform X that the Crypto Fear and Greed Index is flashing bullish for digital assets as it has reached “extreme fear,” a level seen during historical market collapses.
The Crypto Fear and Greed Index is a metric that gauges the fear or greed levels in the market with a reading of extreme fear indicating oversold conditions and a reading of extreme greed suggesting overbought conditions.
“Fear is at same levels we saw during Covid-19 crash and 2022 bottom. All of this while US announced a Bitcoin reserve.”
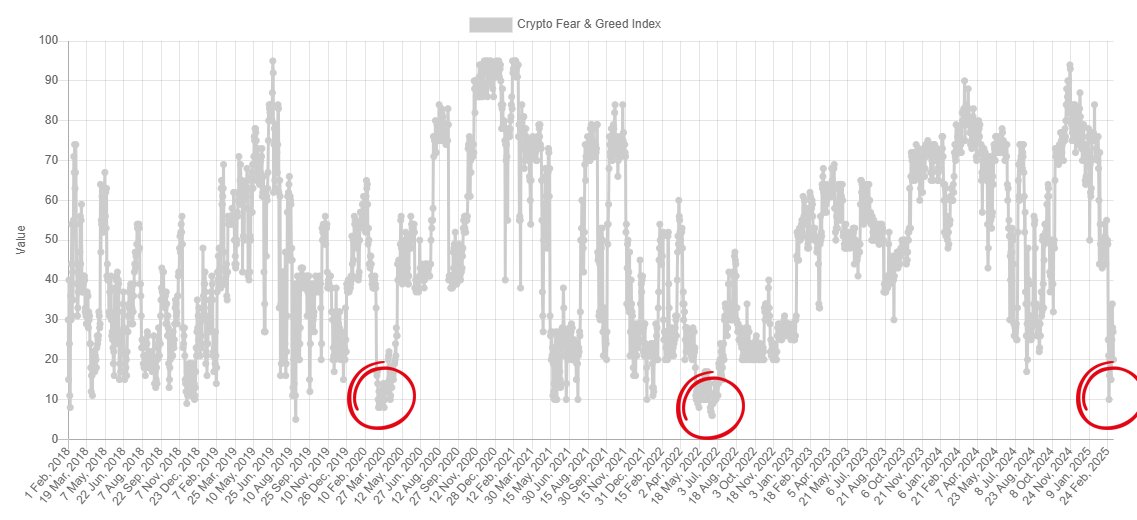
He also says that based on historic precedence market sentiment may remain in “extreme fear” anywhere from a month-and-a-half to about five months.
“Last cycle we visited extreme fear three times, and these periods lasted between 50 and 160 days.”

The analyst believes Bitcoin is repeating a similar pattern from 2024, when BTC retested a support level that erased gains from a bullish run before taking off to print new all-time highs.
“We doing this again.”
Lastly, the analyst says Ethereum (ETH) may be on the verge of a massive breakout similar to what Bitcoin did in 2020.
“I should accept that it’s all over, as others have already done. I’m not saying it will happen, but if the bull run is not finished, we should see something similar to this.”
Bitcoin is trading for $82,874 at time of writing, flat on the day. Meanwhile, ETH is trading for $1,881 at time of writing, down 3.5% in the last 24 hours.
Don’t Miss a Beat – Subscribe to get email alerts delivered directly to your inbox
Check Price Action
Follow us on X, Facebook and Telegram
Surf The Daily Hodl Mix
 
Disclaimer: Opinions expressed at The Daily Hodl are not investment advice. Investors should do their due diligence before making any high-risk investments in Bitcoin, cryptocurrency or digital assets. Please be advised that your transfers and trades are at your own risk, and any losses you may incur are your responsibility. The Daily Hodl does not recommend the buying or selling of any cryptocurrencies or digital assets, nor is The Daily Hodl an investment advisor. Please note that The Daily Hodl participates in affiliate marketing.
Generated Image: Midjourney
Source link

Reason to trust
![]()
Strict editorial policy that focuses on accuracy, relevance, and impartiality
Created by industry experts and meticulously reviewed
The highest standards in reporting and publishing
Strict editorial policy that focuses on accuracy, relevance, and impartiality
Morbi pretium leo et nisl aliquam mollis. Quisque arcu lorem, ultricies quis pellentesque nec, ullamcorper eu odio.
Ethereum has struggled to gain momentum, remaining stuck below critical resistance for over a year. Despite multiple attempts, the second-largest cryptocurrency by market capitalization has been unable to break through key technical levels since the beginning of this year.
Related Reading
Ethereum’s price action over the past two weeks has shown more weakness. An interesting analysis from analyst Tony “The Bull” Severino shows that the cryptocurrency recently failed to break above a resistance indicator and is now at risk of more catastrophic price drops.
Ethereum Fails To Breach Long-Term Resistance
Tony “The Bull” Severino, in a technical analysis shared on social media platform X, highlighted Ethereum’s persistent failure to overcome major resistance levels. He pointed out that Ethereum has been unable to tag the quarterly (three-month) Parabolic SAR despite more than a year of attempts. This indicator, often used to determine the direction of an asset’s trend, shows that Ethereum is locked in a prolonged struggle against resistance on a larger downtrend.
“This feels like it sends a message — resistance won’t be broken,” the analyst said.
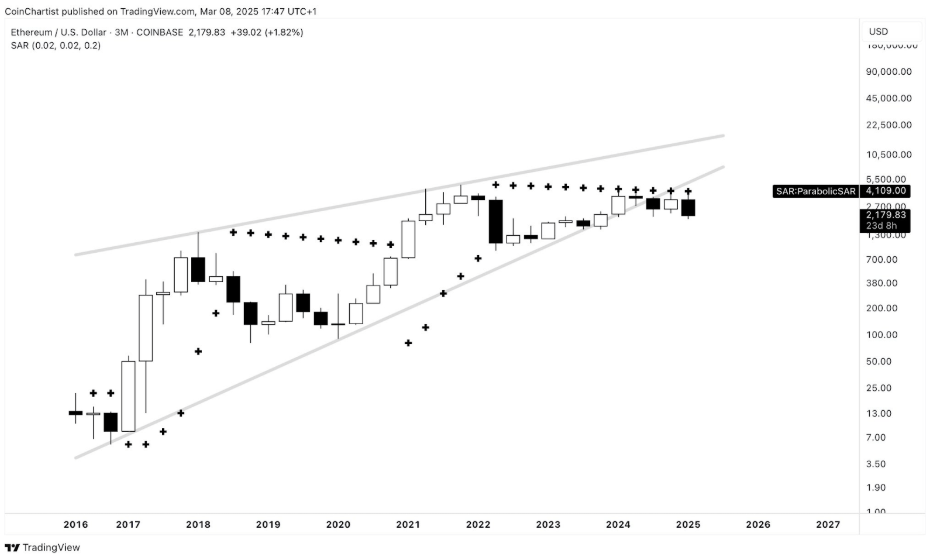
Image From X: Tony “The Bull” Severino
Adding to the failure to break resistance, Tony Severino also noted in another analysis that Ethereum has repeatedly faced rejection from the quarterly (3M) SuperTrend dynamic resistance, further solidifying the case that buyers have been unable to regain control.
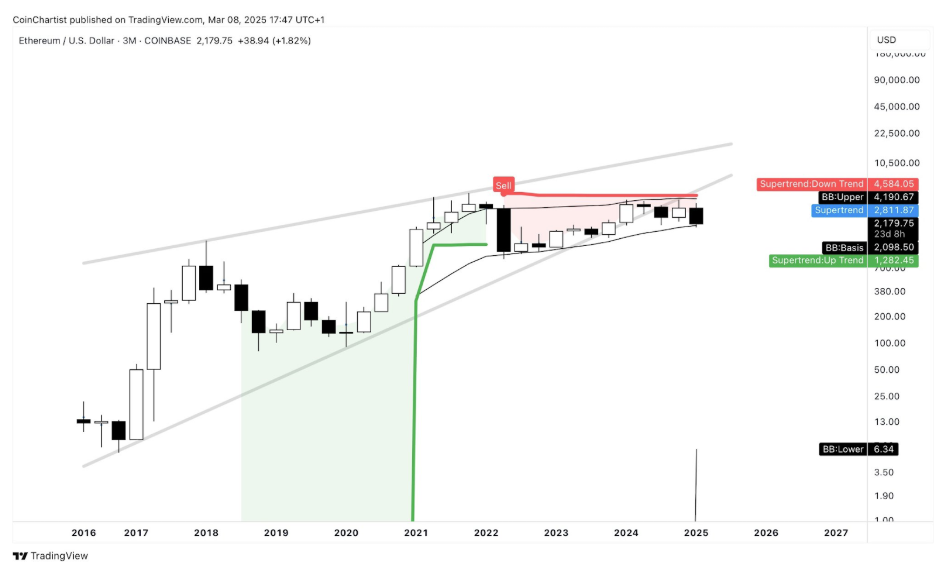
Image From X: Tony “The Bull” Severino
A Monthly Close Below $2,100 Could Be Catastrophic
Ethereum’s inability to sustain key price levels has been a dominant theme in the past six months. Interestingly, this inability was shown further in the past two weeks. After failing to hold above $2,800, the cryptocurrency has seen a steady drop, losing multiple support zones along the way.
Currently, Ethereum is trading below $2,200, edging dangerously close to breaking below the crucial $2,100 threshold. A drop beneath this level is particularly concerning, not just because it signifies the loss of yet another psychological support but because technical indicators suggest that a monthly close below $2,100 could have severe consequences.
One of the most significant warning signs comes from the quarterly Bollinger Bands indicator, which has tracked Ethereum’s price action since February 2022. According to this indicator, Ethereum has remained within a defined range, with the upper Bollinger Band currently positioned at $4,190 and the lower band at $2,098. The worrying part is that a monthly close below $2,100 would effectively translate to breaking beneath the lower Bollinger Band and removing a long-standing support level.
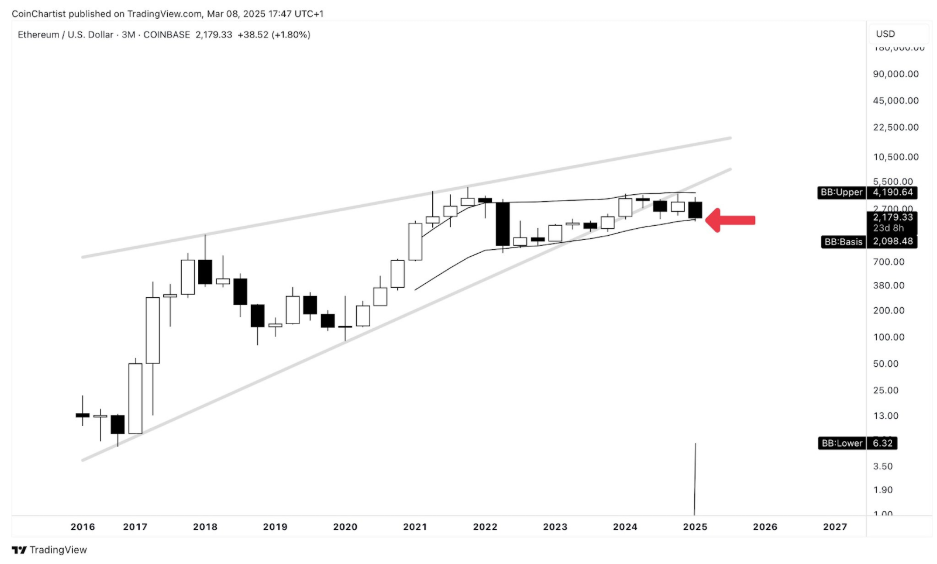
Image From X: Tony “The Bull” Severino
Related Reading
At the time of writing, Ethereum is trading at $2,178, having gained 2.2% in the past 24 hours after starting the day at $2,120. Ethereum’s sentiment is now at its lowest level this year. The next few weeks will be crucial to see if Ethereum can reclaim lost ground and prevent a monthly close below $2,100.
Featured image from Tech Magazine, chart from TradingView
Source link

Ethereum price dived below $2,000 on March 9, mirroring the broader market downtrend. Institutional investors are offloading ETH, increasing downside risks.
Ethereum Price Dives Below $2,000 as US NFP Tilts Markets Bearish
Ethereum (ETH) experienced significant losses over the weekend as the highly anticipated White House Summit failed to lift market sentiment. Instead, the latest US Non-Farm Payroll (NFP) report dominated investor outlook, highlighting rising unemployment and increasing inflation pressures.
As a result, ETH price tumbled below the psychological $2,000 level, trading as low as $1,998 on Binance on March 9, marking an 8% daily decline. The drop exceeded Bitcoin’s 4% losses within the same timeframe, signaling stronger bearish momentum within ETH spot markets.

The selling pressure has been exacerbated by mounting fears of further Federal Reserve tightening in response to rising inflation metrics. With investors now eyeing the next Consumer Price Index (CPI) report, ETH price could struggle to gain meaningful traction unless macroeconomic conditions shift favorably.
BlackRock ETF Led Outflows with $11 Million Sell-off After US NFP Data
Amid rising unemployment and inflation triggers, institutional investors are reallocating capital away from crypto markets toward fixed-income securities, driving bond yields higher across global markets. This shift in investor sentiment has translated into substantial outflows from Ethereum ETFs.

According to on-chain analytics provider SosoValue, Ethereum ETFs recorded $23 million in outflows on Friday, the same day the US NFP report was released. Among the largest liquidations, BlackRock’s iShares Ethereum ETF saw an $11 million capital flight, the highest single-day outflow among Ethereum-focused funds.
The rapid outflows in Ethereum ETFs suggest that institutional investors are repositioning their portfolios in anticipation of further downside in crypto markets. If Ethereum ETF outflows continue into the coming week, ETH price could struggle to mount a sustained recovery.
Ethereum Price Forecast: Death Cross Pattern Signals Deeper Decline Toward $1,850
Ethereum price forecast signals have taken a decisive bearish turn, with ETH plunging 8.3% on March 9 to test support near $2,000. The daily chart reveals a concerning technical setup, as ETH struggles below key moving averages, with a confirmed Death Cross between short-term EMAs signaling prolonged downside risks.
If Ethereum closes below the critical $2,000 level, selling pressure could accelerate, targeting the next major support at $1,850, where historical demand has previously stabilized declines.

The Bollinger Bands show ETH trading at the lower band, suggesting it is in oversold territory. However, the absence of a significant bullish reaction underscores weak buying momentum. The MACD histogram remains in deep negative territory, with its signal line widening against the MACD line—affirming that bearish momentum is strengthening rather than reversing. While a relief bounce cannot be ruled out, any recovery toward $2,250 or $2,433 would likely face intense resistance as sidelined sellers look to re-enter.
The heightened leverage in derivatives markets could amplify price swings. If ETH loses $2,000 decisively, long liquidations may accelerate a cascade effect, making $1,850 the next crucial test for bulls. Conversely, a close above $2,200 could shift sentiment toward a bullish retracement.
Ethereum Price Outlook: Key Levels to Watch This Week
For Ethereum to break its bearish grip, ETF inflows must show signs of stabilization, particularly from major asset managers like BlackRock. If institutional demand returns, ETH could attempt to reclaim the $2,100 level and challenge the $2,250 resistance zone.
On the flip side, if macroeconomic headwinds persist and ETF outflows accelerate, Ethereum risks dropping below $1,950, potentially testing lower support at $1,850. With US CPI data and Federal Reserve commentary on the horizon, traders should remain cautious, as Ethereum’s price action could see heightened volatility in response to broader market shifts.
Overall, Ethereum remains vulnerable to further downside unless it reclaims key resistance levels and sees a resurgence in institutional demand.
Frequently Asked Questions (FAQs)
Ethereum fell due to rising inflation concerns, ETF outflows, and macroeconomic uncertainty following the US Non-Farm Payroll (NFP) report.
If ETH closes below $2,000, the next major support is at $1,850, where historical buying activity has previously stabilized declines. 3. Can Ethereum recover above $2,200 soon? A rebound is possible if ETF inflows return and macroeconomic sentiment improves, but resistance at $2,250 could limit upside momentum.
A rebound is possible if ETF inflows return and macroeconomic sentiment improves, but resistance at $2,250 could limit upside momentum.
ibrahim
Crypto analyst covering derivatives markets, macro trends, technical analysis, and DeFi. His works feature in-depth market insights, price forecasts, and institutional-grade research on digital assets.
Disclaimer: The presented content may include the personal opinion of the author and is subject to market condition. Do your market research before investing in cryptocurrencies. The author or the publication does not hold any responsibility for your personal financial loss.
Source link

Wales Man Loses Appeal to Dig Out Hard Drive Holding $676 Million in Bitcoin

VanEck Files S-1 for Avalanche ETF With US SEC

Deep Dive on the Trump Reserve Token Whose Blockchain Ignores TVL

Is Trump intentionally crashing the market?
Crypto Faces Uncertainty As Trump’s ‘Short-Term Pain’ Unfolds

Kentucky Senate Passes Bill Protecting Bitcoin Self-Custody Rights

Crypto Fintech Giant MoonPay Continues Acquisition Spree With Purchase of Stablecoin Infrastructure Platform
Solana price slowly forms a rare pattern: can SOL surge 270%?

Ethereum Flat as Devs Prepare for Hooli Testnet Ahead of Pectra Upgrade

Dogecoin Price Nears Key Support as Analysts Predict Rally To $20
ZKsync Sunsets Liquidity Rewards Program, Citing Bearish Market Conditions

Why is Bitcoin price stuck?

Bitcoin Needs Weekly Close Above This Level To Confirm Market Bottom, Analyst Says

California Legislators Endorse Bitcoiner For $500 Billion Pension Board

‘There’s Every Reason To Be Cautious’: Trader Issues Alert on Bitcoin Amid Major Resistance – Here’s His Outlook


 24/7 Cryptocurrency News4 months ago
Arthur Hayes, Murad’s Prediction For Meme Coins, AI & DeFi Coins For 2025

 Bitcoin2 months ago
Expert Sees Bitcoin Dipping To $50K While Bullish Signs Persist

 24/7 Cryptocurrency News2 months ago
Aptos Leverages Chainlink To Enhance Scalability and Data Access

 Bitcoin4 months ago
Bitcoin Could Rally to $80,000 on the Eve of US Elections

 Bitcoin4 months ago
Institutional Investors Go All In on Crypto as 57% Plan to Boost Allocations as Bull Run Heats Up, Sygnum Survey Reveals

 Altcoins1 month ago
Sonic Now ‘Golden Standard’ of Layer-2s After Scaling Transactions to 16,000+ per Second, Says Andre Cronje

 Opinion4 months ago
Crypto’s Big Trump Gamble Is Risky

 Price analysis4 months ago
Ripple-SEC Case Ends, But These 3 Rivals Could Jump 500x

✓ Share: