
Bitcoin
‘There’s Every Reason To Be Cautious’: Trader Issues Alert on Bitcoin Amid Major Resistance – Here’s His Outlook

A closely followed crypto analyst and trader is warning that Bitcoin (BTC) is at high risk of a deeper correction.
In a new post, crypto trader Justin Bennett tells his 115,900 followers on the social media platform X that Bitcoin’s market structure is weakening as it fails to regain $92,000 as support.
“How do some people still not get it? Bitcoin closed February below $92,000. That happened. There’s nothing else to wait for. So far, March has found resistance there. As long as BTC is below $92,000 on a monthly closing basis, there’s every reason to be cautious on a macro level.”
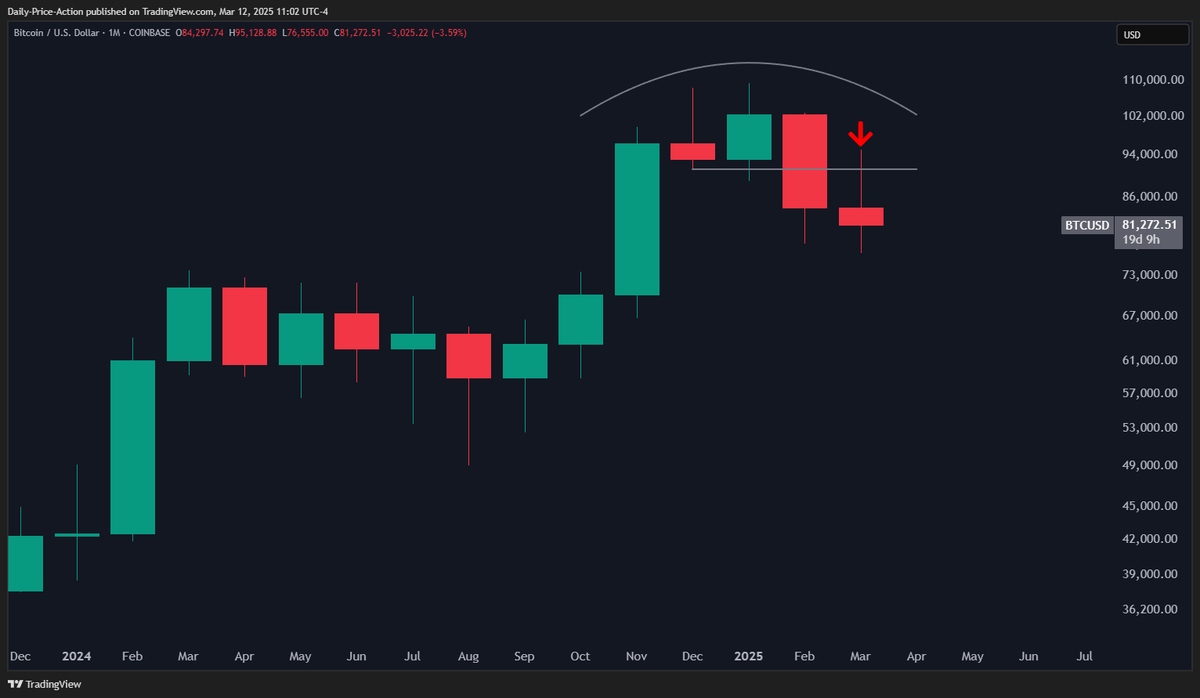
The analyst says even if Bitcoin shows some market strength this month, if it fails to close March above $92,000, the flagship digital asset remains at risk of a collapse.
“Nice reclaim of BTC $81,500 + retest. US CPI (Consumer Price Index) came in lower than forecast after some hot January numbers, so most likely some relief from risk assets. I can see $88,000 and possibly a $92,000 sweep, but from there, all eyes shift back to the February breakdown I’ve discussed.”
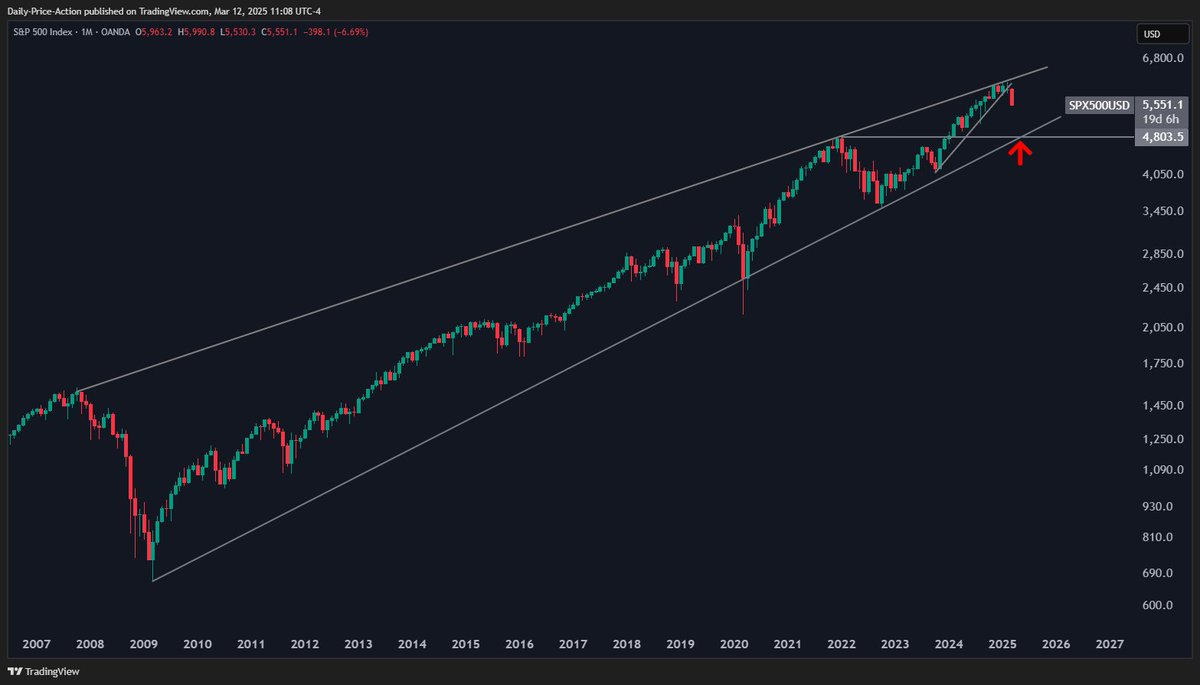
Bennett also says that based on Bitcoin’s historic correlation with the performance of stocks, a market bottom is not likely yet in for BTC as the S&P 500 is correcting.
“And if the S&P monthly structure since the Great Financial Crisis (that I’ve shared 117 times) is any indication, we still have a ways to go before we can start talking about a meaningful bottom.”
Bitcoin is trading for $80,916 at time of writing, down 3.2% in the last 24 hours.
Don’t Miss a Beat – Subscribe to get email alerts delivered directly to your inbox
Check Price Action
Follow us on X, Facebook and Telegram
Surf The Daily Hodl Mix
 

Disclaimer: Opinions expressed at The Daily Hodl are not investment advice. Investors should do their due diligence before making any high-risk investments in Bitcoin, cryptocurrency or digital assets. Please be advised that your transfers and trades are at your own risk, and any losses you may incur are your responsibility. The Daily Hodl does not recommend the buying or selling of any cryptocurrencies or digital assets, nor is The Daily Hodl an investment advisor. Please note that The Daily Hodl participates in affiliate marketing.
Generated Image: Midjourney
Source link


A widely followed crypto analyst and trader is warning that an altcoin market bounce may end up being short-lived.
In a new post, pseudonymous crypto trader Altcoin Sherpa tells his 243,900 followers on the social media platform X that alts may give up gains after bouncing based on historical precedence.
He also says Bitcoin (BTC) may soon flip $84,000 into support and that the flagship crypto asset could maintain bullish momentum by breaking through the $89,000 level.
“BTC looks like $84,000 is the first test that is going to break (to the upside) and we’re ok in that department. $89,000 would be my next level of interest overall. Alts looking like they’ll give a temporary bounce but not sure how strong (yet). Be on guard.”

Looking at his chart, the analyst suggests that if Bitcoin can regain $98,703 as support, the flagship crypto asset may print new all-time highs.
However, he warns if $78,167 breaks down as support, Bitcoin may plummet into the $60,000 range.
Bitcoin is trading for $84,154 at time of writing, up 4.6% in the last 24 hours.
The analyst also warns that altcoins like the dogwifhat (WIF) memecoin may struggle for a long time to ever regain higher price targets if Bitcoin turns bearish.
“It’s a lot more concerning for sh**coins this go around because BTC might actually be dead for a bit. In the previous drawdown, we had a lot more hope because we assumed BTC still had more upside. If BTC dies to $50,000 or w/e (whatever), these aren’t coming back for a very long time. See WIF.”
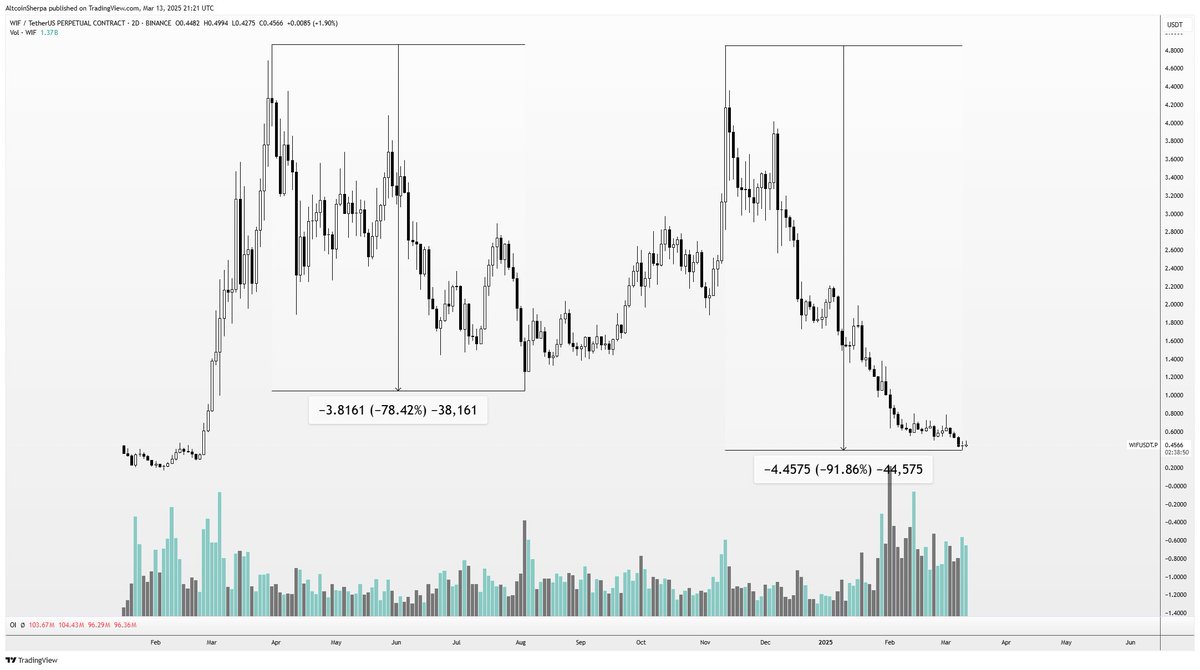
WIF is trading for $0.50 at time of writing, up 9.7% in the last 24 hours.
He adds that altcoins may bounce even as they continue to print a bearish lower-high price structure.
“As much as everything is dead and we’re truly in a bear market for altcoins, it’s important to remember that a bounce will come and alts can still do a few x from current levels. Markets don’t move in a straight line down. Bounce coming within the next one to two months in my opinion.”
He shares the two-day chart of Ethereum (ETH) to illustrate the historical precedence of an altcoin bouncing amid a larger downtrend.

Follow us on X, Facebook and Telegram
Don’t Miss a Beat – Subscribe to get email alerts delivered directly to your inbox
Check Price Action
Surf The Daily Hodl Mix
 
Disclaimer: Opinions expressed at The Daily Hodl are not investment advice. Investors should do their due diligence before making any high-risk investments in Bitcoin, cryptocurrency or digital assets. Please be advised that your transfers and trades are at your own risk, and any losses you may incur are your responsibility. The Daily Hodl does not recommend the buying or selling of any cryptocurrencies or digital assets, nor is The Daily Hodl an investment advisor. Please note that The Daily Hodl participates in affiliate marketing.
Generated Image: Midjourney
Source link
Reason to trust
![]()
Strict editorial policy that focuses on accuracy, relevance, and impartiality
Created by industry experts and meticulously reviewed
The highest standards in reporting and publishing
Strict editorial policy that focuses on accuracy, relevance, and impartiality
Morbi pretium leo et nisl aliquam mollis. Quisque arcu lorem, ultricies quis pellentesque nec, ullamcorper eu odio.
Bitcoin’s price trajectory has become a significant point of interest in light of the recent downtrend, which has disappointed many bullish traders. According to on-chain analytics platform IntoTheBlock, the recent price crash up to the current price has seen over 6.5 million BTC addresses falling into losses. Still, technical analysis suggests Bitcoin could experience further drops.
The question is whether Bitcoin will test the $70,000 mark before regaining strength or can rebound from here toward a $300,000 price target. Insights from price structure and historical patterns help provide a clearer picture of what’s next.
Bitcoin Price Decline: A Normal Cycle Within Uptrends
Despite concerns over Bitcoin’s recent price swings, crypto analyst Philip (BasicTradingTV) maintains that the market is behaving normally within a long-term bullish structure. He highlights that on the higher monthly timeframe, Bitcoin continues to create higher highs and higher lows and maintains a solid uptrend that dates back to 2017.
Related Reading
This technical outlook, which was noted on the TradingView platform, comes as a response to concerns about whether BTC is still bullish after the ongoing 25% correction from its recent all-time high.
Traders have been unsettled following the recent drop, but historical trends suggest this kind of movement is part of the market’s natural cycle. According to the analyst, Bitcoin is still forming a bullish market structure, and while short-term fluctuations may continue, the broader uptrend channel from 2017 is still in place. Furthermore, the analyst noted previous instances of 25% and 40% corrections during Bitcoin’s rallies from the lower trendline of this uptrend channel.
What’s Next For BTC? Possible Retest Of Resistance Before Rally To $300,000
With the notion of a long-term uptrend still intact, the analyst noted, however, that Bitcoin could continue its downtrend until it reaches $70,000. This level holds significant importance, as it previously marked Bitcoin’s all-time high before turning into resistance around mid-2024. After multiple attempts, Bitcoin eventually broke through this resistance toward the end of the year, leading to its new all-time high of $108,786 in January 2025.
Related Reading
As such, this $70,000 level is now a major psychological support zone, making it a key area to watch amidst the ongoing Bitcoin price correction. From here, the analyst predicted a rebound that would send BTC to reach as high as $300,000. “Levels to watch: 70.000, $300.000,” the analyst said.
At the time of writing, Bitcoin is trading at $82,555, having spent the majority of the past 24 hours trading between $79,947 and $83,436. This leaves Bitcoin still about 14% away from testing the $70,000 support level.
However, there is also the possibility that BTC may not drop as low as $70,000 before bullish sentiment takes over once again. If Bitcoin continues to follow the trajectory of past cycles, Fibonacci extensions point to price targets between $150,000 and $300,000.
Featured image from Unsplash, chart from Tradingview.com
Source link
Bitcoin has been struggling with lower lows in recent weeks, leaving many investors questioning whether the asset is on the brink of a major bear cycle. However, a rare data point tied to the US Dollar Strength Index (DXY) suggests that a significant shift in market dynamics may be imminent. This bitcoin buy signal, which has only appeared three times in BTC’s history, could point to a bullish reversal despite the current bearish sentiment.
For a more in-depth look into this topic, check out a recent YouTube video here:
Bitcoin: This Had Only Ever Happened 3x Before
BTC vs DXY Inverse Relationship
Bitcoin’s price action has long been inversely correlated with the US Dollar Strength Index (DXY). Historically, when the DXY strengthens, BTC tends to struggle, while a declining DXY often creates favorable macroeconomic conditions for Bitcoin price appreciation.


Despite this historically bullish influence, Bitcoin’s price has continued to retreat, recently dropping from over $100,000 to below $80,000. However, past occurrences of this rare DXY retracement suggest that a delayed but meaningful BTC rebound could still be in play.
Bitcoin Buy Signal Historic Occurrences
Currently, the DXY has been in a sharp decline, a decrease of over 3.4% within a single week, a rate of change that has only been observed three times in Bitcoin’s entire trading history.

To understand the potential impact of this DXY signal, let’s examine the three prior instances when this sharp decline in the US dollar strength index occurred:
- 2015 Post-Bear Market Bottom
The first occurrence was after BTC’s price had bottomed out in 2015. Following a period of sideways consolidation, BTC’s price experienced a significant upward surge, gaining over 200% within months.
The second instance occurred in early 2020, following the sharp market collapse triggered by the COVID-19 pandemic. Similar to the 2015 case, BTC initially experienced choppy price action before a rapid upward trend emerged, culminating in a multi-month rally.
- 2022 Bear Market Recovery
The most recent instance happened at the end of the 2022 bear market. After an initial period of price stabilization, BTC followed with a sustained recovery, climbing to substantially higher prices and kicking off the current bull cycle over the following months.
In each case, the sharp decline in the DXY was followed by a consolidation phase before BTC embarked on a significant bullish run. Overlaying the price action of these three instances onto our current price action we get an idea of how things could play out in the near future.

Equity Markets Correlation
Interestingly, this pattern isn’t limited to Bitcoin. A similar relationship can be observed in traditional markets, particularly in the Nasdaq and the S&P 500. When the DXY retraces sharply, equity markets have historically outperformed their baseline returns.

The all-time average 30-day return for the Nasdaq following a similar DXY decline stands at 4.29%, well above the standard 30-day return of 1.91%. Extending the window to 60 days, the Nasdaq’s average return increases to nearly 7%, nearly doubling the typical performance of 3.88%. This correlation suggests that Bitcoin’s performance following a sharp DXY retracement aligns with historical broader market trends, reinforcing the argument for a delayed but inevitable positive response.
Conclusion
The current decline in the US Dollar Strength Index represents a rare and historically bullish Bitcoin buy signal. Although BTC’s immediate price action remains weak, historical precedents suggest that a period of consolidation will likely be followed by a significant rally. Especially when reinforced by observing the same response in indexes such as the Nasdaq and S&P 500, the broader macroeconomic environment is setting up favorably for BTC.
Explore live data, charts, indicators, and in-depth research to stay ahead of Bitcoin’s price action at Bitcoin Magazine Pro.
Disclaimer: This article is for informational purposes only and should not be considered financial advice. Always do your own research before making any investment decisions.
Source link

Best New Presales to Buy as Bullish Bitcoin Signal Promises Upcoming Bull Run

Russia Is Using Bitcoin And Crypto For Its Oil Trades With China And India

‘Be on Guard’: Trader Says Altcoin Bounce May Be Temporary, Tracks Bitcoin’s Next Targets

Sacks purges crypto, but Trump? His digital empire continues

This Week in Bitcoin: Strategy Stalls, But White House Plans to Buy More BTC

Layer3 (L3) Price Prediction March 2025, 2026, 2030, 2040

Ripple Token Zooms 5% Higher as Bitcoin Grapples With $84K Level

Bitcoin’s megaphone pattern, explained: How to trade it
Is Bitcoin Price Headed For $70,000 Or $300,000? What The Charts Are Saying

This Rare Bitcoin Buy Signal Could Ignite Next BTC Rally

There’s a Good Chance the Bull Cycle’s Over if Bitcoin Plunges to This Level, Warns Analyst Benjamin Cowen

Ethena overtakes PancakeSwap and Jupiter with $3.28m daily revenue

Gold ETFs Winning the Asset Race With Bitcoin Funds–for Now

BTC Regains $84K; ETH, XRP, SOL Pump

Court Approves 3AC’s $1.53B Claim Against FTX, Setting Up Major Creditor Battle


 24/7 Cryptocurrency News4 months ago
Arthur Hayes, Murad’s Prediction For Meme Coins, AI & DeFi Coins For 2025

 Bitcoin2 months ago
Expert Sees Bitcoin Dipping To $50K While Bullish Signs Persist

 24/7 Cryptocurrency News2 months ago
Aptos Leverages Chainlink To Enhance Scalability and Data Access

 Bitcoin4 months ago
Bitcoin Could Rally to $80,000 on the Eve of US Elections

 Altcoins1 month ago
Sonic Now ‘Golden Standard’ of Layer-2s After Scaling Transactions to 16,000+ per Second, Says Andre Cronje

 Bitcoin4 months ago
Institutional Investors Go All In on Crypto as 57% Plan to Boost Allocations as Bull Run Heats Up, Sygnum Survey Reveals

 Opinion4 months ago
Crypto’s Big Trump Gamble Is Risky

 Price analysis4 months ago
Ripple-SEC Case Ends, But These 3 Rivals Could Jump 500x
