
ETH Price
Ethereum price Tags $1,500 As Global Stock Market Crash Triggers Circuit Breakers

Ethereum price has hit $1,5000 as Crypto market crash steepens, shedding $410 billion in the past two weeks. The sell-off is not localized to cryptocurrencies but also across the global stock markets, triggering cricuit breakers in Taiwan, Japan, Australia, Russel Futures and even in Singapore. What’s next for Ethereum (ETH) price prediction? Should you buy the dip?
Ethereum Price Suffers Amid Stock & Crypto Market Collapse
In the early Asian session, Bitcoin price slipped below $80K, Ethereum price hit $1,520 as the stock and crypto markets plummeted in reaction to Trump’s tariffs. As a result of this steep sell-off, the authorities triggered circuit breakers, aka halting trading when markets fall rapidly. Cricuit breakers were triggered in Taiwan, Japan, Australia, Singapore and in Russel Futures.
S&P 500 circuit breakers are market-wide trading halts triggered at three levels – a 7% drop pauses trading for 15 minutes, a 13% drop halts for another 15 minutes, and a 20% drop stops trading for the day.
But there are no circuit breakers in the cryptocurrency markets, which often leads to massive selloff especially if the leverage in the market is high.
As seen, ETH’s value has crashed nearly 20% in the past 21 hours and currently trades at $1,520. Is this a good place to buy ETH? Let’s explore Ethereum price predictions and key levels to watch.
Ethereum Price Prediction: Key Levels to Watch
The weekly chart for Ethereum price shows that ETH is close to a key support level at $1,504. This is the midpoint of the $1,073 to $1,934 range created between July 2022 & October 2023. The next critical support level is the orderblock at $1,278 formed in mid-December 2022. This demand zone was followed by a 77% rally in under four months. Hence, a revisit of this level could see a strong buying pressure that could absorb the selling pressure.
If the above two key levels fail to support ETH price, then the range low at $1,073 will be the final line of defense.
Ethereum price prediction remains bearish so long as any of these levels absorb selling pressure and allow ETH bulls to form a base.
If Trump’s tariffs do not stop, then a selling frenzy could make all of the aforementioned support levels meaningless. However, there is one hope for cryptocurrency as Bitcoin is as an uncorrelated asset. If demand flows into BTC amid times of uncertainty, it could fuel Ethereum price recovery rally as well.
Frequently Asked Questions (FAQs)
Ethereum price has hit $1,520 amid the crypto market crash.
The key support levels are $1,504, $1,278, and $1,073.
Ethereum price prediction remains bearish until the selling pressure is absorbed, and bulls form a base.
Akash Girimath
Senior Cryptocurrency Analyst & Market Strategist
Engineer-turned-analyst Akash Girimath delivers data-driven insights on cryptocurrency markets, DeFi, and blockchain technology for platforms like AMBCrypto and FXStreet. Specializing in technical analysis, on-chain analytics, and risk management, he empowers institutional investors and retail traders to navigate market volatility and regulatory shifts.
A hands-on strategist, Akash merges active crypto portfolio management with research on Web3, NFTs, and tokenomics. At AMBCrypto, he led cross-functional teams to redesign content frameworks, achieving record-breaking traffic growth through scalable editorial strategies. His analyses dissect market sentiment, investment strategies, and price predictions, blending macroeconomic trends with real-world trading expertise.
Known for mentoring analysts and optimizing workflows for high-impact reporting, Akash’s work is cited across global crypto publications, reaching 500k+ monthly readers. Follow his insights on YouTube, X, and LinkedIn for cutting-edge perspectives on decentralized ecosystems and crypto innovation.
Disclaimer: The presented content may include the personal opinion of the author and is subject to market condition. Do your market research before investing in cryptocurrencies. The author or the publication does not hold any responsibility for your personal financial loss.
Source link


Ethereum price tumbles below $1,600 facing pressure amid $86 million DeFi capital flight to faster, low-cost rivals like Solana.
Capital Rotation Into Solana Spurs Concerns for Ethereum’s DeFi Dominance
Ethereum (ETH) is facing renewed competitive pressure after nearly $87 million in assets migrated from its ecosystem to rival blockchains in the week following former U.S. President Donald Trump’s repeal of a controversial decentralized finance (DeFi) regulation.
On April 10, Trump signed a bill overturning a Biden-era mandate requiring DeFi protocols to comply with Know Your Customer (KYC) and Anti-Money Laundering (AML) rules. The reversal was widely interpreted as a win for crypto-native projects, removing a major regulatory overhang that threatened the sector’s permissionless structure.

But for Ethereum — the current hub of DeFi liquidity — the impact has been less than favorable.
According to data from Wormhole, the largest cross-chain bridge on Ethereum, Solana captured the lion’s share of outflows with over $54 million redirected into its ecosystem. Base, Arbitrum, and Avalanche followed, attracting $9.6 million, $5.8 million, and $3.9 million, respectively.
Rapid Transfers from Ethereum Sparks 21% rally for Solana
Notably, the Solana-bound assets were funneled into DeFi protocols such as Jupiter, Kamino, and MarginFi.
Based on the latest data from DefiLlama, Solana TVL has been on a steady rise since Trump’s signing repealed the DeFI law last week.

As seen in the chart above, Solana TVL increased 12% from $6.1 billion on April 9, to hit the $6.9 million mark at press time on Wednesday, April 16. This shows that investors deposited over $800 million into various Solana native Defi protocols over the past week.
With Solana price currently trading at $135, up 21% on the weekly timeframe. Comparatively, Ethereum price is trading below $1,600 mark, with its 8% gain on the weekly candle, reflecting second lowest returns among the top 10 ranked crypto assets.
Looking Ahead:
The DeFi fund flows observed on the Wormhole bridge further reinforce the narrative that Ethereum could be losing market dominance, as deepening regulatory clarity encourages investors to switch towards rival Layer-1 and Layer-2 protocols.
The ongoing migration trend from Ethereum to faster, lower-cost networks. Ethereum still leads in total value locked (TVL), but this week’s data is a clear signal of shifting momentum.
More so, major institutional players venturing into crypto on new themes like Real-world Asset and securities Tokenization are increasingly opting for alternative layer-1 protocols like Hedera, Avalanche, while Solana and Cardano maintain a strong hold on retail dominance.
Solana, which suffered from performance concerns in 2022, has staged a significant turnaround in both uptime and developer activity.
The network processed over 60 million daily transactions this week, far surpassing Ethereum’s 1.1 million, and maintained average fees below $0.01, according to data from Solana Explorer.
Ethereum Price Forecast: ETH Eyes $1,700 Rebound as Momentum Shifts
Ethereum price forecast charts show early signs of a potential rebound after closing at $1,592.60, gaining 0.24% on the day.
The Bollinger Bands are starting to compress, suggesting a volatility squeeze, with the mid-band resistance at $1,695.42 acting as the first upside target. ETH price is currently attempting to reclaim ground within the lower half of the bands, signaling the possibility of a bullish reversal.

The Parabolic SAR dots have flipped below the candlesticks, which is a classic buy signal in trend-following strategies.
This adds further weight to a bullish Ethereum price forecast, especially as the MACD histogram shifts into green territory for the first time in weeks. The MACD line is rising toward the signal line, suggesting bullish momentum may soon dominate.
If ETH clears $1,695, a push toward the upper Bollinger Band at $1,960 becomes plausible. However, failure to maintain current support near $1,430, ETH price risks a retest of $1,397.19, where the SAR last confirmed support.
Frequently Asked Questions (FAQs)
Ethereum faces stiff competition from faster, lower-cost Layer-1s like Solana, especially after $87M in assets migrated post-regulation repeal.
Ethereum still leads in Total Value Locked (TVL), but ongoing migration to Solana and others poses a real competitive threat.
Yes, Ethereum remains foundational for DeFi, but investors should monitor shifting flows and regulatory developments affecting its ecosystem
ibrahim
Crypto analyst covering derivatives markets, macro trends, technical analysis, and DeFi. His works feature in-depth market insights, price forecasts, and institutional-grade research on digital assets.
Disclaimer: The presented content may include the personal opinion of the author and is subject to market condition. Do your market research before investing in cryptocurrencies. The author or the publication does not hold any responsibility for your personal financial loss.
Source link
Reason to trust
![]()
Strict editorial policy that focuses on accuracy, relevance, and impartiality
Created by industry experts and meticulously reviewed
The highest standards in reporting and publishing
Strict editorial policy that focuses on accuracy, relevance, and impartiality
Morbi pretium leo et nisl aliquam mollis. Quisque arcu lorem, ultricies quis pellentesque nec, ullamcorper eu odio.
Ethereum might be on track to facing renewed pressure, according to an interesting technical outlook. Despite short bursts of recovery attempts, the broader market structure is still trying to flip in favor of bulls, but price movement shows that the bears are still in control. Notably, a recent technical analysis posted by crypto analyst Youriverse on the TradingView platform highlights a potential sharp drop in the price of Ethereum towards $1,400 if the current downward trend continues.
Strong Rejection From Key Fibonacci Zone Hints At Persistent Resistance
Technical analysis shows that the Ethereum price chart is currently characterized by a noticeable Fair Value Gap (FVG) on the 4-hour timeframe. This interesting gap was left behind after a steep 10% drop last Sunday, marking a strong area of seller dominance.
Related Reading
This gap represents a zone of clear imbalance where selling activity outweighs buying pressure and has influenced Ethereum’s price action throughout the past seven days. Earlier last week, Ethereum retraced into this gap, reaching the midpoint, but was met with swift rejection. This swift rejection showed the intense selling pressure present within this Fair Value Gap.
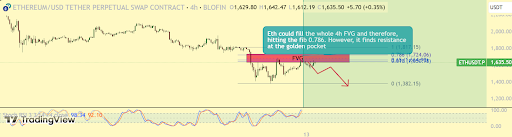
Interestingly, the Ethereum price has returned to this Fair Value Gap again, and another rejection here could send it back to a bottom below $1,400. Furthermore, Ethereum is trading within an area identified as the “golden pocket” of the Fibonacci extension indicator, which is drawn from the $1,383 bottom on April 9. Unless price action breaks decisively above this level and heads toward the next Fib level of 0.786 at $1,724, there is still a risk of a significant rejection that could lead to further downside below $1,400.
Stochastic RSI Weakness Suggests Possible Downturn Ahead For Ethereum
In addition to the Fair Value Gap and Ethereum’s struggle within the golden pocket of the Fibonacci retracement zone, the Stochastic RSI is now introducing another layer of bearish pressure to the current outlook. This momentum oscillator, which measures the relative strength of recent price movements, is approaching the overbought region on the daily timeframe.
Related Reading
Ethereum’s approach of overbought zone with the Stochastic RSI is due to inflows that have pushed the crypto’s price from the $1,383 bottom on April 9. Now that the Stochastic RSI is moving into the overbought zone, it adds to the bearish outlook that it could reject at the Fair Value Gap and start a new downside correction very soon.
So far, the Ethereum price was rejected at $1,650 in the past 24 hours, which further supports the bearish continuation thesis. If the selling pressure builds again, as suggested by both the weakening RSI and persistent resistance at the Fair Value Gap, the analyst warns of a breakdown that could drag the price to as low as $1,400, or even lower.
At the time of writing, Ethereum is trading at $1,627.
Featured image from Unsplash, chart from Tradingview.com
Source link

Ethereum (ETH) seems to be turning around its bad luck as it has rallied 18% from the previous weekly low. Does this mean Ethereum price has bottomed? Here are three reason why ETH could drop lower.
3 Reasons Why Ethereum Price Could Continue its Descent
Ethereum price has tagged the 2018 ATH of $1,385, which has many believing that this could be the bottom. However, there are three critical reasons why a further crash could be possible for ETH.
Reason 1: Weekly Price Chart Shows Key Resistance Level
The 1-week TradingView chart shows that Ethereum price is revisiting $1,630, which is the highest volume traded level since February 2021. Since the recent crash pushed ETH below it, it is upon bulls to flip this hurdle into a support floor. As long as this resistance level stands, there is a good chance ETH’s value will continue to depreciate.
Moreover, the intermediate demand zone at $1,280 is the next Ethereum price support floor that could absorb selling pressure. After this area from, $1,280 to $1,160, was fromed in December 2022, the price of ETH shot up more than 40% in the next three to four weeks without any pullbacks. Hence, a revisit of this zone is also likely.
The absolute key support or demand zone extends from $890 to $715, which is a weekly buy-side imbalance that led to near 50% weekly candlestick.
Reason 2: RSI Yet to be Oversold
On the weekly chart, the Relative Strength Index (RSI) has not yet hit oversold territory. All the major rallies for Ethereum price have begun after RSI tagged an oversold level. Hence, the chances of a further drop are likely for ETH, potentially into the $1,280 to $1,160 and $890 to $715 zones.
Reason 3: Uncertain Macroeconomic Conditions
From a macroeconomic perspective, the Trump and Xi trade war between the US & China has caused additional volatility in the stock and crypto markets. This has left Ethereum price prediction bearish due to fears of recession.
Additionally, this week has two major events: Fed Chair Powell’s speech and the March inflation announcement. The outcome of both critical news events could induce additional volatility that could kickstart a messy collapse.
So, overall, the outlook for Ethereum price remains neutral-to-bearish. However investors need to be more cautious ahead of the upcoming events amid Trump-Xi trade war.
Frequently Asked Questions (FAQs)
It’s uncertain, as three critical reasons suggest ETH could drop lower: key resistance level, RSI not oversold, and uncertain macroeconomic conditions.
The key support levels are $1,280-$1,160 and $890-$715, which could potentially absorb selling pressure.
Upcoming events like Fed Chair Powell’s speech and March inflation announcement, as well as the Trump-Xi trade war, could induce additional volatility.
Akash Girimath
Senior Cryptocurrency Analyst & Market Strategist
Engineer-turned-analyst Akash Girimath delivers data-driven insights on cryptocurrency markets, DeFi, and blockchain technology for platforms like AMBCrypto and FXStreet. Specializing in technical analysis, on-chain analytics, and risk management, he empowers institutional investors and retail traders to navigate market volatility and regulatory shifts.
A hands-on strategist, Akash merges active crypto portfolio management with research on Web3, NFTs, and tokenomics. At AMBCrypto, he led cross-functional teams to redesign content frameworks, achieving record-breaking traffic growth through scalable editorial strategies. His analyses dissect market sentiment, investment strategies, and price predictions, blending macroeconomic trends with real-world trading expertise.
Known for mentoring analysts and optimizing workflows for high-impact reporting, Akash’s work is cited across global crypto publications, reaching 500k+ monthly readers. Follow his insights on YouTube, X, and LinkedIn for cutting-edge perspectives on decentralized ecosystems and crypto innovation.
Disclaimer: The presented content may include the personal opinion of the author and is subject to market condition. Do your market research before investing in cryptocurrencies. The author or the publication does not hold any responsibility for your personal financial loss.
Source link

Bitcoin Price Holds Steady, But Futures Sentiment Signals Caution

Panama City Approves Bitcoin And Crypto Payments For Taxes, Fees, And Permits

Crypto Trader Says Solana Competitor Starting To Show Bullish Momentum, Updates Outlook on Bitcoin and Ethereum

weakness signals move toward lower support

Now On Sale For $70,000: The World’s First Factory Ready Open-Source Humanoid Robot

What Next for ETH as Traders Swap $86M into Solana DeFi protocols ?

Why Did Bitcoin Price (BTC) Fall on Wednesday Afternoon

Solana price is up 36% from its crypto market crash lows — Is $180 SOL the next stop?

Solana Retests Bearish Breakout Zone – $65 Target Still In Play?

How Expanding Global Liquidity Could Drive Bitcoin Price To New All-Time Highs

Apple Delists 14 Crypto Apps in South Korea Including KuCoin and MEXC Exchanges Amid Regulatory Crackdown

Athens Exchange Group eyes first onchain order book via Sui

Futureverse Acquires Candy Digital, Taps DC Comics and Netflix IP to Boost Metaverse Strategy
Court Grants Ripple And SEC’s Joint Motion To Suspend Appeal

AVAX Falls 2.1% as Nearly All Assets Trade Lower


 24/7 Cryptocurrency News5 months ago
Arthur Hayes, Murad’s Prediction For Meme Coins, AI & DeFi Coins For 2025

 Bitcoin3 months ago
Expert Sees Bitcoin Dipping To $50K While Bullish Signs Persist

 24/7 Cryptocurrency News3 months ago
Aptos Leverages Chainlink To Enhance Scalability and Data Access

 Bitcoin5 months ago
Bitcoin Could Rally to $80,000 on the Eve of US Elections

 Opinion5 months ago
Crypto’s Big Trump Gamble Is Risky

 Bitcoin5 months ago
Institutional Investors Go All In on Crypto as 57% Plan to Boost Allocations as Bull Run Heats Up, Sygnum Survey Reveals

 Altcoins3 months ago
Sonic Now ‘Golden Standard’ of Layer-2s After Scaling Transactions to 16,000+ per Second, Says Andre Cronje

 Ripple Price4 weeks ago
3 Voting Polls Show Why Ripple’s XRP Price Could Hit $10 Soon

✓ Share: