XRP
A Look At Historical Price Alignments
Published
4 months agoon
By
admin
In a technical analysis shared by crypto analyst Bobby A (@Bobby_1111888) on X, the analyst projects that XRP will potentially reach the $15 mark in this bull run, contingent upon historical price movement patterns aligning. The analysis delves into XRP’s past market cycles, applying percentage-based extrapolations and chart pattern assessments to forecast future price trajectories.
Is A XRP Price Of $15 Realistic?
Bobby A’s analysis juxtaposes XRP’s performance during its 2017 market cycle against its current 2024 trajectory. From the range-high breakout in 2017, marked by a horizontal black dashed line on the chart, XRP experienced an initial appreciation of 629%.
In comparison, the asset has appreciated approximately 331% since its range-high breakout in 2024. Extending further back, from the December 2014 high to the May 2017 peak—approaching the 4.236 Fibonacci extension—XRP saw a staggering 1,330% increase.
Related Reading
Applying the principle of reducing percentage point increases by half, as observed from the initial surge in 2017, Bobby A posits that XRP’s next impulse could result in a 665% increase. This calculation positions XRP at an approximate $15.00 near the 4.236 Fibonacci extension level.
“XRP appears to be cutting its percentage point increases in half compared to its 2017 market cycle. If XRP cuts its next impulse in half from a percentage point increase perspective, as it did with this first one, it would put the asset’s price at roughly ~$15.00 near its 4.236 extension after a possible 665% increase,” Bobby A elaborates.
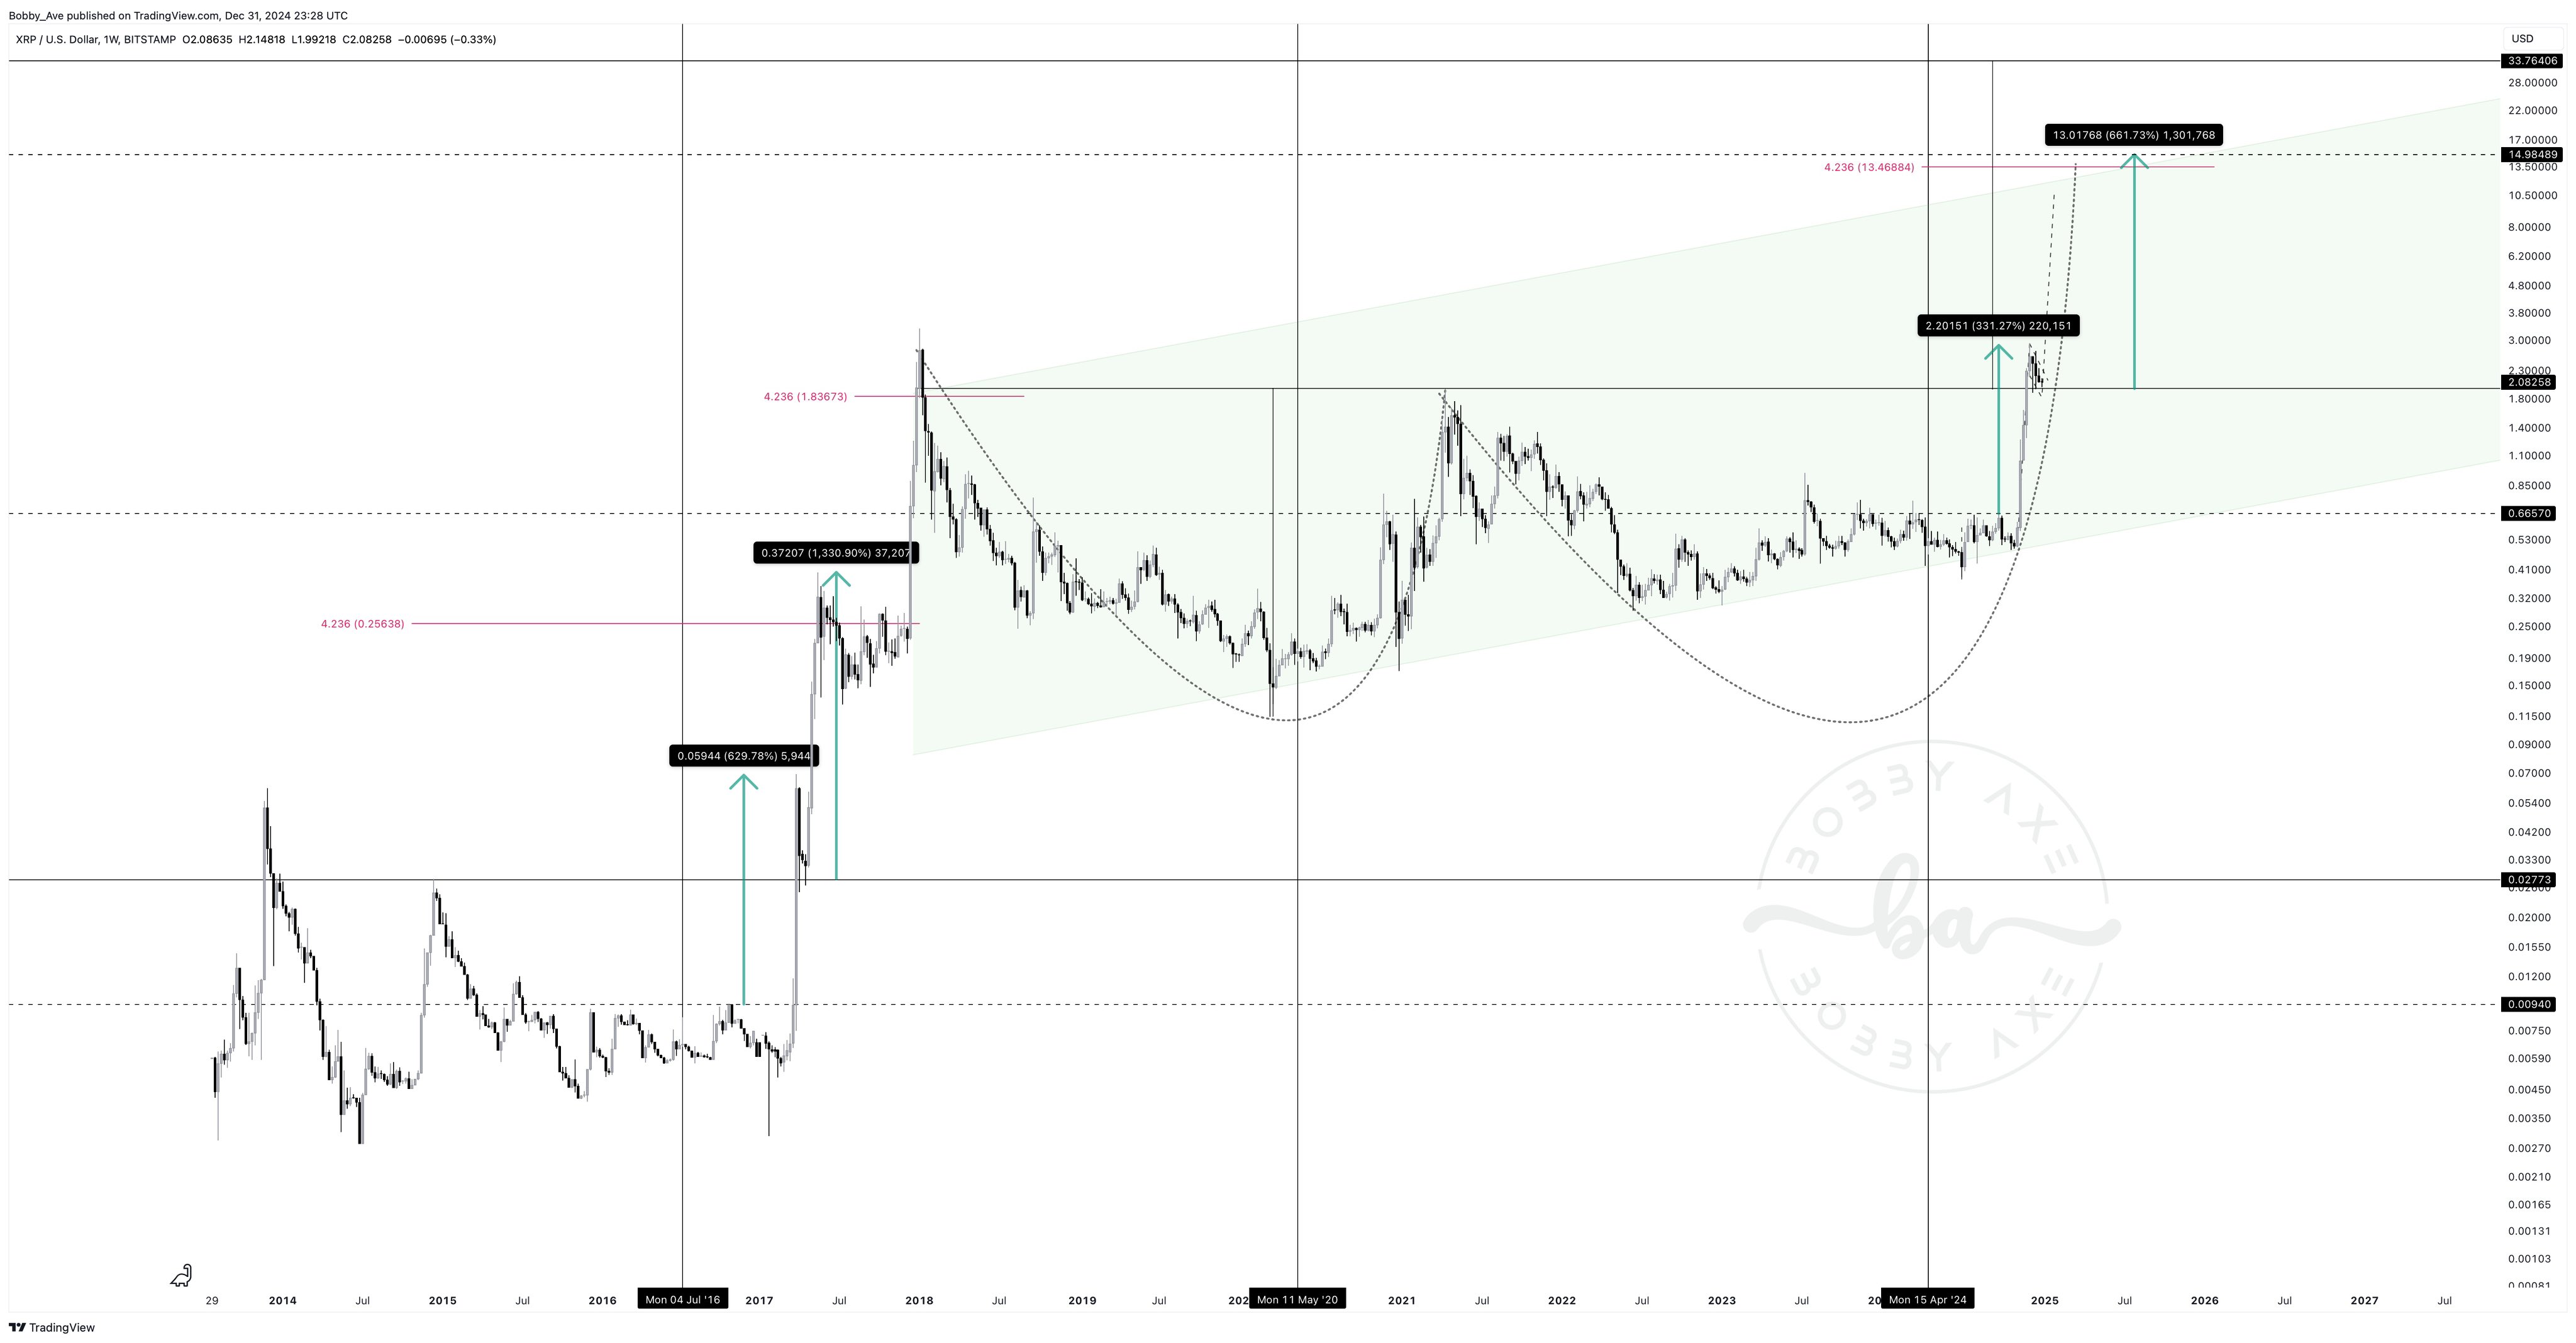
Notably, the analyst also notices a developing bull flag pattern, a continuation pattern that typically signals the potential for further upward movement. This bull flag is targeting the upper boundary of XRP’s macro parallel channel, estimated around the $10.50 price level. “The current bull flag the asset is forming targets the top of its macro parallel channel near $10.50,” Bobby A notes.
Related Reading
Another analyst, bassii (@cryptobassii), responded with a contrasting viewpoint centered on fractal analysis. Bassii posits that the ongoing run may be curtailed by 42%, projecting XRP’s price to approach $9, followed by a significant downturn.
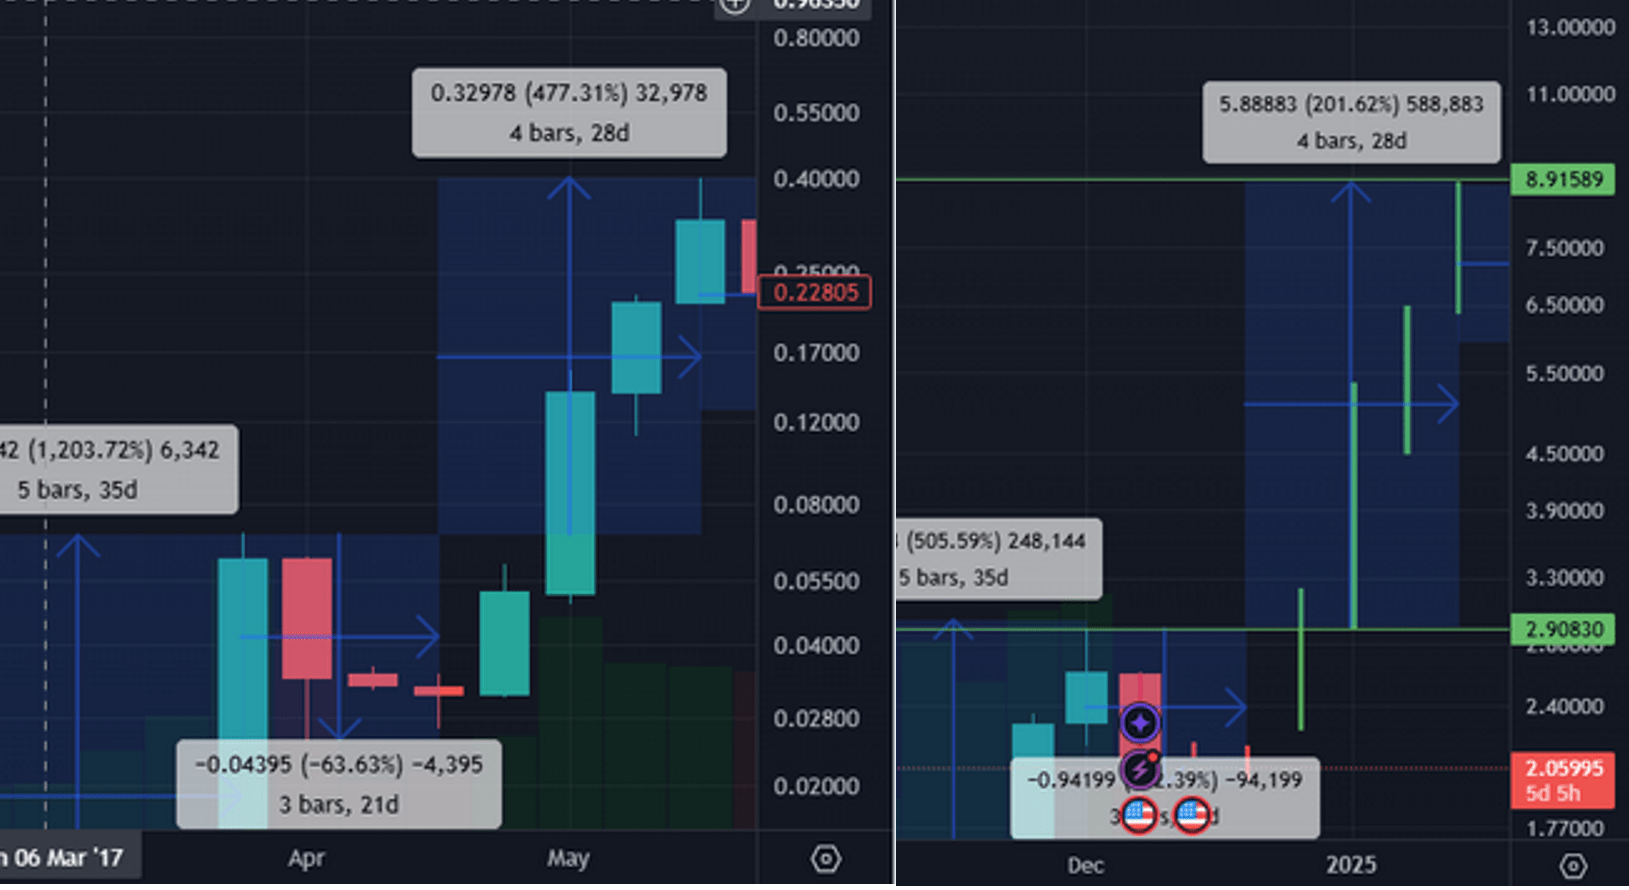
He elaborates on the fractal patterns, stating, “This run seems to be cut to 42%, would get us close to $9, then a big drop. But you’re missing the last part of the 2017 run, IF (big if) that happens, and we keep same %, we get around $30 after months of accumulation.”
Or Even $35?
Bassii referred to a previous analysis of himself where he emphasized the similarities between the 2024 run and the 2017 cycle. Notably, both periods exhibit five weeks of consecutive green candles, albeit with differing magnitudes—approximately 500% in 2024 compared to 1,200% in 2017.
He points out, “2017: 5 weeks of green candles at ~1,200% ^, followed by 3 weeks of red candles down 63%. 2024: Also, 5 weeks of green candles at ~500% up (~1/2 of 2017’s run), followed by… (so far) 1 week of red candles by how much? You guessed it… 30% down.” The subsequent correction phases also mirror each other, with XRP experiencing a 30% decline in 2024 compared to a 63% drop in 2017, each roughly halved in magnitude.
Based on this, Bassii outlines potential future movements based on historical patterns, suggesting that if XRP continues to follow these fractal patterns without significant breakdowns, it could accumulate over several months and potentially ascend to $30 by September 2025.
Responding to Bassii’s analysis, Bobby A expresses cautious optimism, stating, “Yeah but I’m not sure that the last impulse will come. The next one I’m much more confident in.” Bassii complements this by highlighting the importance of adhering to fractal patterns and real-time chart developments, adding, “I think it will depend on how closely we follow the fractals and what the chart tells us during this upcoming run. So far it’s followed very very closely. The weekly candles for the last 8 weeks have followed beat by beat. I’m not a moon boy, I know how crazy $30-35 sounds. But if we’re still tracking the 2017 run.”
At press time, XRP traded at $2.1581.
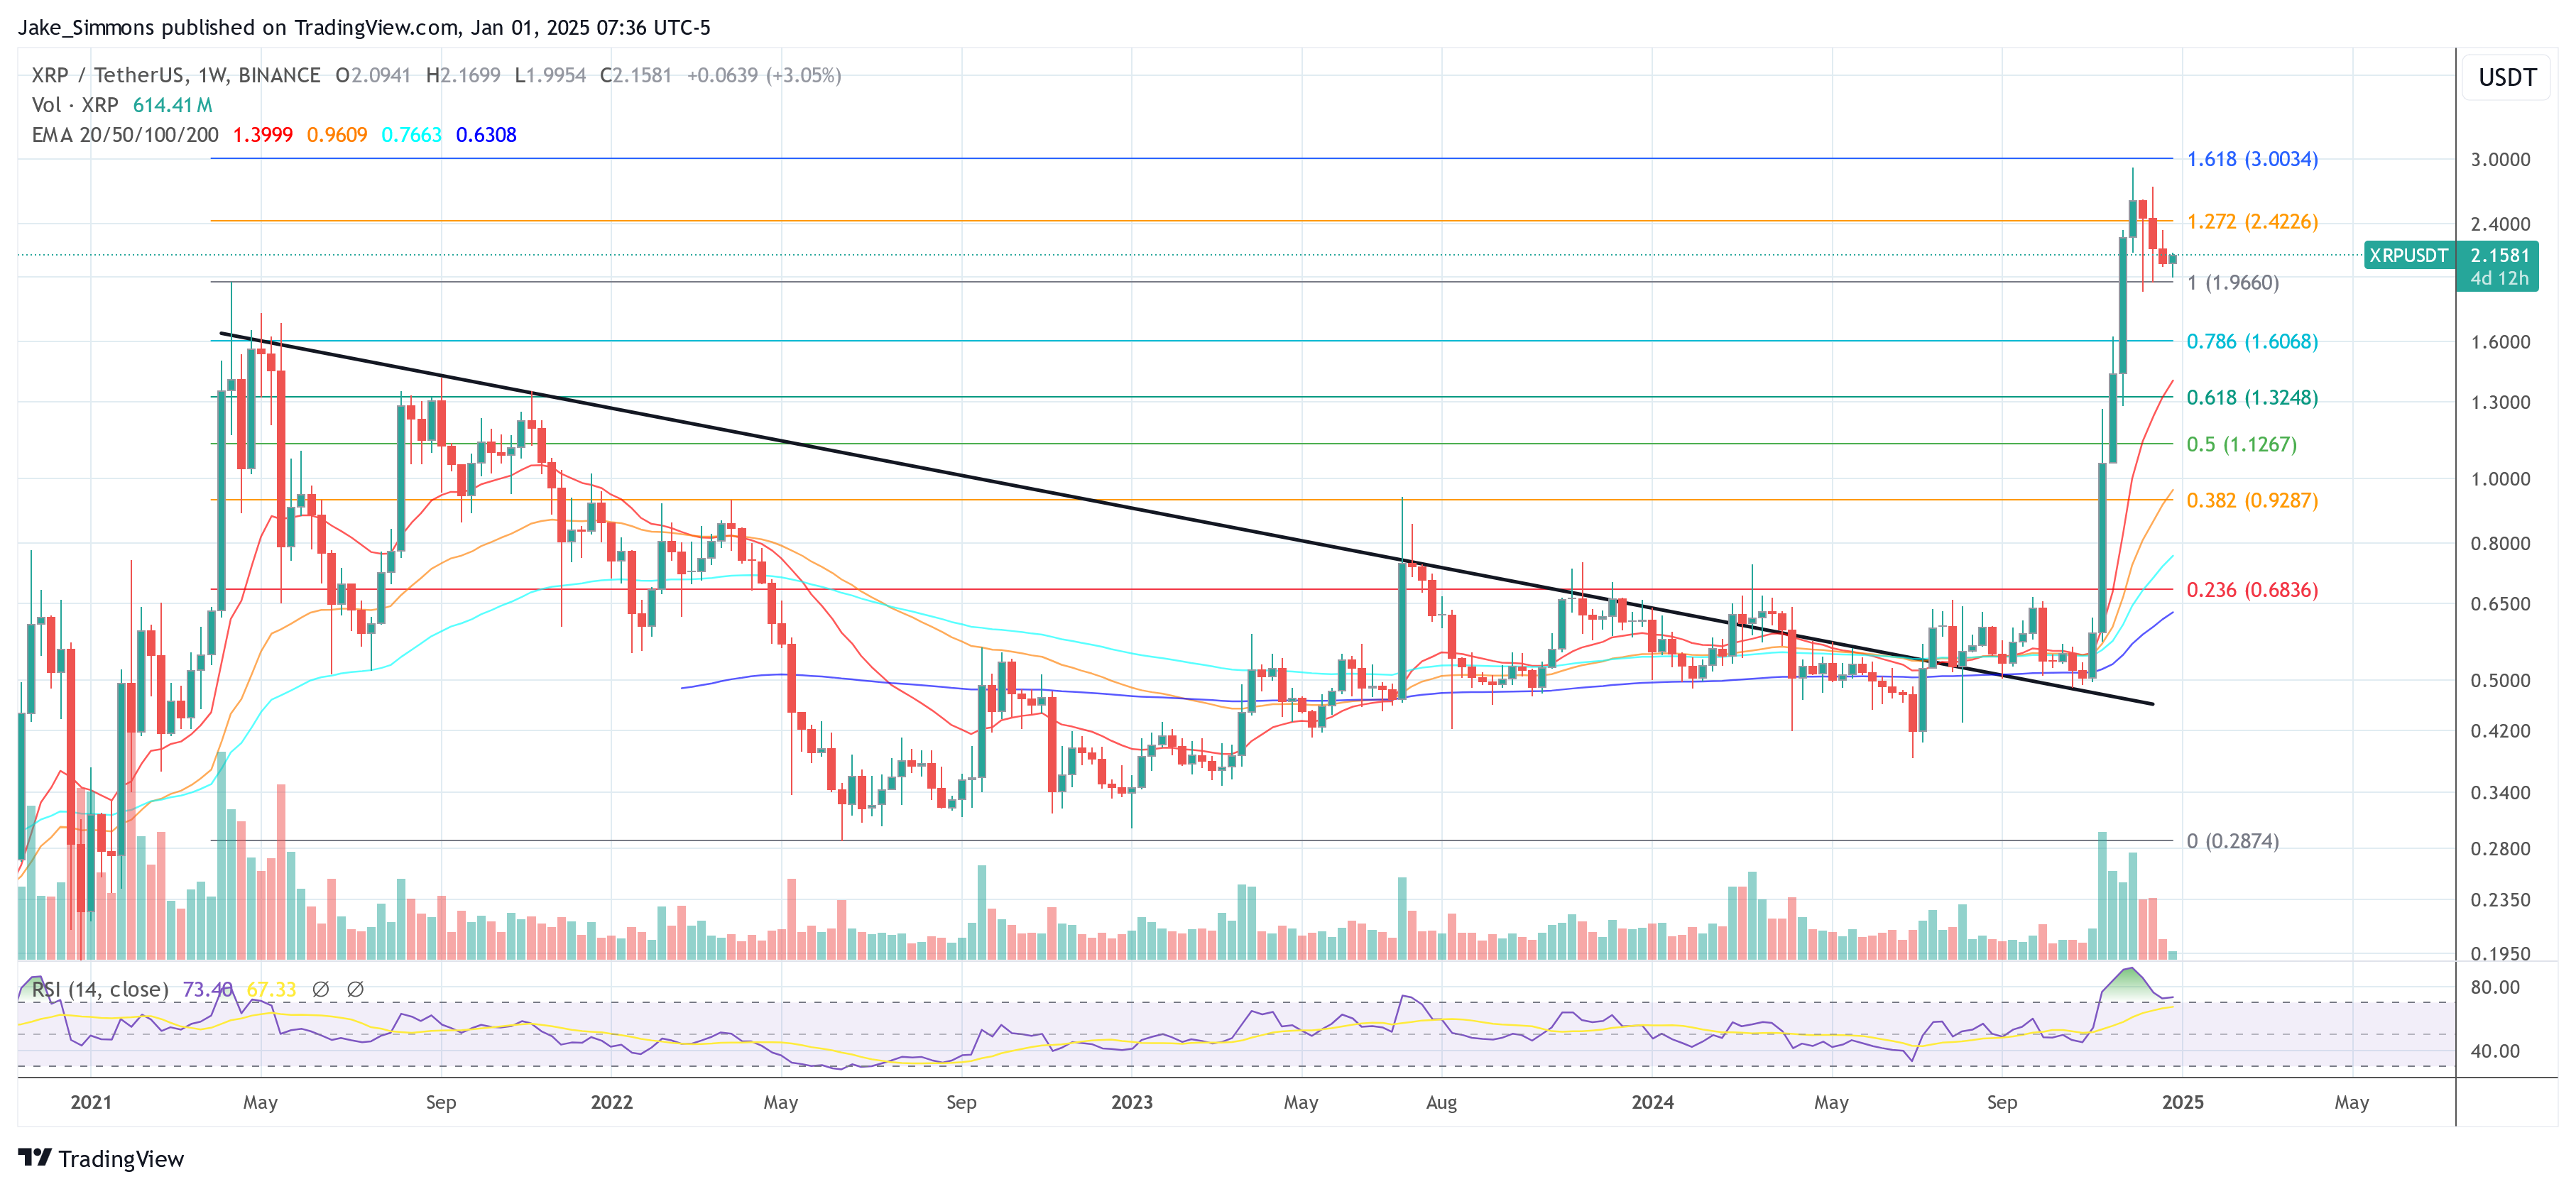
Featured image created with DALL.E, chart from TradingView.com
Source link
You may like


‘Big Short’ Investor Steve Eisman Derisks, Says Stock Market Volatility Will Be Here for a While

Dow drops over 500 points as UnitedHealth tanks, Fed tensions weigh on markets


Gold Is Still the Safe-Haven King, While Bitcoin Loses Out: JP Morgan


Dogecoin Price Breakout in view as Analyst Predicts $5.6 high


Bitcoin (BTC) Price in Standstill at $85K as Trump Increases Pressure on Fed’s Powell


Ripple acquisition Hidden Road secures FINRA registration

Reason to trust

Strict editorial policy that focuses on accuracy, relevance, and impartiality
Created by industry experts and meticulously reviewed
The highest standards in reporting and publishing
Strict editorial policy that focuses on accuracy, relevance, and impartiality
Morbi pretium leo et nisl aliquam mollis. Quisque arcu lorem, ultricies quis pellentesque nec, ullamcorper eu odio.
As the XRP price climbs back above the crucial $2 mark, reflecting a 20% surge over the past week, market analysts are increasingly optimistic about the token’s recovery and potential for setting new all-time highs (ATHs).
Expert analyst Maelius recently shared insights on social media platform X (formerly Twitter), suggesting that the current market dynamics support a bullish outlook for the XRP price.
XRP Price Could Target $10 In Conservative Case
Despite the recent price surge, some market participants remain skeptical about XRP’s trajectory. Maelius addressed these concerns, stating, “In a conservative case, I think XRP looks very bullish on higher time frames (HTFs).”
Historically, XRP has shown a pattern of respecting the 50-week Exponential Moving Average (EMA) during bull markets. Recently, the asset touched this EMA and rebounded, reinforcing the belief that it is on a positive trajectory.
Related Reading
In his social media update, Maelius outlined two scenarios for XRP’s future price movements: a conservative case and a more optimistic base case. In the conservative scenario, Maelius posits that XRP has completed its Wave 3 (W3) of a larger Elliott Wave cycle and is currently finalizing Wave 4. This suggests that XRP could expand into a final Wave 5, targeting $10.
The expert assigns a 35% probability to this conservative case, highlighting that price and Relative Strength Index (RSI) behaviors indicate a potential base formation around current levels before reaching new highs later in the year.
Maelius’s more optimistic scenario suggests that the top of Wave 3 may not have been reached yet. He points out that the accumulation phase for the XRP price has been longer than in previous cycles, indicating that the market may just be taking more time to develop.
In this case, the final W5 could extend into the first or second quarter of the next year, with targets ranging from $15 to $20 or higher.
Can Dominance Translate To Price Gains?
In addition to the XRP pprice analysis, Maelius examined the token’s market dominance, which indicates the token’s share within the broader cryptocurrency market.
The expert noted that while the token’s dominance has been preparing for a final upward move, this does not necessarily correlate with the XRP price reaching new highs.
The dominance metric, seen in the image below shared by Maelious, suggests that while XRP might underperform relative to other altcoins, it still has the potential for significant price appreciation.
Related Reading
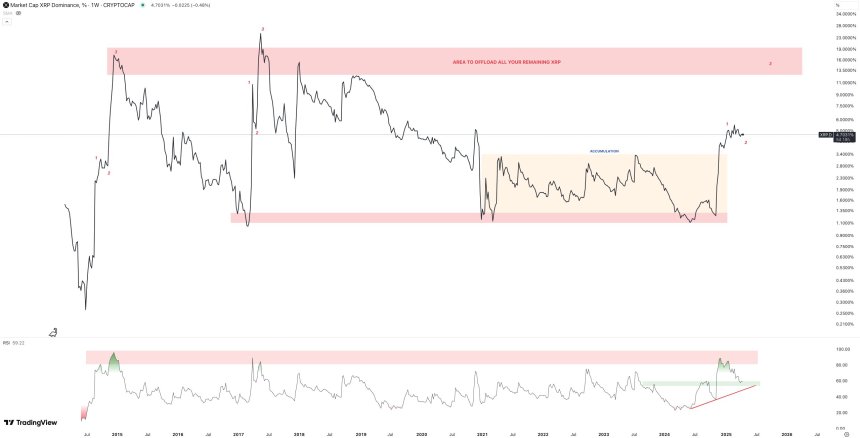
The 1-week RSI for the token’s dominance is currently in an uptrend and resting on horizontal support. If this support level fails, a diagonal support line could provide the next level of defense.
Historically, XRP’s dominance has experienced two major impulses during previous cycles, each reaching notable resistance areas. However, Maelius cautions that the growing size of the market makes it increasingly challenging for any single asset to achieve the same peaks as in prior cycles.
Featured image from DALL-E, chart from TradingView.com
Source link
Markets
XRP’s ‘Rising Wedge’ Breakdown Puts Focus on $1.6 Price Support
Published
2 days agoon
April 16, 2025By
admin
Payments-focused XRP’s immediate prospects look bleak, with its price chart flashing a “rising wedge” breakdown.
A rising wedge comprises two converging trendlines that connect higher lows and higher highs. This convergence suggests that upward momentum is weakening. When the price moves below the lower trendline, it signals a shift to a bearish trend.
XRP dived out of its rising wedge pattern during Wednesday’s early Asian hours, suggesting that the attempted recovery from the April 7 lows near $1.60 has likely lost momentum, allowing sellers to regain control.
According to technical analysis theory, analysts should identify the starting point of the rising wedge as the initial support level following the breakdown, which means XRP can now fall back to $1.60. The cryptocurrency has also fallen below the Ichimoku Cloud, a momentum indicator, on the hourly chart, reinforcing the bearish outlook indicated by the rising wedge breakdown.

Tuesday’s high of $2.18 is the level for bulls to beat to invalidate the bearish outlook.
Source link
Price analysis
5 Biggest Ripple (XRP) Price Predictions for April 2025
Published
2 days agoon
April 15, 2025By
admin
Fifteen days into April, Ripple (XRP) price has endured volaltile swings. Reacting to recent catalysts ranging from RLUSD rollout to wew SEC Chair Paul Atkins’ confirmation—prominent analysts have pegged bold XRP price forecasts between $1.80 and $4.50.
Ripple ( XRP) Predictions for April Diverge Widely as Market Volatility Mounts
In March 2025, Ripple secured a resounding win in its long-running case with the US Securities and Exchange Commission. This positive catalyst prompted many investors, market watchers and prominent cryptocurrency analysts to make audacious price predictions for April 2025.
However, with the month now at the half-way mark, fresh developments in the US trade war and new crypto-friendly SEC chief Paul Atkin’s finally taking office have pulled XRP in different volatility swings. This examines the biggest XRP price prediction for April 2025 have fared so far.
1. Changelly $2.12 support forecast still play
According to Changelly, a widely used crypto exchange known for its algorithmic forecasts, XRP is expected to trade between $2.12 and $4.52 this month, citing increasing volume and strong momentum.
That prediction arrived just days after Ripple price surged 10% in 24 hours to reach $1.99, driven by Bitcoin’s bullish move and a marketwide uptick in sentiment following the Trump administration’s decision to pause tariff hikes on key Chinese imports.
2. RLUSD narrative: Halli Uzzi’s $3 Breakout target remain within touching distance
Other analysts have echoed similar short-term bullishness. Crypto trader Hali_uzzi noted XRP’s fundamentals are strengthening, particularly due to the rollout of Ripple’s new U.S.-dollar stablecoin, RLUSD, and expanding institutional adoption.
The trader estimates a range of $2.50 to $3.00 in April, with the potential to climb toward $15 by May if adoption trends persist.
3. Investorie’s conservative outlook signals consolidation around $2.30
Meanwhile, another analyst posting under the Investorie pseudonym issued a more measured view, forecasting an April trading range between $1.80 and $2.90, with $2.30 labeled as the “realistic” price level.


This aligns closely with XRP’s recent technical structure, which shows support around $1.85 and resistance near the psychological $2.50 mark.
4. Cryptogeek $58,000 hype falters under bearish market sentiment
However, not all predictions have been tethered to market realities. A viral post by CryptoGeekNews citing Forbes projected an astronomical price of $58,000 per XRP—a level that would imply a market cap larger than the entire global money supply. While such extreme targets often capture attention, analysts widely regard them as speculative and not grounded in institutional flows or historical precedent.


Binance was referenced in an earlier post suggesting XRP could hit $600 in 2025, though no direct source was provided, and no mention was made of April-specific targets.
The post, however, speaks to the growing buzz surrounding a potential XRP ETF, which remains a topic of interest among investors betting on Ripple’s regulatory clarity and its real-time fiat settlement use case.
Looking Ahead:
Looking ahead, XRP’s ability to sustain April’s gains will likely depend on macroeconomic stability, crypto market leadership from Bitcoin, and Ripple’s success in onboarding institutions to the RLUSD framework. While triple- or quadruple-digit predictions make for sensational headlines, most expert analysts agree that a realistic target range for XRP this month sits between $2.30 and $4.50, barring any unforeseen catalysts.
- XRP Price Forecast Today: Eyes $2.35 With Bullish Momentum Building Above Key Support
XRP price is showing weakened bullish strength after reclaiming the mid-Bollinger Band level near $2.02,this week. However market volume indicators suggest upside continuation is possible if momentum holds.
Indicators on the 12-hour candle, shows XRP trades at $2.11, sitting comfortably above the Parabolic SAR at $1.83, which flips bullish when price closes above the blue dots. This alignment supports the case for an extended move higher, potentially toward the upper Bollinger Band at $2.27, with an intraday target of $2.35 if volume follows through.


While short-term price action has consolidated sideways, the contraction of the Bollinger Bands hints at an imminent breakout. A close above the March resistance zone near $2.20 could trigger that move. However, the Volume Delta shows persistent net selling over the past 48 hours, indicating weakened conviction behind the rally. A failure to break above $2.27 could invite sellers to retest the $2.02 mid-band and potentially expose the lower support zone at $1.76. Bulls need to maintain momentum or risk bearish reversal pressure creeping back in.
Frequently Asked Questions (FAQs)
Most analysts, including Investorie and Changelly, predict XRP trading between $2.30 and $4.50 this April, citing technical momentum.
No. While viral posts cite massive targets, such predictions lack credible fundamentals and are widely dismissed by serious market analysts.
Factors include Ripple’s SEC case win, RLUSD adoption, crypto-friendly policy shifts, and Bitcoin-led market sentiment.
ibrahim
Crypto analyst covering derivatives markets, macro trends, technical analysis, and DeFi. His works feature in-depth market insights, price forecasts, and institutional-grade research on digital assets.
Disclaimer: The presented content may include the personal opinion of the author and is subject to market condition. Do your market research before investing in cryptocurrencies. The author or the publication does not hold any responsibility for your personal financial loss.
Source link

‘Big Short’ Investor Steve Eisman Derisks, Says Stock Market Volatility Will Be Here for a While

Dow drops over 500 points as UnitedHealth tanks, Fed tensions weigh on markets

Gold Is Still the Safe-Haven King, While Bitcoin Loses Out: JP Morgan

Dogecoin Price Breakout in view as Analyst Predicts $5.6 high

Bitcoin (BTC) Price in Standstill at $85K as Trump Increases Pressure on Fed’s Powell

Ripple acquisition Hidden Road secures FINRA registration

Ethereum Whales Offload 143,000 ETH In One Week – More Selling Ahead?

How Do We Protect Bitcoin From Quantum Computers? Not With A Joke

OKX Goes Live In The US After Setting Up New Headquarters in San Jose, California

Stanford’s AI research lab to use Theta EdgeCloud for LLM model studies

Central African Republic Solana Meme Coin Jumps as President Fuels Rumors of Revival

Will Shiba Inu Price 3x?

Bitcoin Cash (BCH) Gains 4.2%, Leading Index Higher

Bybit shuts down four more Web3 services after axing NFT marketplace

Aptos To Continue Moving In ‘No Man’s Land’ – Can It Reclaim $5?

Arthur Hayes, Murad’s Prediction For Meme Coins, AI & DeFi Coins For 2025

Expert Sees Bitcoin Dipping To $50K While Bullish Signs Persist

Aptos Leverages Chainlink To Enhance Scalability and Data Access

Bitcoin Could Rally to $80,000 on the Eve of US Elections

3 Voting Polls Show Why Ripple’s XRP Price Could Hit $10 Soon

Crypto’s Big Trump Gamble Is Risky

Sonic Now ‘Golden Standard’ of Layer-2s After Scaling Transactions to 16,000+ per Second, Says Andre Cronje

Institutional Investors Go All In on Crypto as 57% Plan to Boost Allocations as Bull Run Heats Up, Sygnum Survey Reveals

Ripple-SEC Case Ends, But These 3 Rivals Could Jump 500x

The Future of Bitcoin: Scaling, Institutional Adoption, and Strategic Reserves with Rich Rines

Has The Bitcoin Price Already Peaked?

A16z-backed Espresso announces mainnet launch of core product

Xmas Altcoin Rally Insights by BNM Agent I

Blockchain groups challenge new broker reporting rule

I’m Grateful for Trump’s Embrace of Bitcoin
Trending

 24/7 Cryptocurrency News5 months ago
Arthur Hayes, Murad’s Prediction For Meme Coins, AI & DeFi Coins For 2025

 Bitcoin3 months ago
Expert Sees Bitcoin Dipping To $50K While Bullish Signs Persist

 24/7 Cryptocurrency News3 months ago
Aptos Leverages Chainlink To Enhance Scalability and Data Access

 Bitcoin5 months ago
Bitcoin Could Rally to $80,000 on the Eve of US Elections
 Ripple Price4 weeks ago
3 Voting Polls Show Why Ripple’s XRP Price Could Hit $10 Soon

 Opinion5 months ago
Crypto’s Big Trump Gamble Is Risky

 Altcoins3 months ago
Sonic Now ‘Golden Standard’ of Layer-2s After Scaling Transactions to 16,000+ per Second, Says Andre Cronje

 Bitcoin5 months ago
Institutional Investors Go All In on Crypto as 57% Plan to Boost Allocations as Bull Run Heats Up, Sygnum Survey Reveals


✓ Share: