
Bitcoin
Abra CEO Unveils Massive ‘Base Case’ Price Targets for Bitcoin, Ethereum, Solana and Sui

The chief executive of crypto exchange Abra believes Bitcoin (BTC) and other top digital assets may hit massive price targets this cycle for one main reason.
Bill Barhydt says that economic policies under US President Donald Trump may inject a huge amount of liquidity into the markets causing crypto assets to soar to astronomical prices.
Among his issued “base case” price targets for digital assets in the current cycle is that Bitcoin may increase by more than 259% from its current value. He also says that Ethereum (ETH) may increase by more than 200% from its current value.
Meanwhile, he says Solana (SOL) may increase by at least 350% from its current value and Sui (SUI) may increase by more than 676% from its current value.
“My base case for for current crypto cycle:
- Bitcoin: $350,000.
- Ethereum: $8,000.
- Solana: $900.
- Sui: $25.
The high end of range is ~2x these values. My model is simple. This administration wants interest rates much lower and they’ll do whatever they have to to achieve that. They also need to refinance over $7 trillion in debt. Tax cuts are coming. All of this equates to a massive liquidity injection whether via QE (quantitative easing) or some other means.”
He believes that market liquidity will start increasing within the first quarter of this year.
Bitcoin is trading for $97,449 at time of writing, up 1.7% in the last 24 hours. Meanwhile, Ethereum is trading for $2,662 at time of writing, up 1.5% on the day.
ETH competitor Solana is trading for $200 at time of writing, up 1.3% in the last 24 hours, while SOL rival Sui is trading for $3.22 at time of writing, up 8.8% on the day.
In April of 2024, Barhydt issued another big crypto outlook when he said the digital asset market capitalization has the potential to increase to $50 trillion within a decade due to the tokenization of real-world assets (RWAs).
Don’t Miss a Beat – Subscribe to get email alerts delivered directly to your inbox
Check Price Action
Follow us on X, Facebook and Telegram
Surf The Daily Hodl Mix
 

Disclaimer: Opinions expressed at The Daily Hodl are not investment advice. Investors should do their due diligence before making any high-risk investments in Bitcoin, cryptocurrency or digital assets. Please be advised that your transfers and trades are at your own risk, and any losses you may incur are your responsibility. The Daily Hodl does not recommend the buying or selling of any cryptocurrencies or digital assets, nor is The Daily Hodl an investment advisor. Please note that The Daily Hodl participates in affiliate marketing.
Generated Image: Midjourney
Source link


Bitcoin
Bitcoin Correction to $76,000 Likely a Downside Deviation, According to Crypto Analyst – Here’s Why

An analyst who accurately called Bitcoin’s correction in early 2024 believes BTC remains in a bull market after bouncing from a 2025 low of $76,000.
Pseudonymous analyst Rekt Capital tells his 542,00 followers on the social media platform X that Bitcoin’s current bull market cycle has yet to reach a peak.
“BTC bull market progress: 82.5%. (Progress will speed up on parabolic advances and slow down on deeper retraces).”
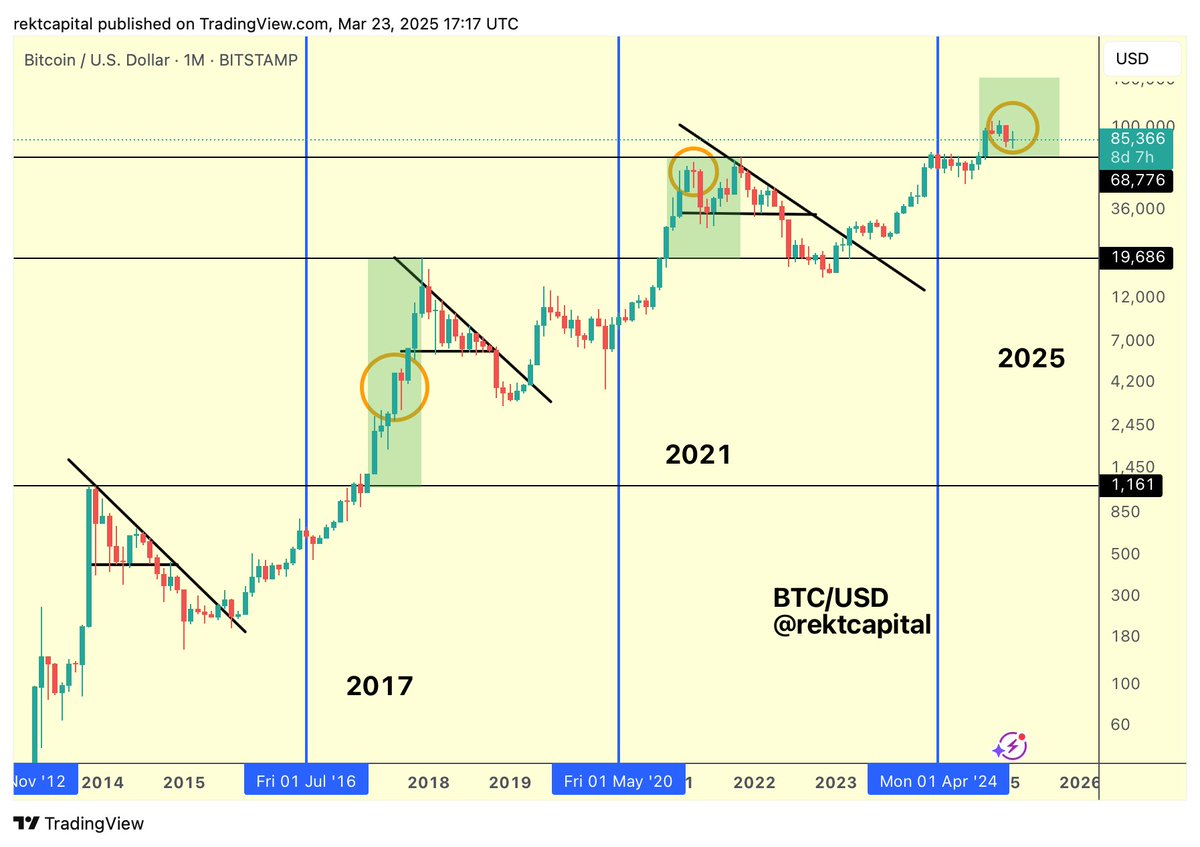
The analyst also tells his 107,000 YouTube subscribers that Bitcoin’s latest correction to $76,000 is not the sign of a beginning bear market based on historical precedence.
“Many people have been talking about this being a bear market, but it does look like it is a downside deviation period very similar to what we’ve seen back in the past. Obviously, these downside deviation periods are changing across time, but it’s really important to look at the charts in a level-headed manner and try and look at it in an unbiased way and not scream bear market whenever we see a pullback that is actually very similar to the one we saw here [in 2024].
This was a 32% pullback [in 2024]. This is a 30% pullback [when Bitcoin corrected to the $76,000 range this month], so very similar downside deviation in that regard, but really important to keep level-headed and look at the data, look at the chart, and zoom out when in doubt.”
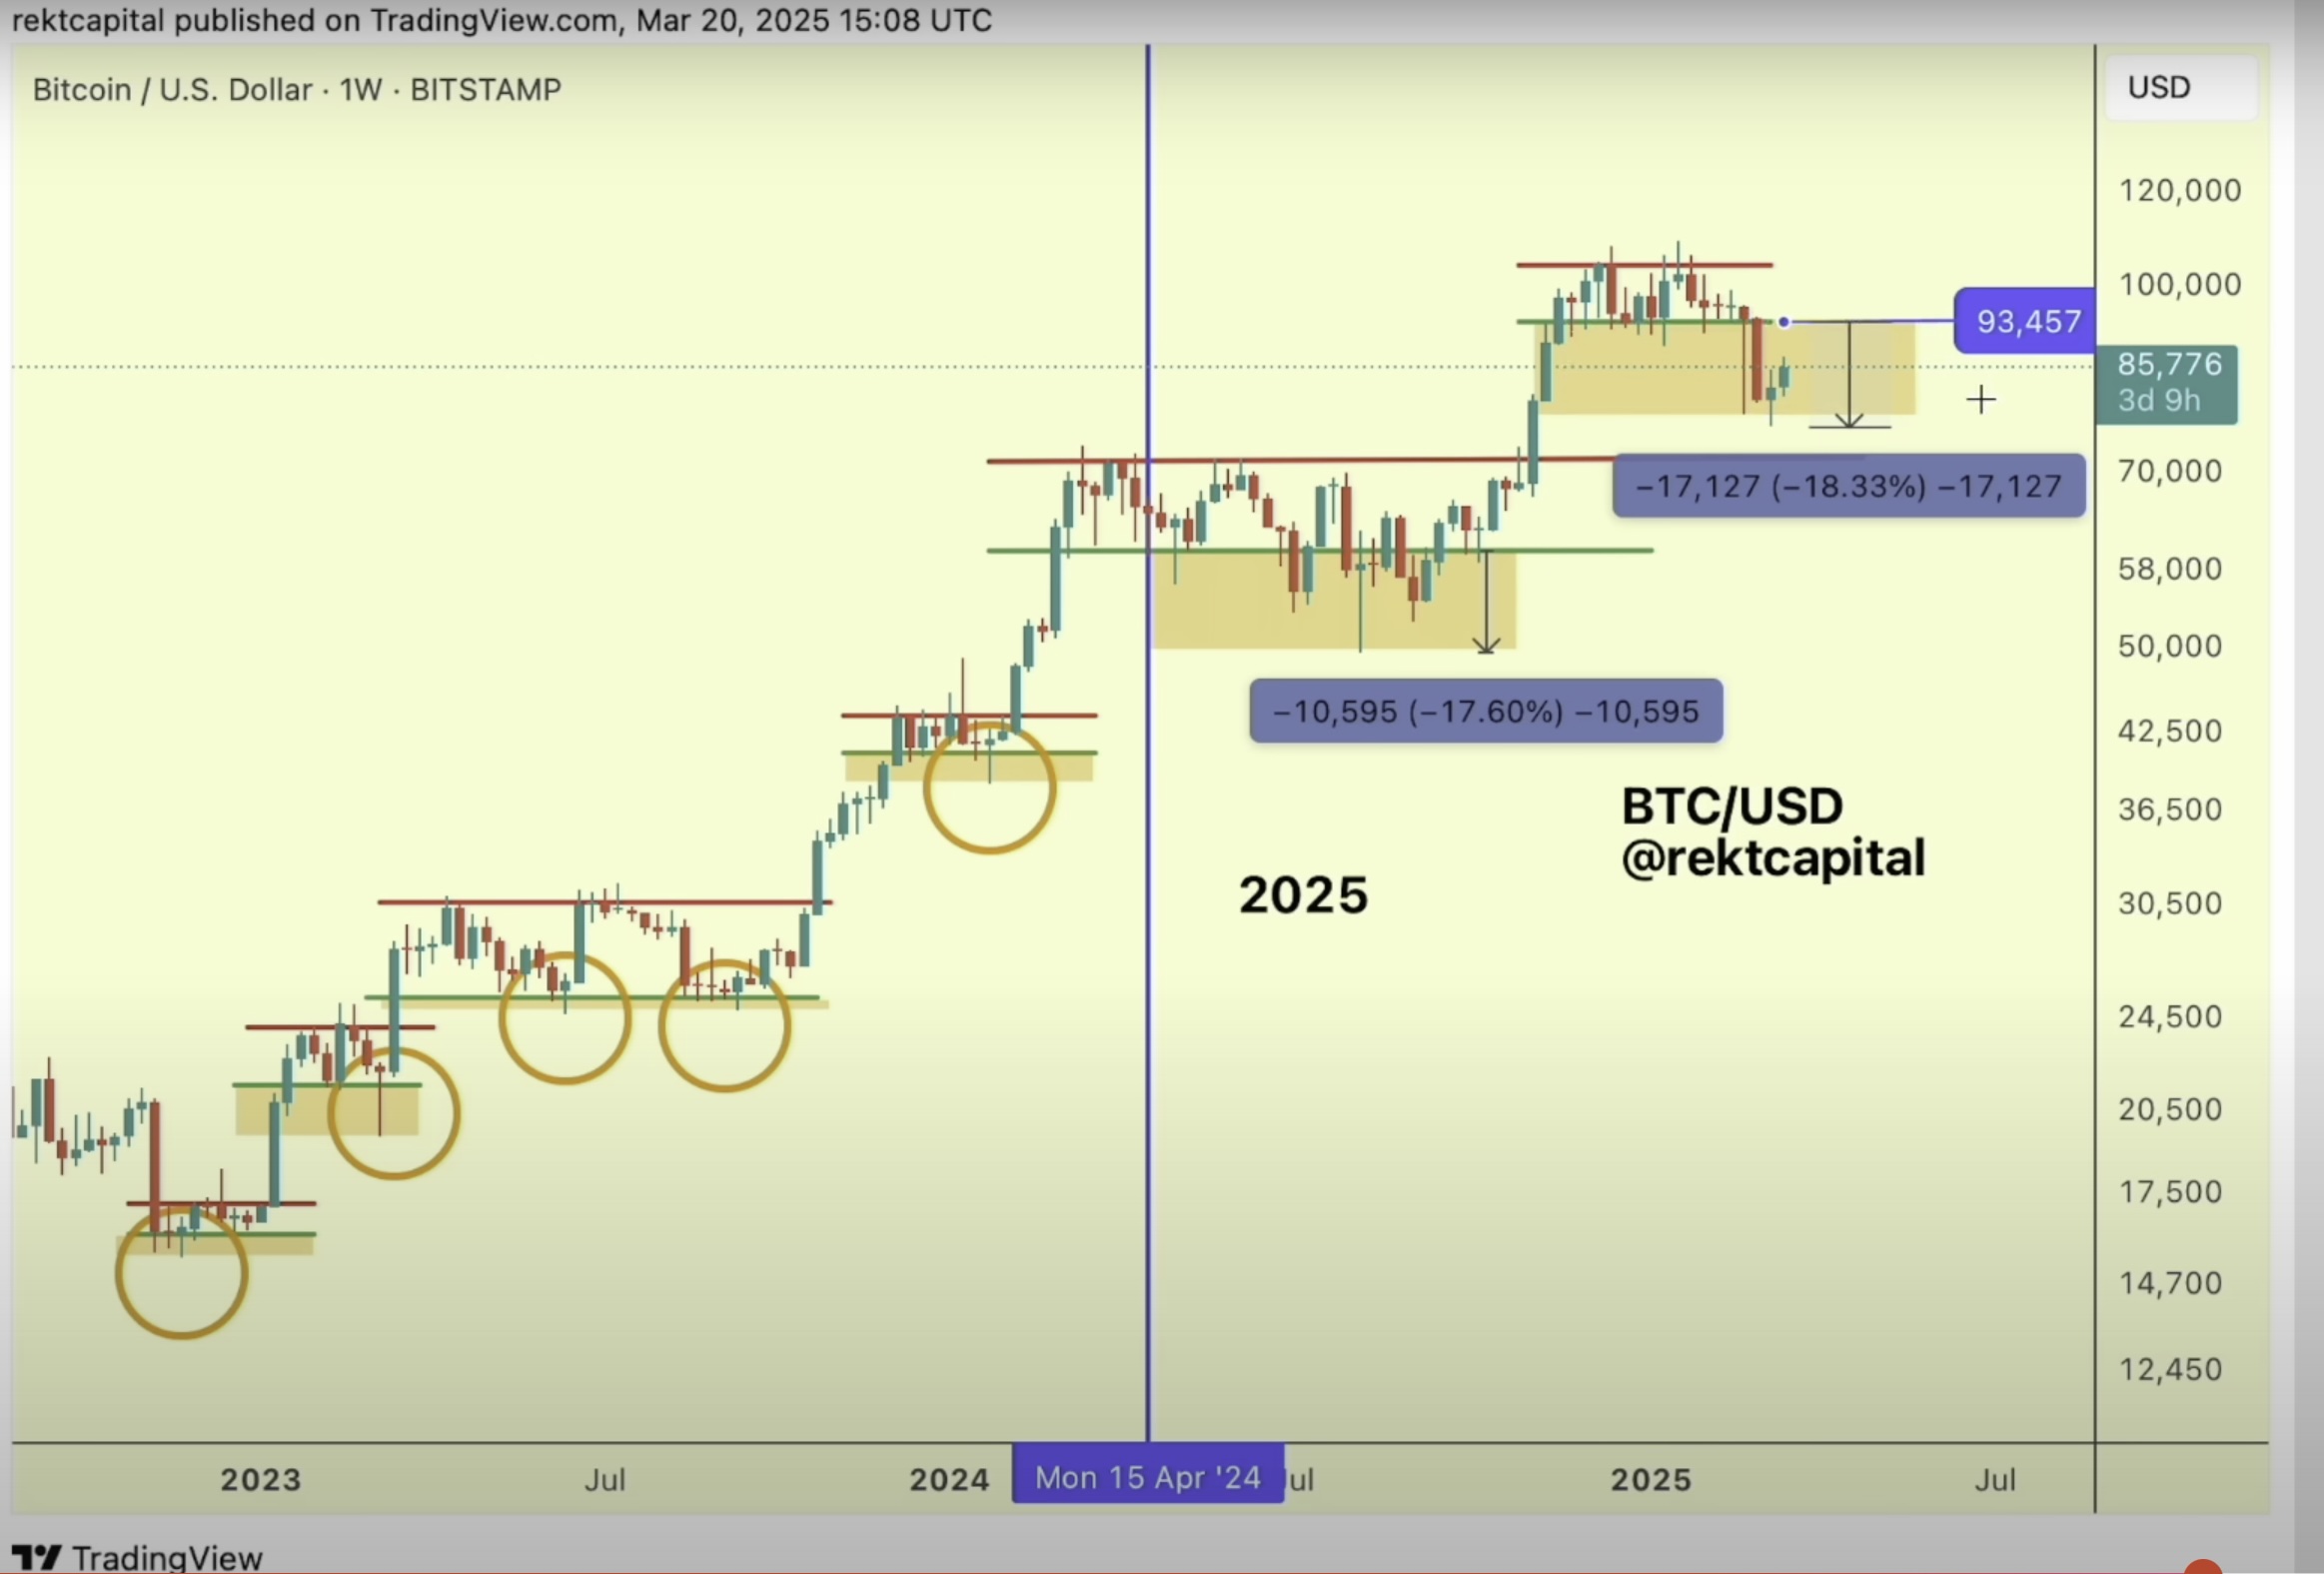
In technical analysis, a downside deviation is a setup where an asset breaks its immediate support to print a false breakdown before igniting a recovery and rallying to new highs.
Bitcoin is trading for $88,028 at time of writing, up 3.4% in the last 24 hours.
Follow us on X, Facebook and Telegram
Don’t Miss a Beat – Subscribe to get email alerts delivered directly to your inbox
Check Price Action
Surf The Daily Hodl Mix
 
Disclaimer: Opinions expressed at The Daily Hodl are not investment advice. Investors should do their due diligence before making any high-risk investments in Bitcoin, cryptocurrency or digital assets. Please be advised that your transfers and trades are at your own risk, and any losses you may incur are your responsibility. The Daily Hodl does not recommend the buying or selling of any cryptocurrencies or digital assets, nor is The Daily Hodl an investment advisor. Please note that The Daily Hodl participates in affiliate marketing.
Generated Image: Midjourney
Source link


Is Strategy quietly reshaping how public companies interact with capital markets — and could its $21 billion plan set a precedent for Bitcoin-aligned balance sheet plays?
Small fish, big splash
Strategy’s (previously MicroStrategy) role in U.S. capital markets is changing in ways that few would have predicted a few years ago. Known primarily as an enterprise software firm, the company became one of the biggest Bitcoin (BTC) proxies and most active participants in equity financing in 2024—despite accounting for just a small share of total market value.
As of Mar. 25, Strategy has a market capitalization of $87.64 billion, ranking it 109th among U.S. companies and 211th globally. On paper, that places it well below the largest public firms. Yet in terms of equity raised or announced in 2024, it stands out sharply.
According to Bloomberg Intelligence data shared by Matthew Sigel, Head of Digital Assets Research at VanEck, Strategy represents only 0.07% of the U.S. equity market by value, but accounts for 16% of all equity raised or announced in 2024.
A large portion of this came from two offerings. One was a $2 billion convertible note issuance completed in November 2024. The second, announced in October 2024, is a broader funding plan that aims to raise $21 billion over three years.
As of the end of Dec., $561 million had already been secured, much of it directed toward Bitcoin purchases — a strategy the company has increasingly aligned itself with over the past few years.
Within the software sector, these two transactions made up more than 70% of the $39.5 billion in fresh equity raised in 2024. That figure puts software ahead of every other sector in 2024 in terms of additional offerings, followed by biotechnology at $30.1 billion, oil & gas at $26.46 billion, REITs at $22.44 billion, and aerospace and defense at $21.13 billion.
Notably, only biotechnology and REITs have consistently ranked among the top five sectors in recent years. Strategy’s outsized presence in software makes its contribution unusually concentrated.
Few companies of Strategy’s size have moved this aggressively to tap equity markets in 2024. Fewer still have done so with such a narrow and defined purpose — accumulating Bitcoin through corporate balance sheet expansion.
In that sense, the company’s financial activity is less about conventional software growth and more about asset allocation at scale. Let’s decode what is happening behind the scenes
Strategy doubles down on its BTC thesis
Strategy has continued its Bitcoin acquisition strategy in early 2025, adding 6,911 BTC for approximately $584.1 million at an average price of $84,529 per coin, solidifying its position as the largest public company by BTC holdings.
As of Mar. 25, the company holds a total of 506,137 BTC, acquired for approximately $33.7 billion, with an average cost basis of $66,608. At Bitcoin’s current market price of around $87,000, Strategy’s holdings are valued at over $44 billion, reflecting an unrealized gain of about $10.3 billion, or roughly $20,392 per BTC.
Year-to-date, the company has recorded a 7.7% BTC yield. This latest acquisition came shortly after Strategy reaffirmed its plans to raise capital via Class A strike preferred stock.
While the filing specifies that funds may be used for “general corporate purposes,” prior behavior suggests a large portion will likely be allocated to crypto asset accumulation.
Strategy’s approach diverges sharply from other corporate Bitcoin holders. For example, Tesla holds about 11,500 BTC, while Block (formerly Square) holds a little more than 8,000 BTC. Both firms made their purchases years ago and have largely held static positions.
In contrast, Strategy’s has conducted multiple acquisitions nearly every quarter since 2020 and remains the only publicly traded company with a defined strategy of accumulating Bitcoin as a primary treasury reserve asset.
$MSTR stock continues to mirror Bitcoin price trends. On Mar. 24, amid a strong rebound in U.S. equities — where the Nasdaq rose 2.27% — Strategy shares jumped over 10%, closing at $335.72, translating into a single-day market cap increase of roughly $8 billion, even though no major business update or earnings event occurred.
The correlation here is not incidental. Historically, MSTR has exhibited a beta of over 2.0 relative to Bitcoin, meaning it tends to amplify BTC’s price movements in both directions.
However, this strategy is not without risk. The company carries over $4 billion in long-term debt, much of it tied to convertible notes that mature between 2028 and 2032.
In the event of prolonged Bitcoin drawdowns or tightening capital markets, Strategy may face constraints on its ability to refinance or raise fresh capital.
As of its latest filings, the firm holds minimal cash reserves relative to its debt exposure, highlighting its reliance on BTC price appreciation to maintain balance sheet strength.
STRK and financial engineering
Earlier this year, Strategy introduced a new kind of financial instrument called STRK, which is short for its Series A Perpetual Strike Preferred Stock.
STRK is not a regular stock like MSTR, nor is it a traditional bond. Instead, it sits somewhere in between—designed to raise money without putting immediate pressure on existing shareholders.
STRK was launched in Jan. 2025 as part of Strategy’s larger goal to raise $42 billion over three years—to support its ongoing Bitcoin strategy. The company initially offered 7.3 million STRK shares at $80 each, raising about $563 million, more than double what it had aimed for.
So what exactly does STRK offer investors? For starters, it pays an 8% annual dividend, which Strategy can choose to pay in cash or stock. That steady income has made STRK attractive to investors looking for a more stable way to gain some Bitcoin exposure, without the sharp price swings of common stocks like MSTR or Bitcoin itself.
There’s also a conversion feature built in: if MSTR’s stock price ever reaches $1,000, each STRK share can be converted into 0.1 shares of MSTR. But with MSTR trading at around $335 as of Mar. 25, that conversion isn’t in play right now.
Since it started trading in early Feb., STRK has held up relatively well. The current market price of around $86.6 means investors are earning close to a 7% effective yield, which is high by most standards.
Compared to regular shares, STRK gives Strategy some key advantages. It helps raise capital without immediately issuing more MSTR stock, avoiding direct dilution of existing shareholders. It also attracts a different kind of investor—someone who wants income and stability, rather than just betting on Bitcoin’s long-term growth.
Still, STRK isn’t risk-free. Its value is tied to Strategy’s overall performance, which is closely linked to Bitcoin. If Bitcoin prices drop or the company faces pressure to meet dividend obligations, STRK could lose some of its appeal.
What this means for public markets
Strategy’s positioning in 2024 offers a clear case study in how capital markets are adapting to the presence of digital assets — not through the creation of new asset classes, but by stretching existing ones.
The company has emerged as a leading source of equity issuance this year, while maintaining a market value of just 0.07% of total U.S. equities, highlighting an evolving investor appetite for exposure to asset strategies delivered through listed entities.
In doing so, Strategy has set a tone for how public companies might be used as intermediaries between traditional capital and decentralized assets. It also reflects the maturing interface between regulated financial instruments and crypto-native strategies.
What happens next depends less on Strategy itself and more on broader conditions: the cost of capital, Bitcoin’s role in institutional portfolios, and how regulators and investors treat these hybrid models.
If funding remains accessible and crypto retains demand as an alternative store of value, similar structures may emerge. If not, the model could remain singular.
In either case, Strategy has pushed public markets into new territory, where capital allocation, balance sheet strategy, and digital asset exposure now operate on the same axis.
Source link

Bitcoin Correction to $76,000 Likely a Downside Deviation, According to Crypto Analyst – Here’s Why

GameStop Approves Adding Bitcoin To Treasury Reserves

Cboe Exchange Submits Filing to List Fidelity Solana ETF

How Strategy is Redefining Corporate Leverage?

Tokenized Treasuries Hit $5B Milestone as Fidelity Investments Touts RWA Potential as Collateral

Cardano Price Eyes $0.85 as Whales Scoop Up 240 Million ADA

Dogecoin Price Mirroring This 2017 Pattern Suggests That A Rise To $4 Could Happen

SEC closes investigation into Immutable nearly 5 months after Wells notice

Solana Rises As BlackRock Brings Its $1,700,000,000 Tokenized Treasury Fund to Ethereum Rival’s Chain

BlackRock Launches Bitcoin ETP In Europe

Crypto holds on to Gains, US may reverse Biden BTC sales, Tesla leads bounce

Cardano price could surge to $2 as whale purchases rise

Bitcoin Cash (BCH) Falls 1.9%, Leading Index Lower

Analyst Sets ‘Conservative’ XRP Price Target At $15, What’s Next?

XRP Breakout On Hold? Financial Expert Reveals What’s Missing


 24/7 Cryptocurrency News5 months ago
Arthur Hayes, Murad’s Prediction For Meme Coins, AI & DeFi Coins For 2025

 Bitcoin2 months ago
Expert Sees Bitcoin Dipping To $50K While Bullish Signs Persist

 24/7 Cryptocurrency News3 months ago
Aptos Leverages Chainlink To Enhance Scalability and Data Access

 Bitcoin5 months ago
Bitcoin Could Rally to $80,000 on the Eve of US Elections

 Altcoins2 months ago
Sonic Now ‘Golden Standard’ of Layer-2s After Scaling Transactions to 16,000+ per Second, Says Andre Cronje

 Bitcoin4 months ago
Institutional Investors Go All In on Crypto as 57% Plan to Boost Allocations as Bull Run Heats Up, Sygnum Survey Reveals

 Opinion5 months ago
Crypto’s Big Trump Gamble Is Risky

 Price analysis5 months ago
Ripple-SEC Case Ends, But These 3 Rivals Could Jump 500x
