
Price analysis
Analyst Confirms Next ATH For Solana Price
Solana price, a Layer 1 blockchain, has showcased remarkable growth in the cryptocurrency market, surging notably since November’s start. This bullish momentum aligns with a wider market recovery, signaling potential for further gains. Analysts suggest that Solana may be gearing up for a breakout, as its current consolidation phase hints at new all-time highs on the horizon.
Analyst Predicts Solana Price Next ATH Surge
Crypto analyst recently tweeted an insightful prediction regarding Solana’s price trajectory. Based on technical analysis, the analyst forecasts a potential surge toward new all-time highs (ATH). The current price movement reflects consolidation within a descending channel, which may signify a bullish continuation pattern.
Solana price has experienced impressive gains over the past months, recovering from its previous lows. Now trading around $223, the analyst highlights the next significant resistance zone at $420.68. This level remains crucial as it marks Solana’s previous all-time high.
The chart analysis shows SOL forming higher lows, a strong bullish signal for further upward momentum. Breaking out of the current channel could lead to a powerful rally toward the target price.

Will SOL Price Reclaim Its ATH Soon?
At the time of writing, the SOL price has seen a slight decline, trading at $220.08. This marks a 0.85% drop within the last 24 hours. The cryptocurrency touched a low of $215.34 and reached a high of $223.01 during this period. However, it still sits 16.43% below its all-time high of $263.83, achieved on November 23, 2024. With the surge in crypto market like BTC hovering above $100k may fuel the bullish optimism.
If the bullish pressure regains control, the SOL price prediction could hit $263, approaching its previous all-time high (ATH). Should buyers sustain momentum, Solana’s price might surge further to $300, with a possibility of testing the $420 resistance zone. However, if bears take charge, the price could fall back to $200.
The Moving Average Convergence Divergence (MACD) indicator reflects a bearish outlook as the MACD line currently trends below the signal line. The histogram also shows declining green bars, signaling reduced bullish strength.
The Relative Strength Index (RSI), SOL remains in a neutral zone with a reading of 46.44. This level suggests a balance between buyers and sellers but highlights a lack of immediate bullish momentum.

According to Coinglass Data, (SOL) derivatives market has shown a notable uptick in performance. Trading volume surged by 3.12%, reaching a total of $5.74 billion.
Open interest, another key market indicator, climbed by 4% to $5.34 billion. These figures reflect growing investor activity and interest in Solana’s derivatives segment.

Solana’s price shows potential for a breakout toward new all-time highs, with bullish consolidation patterns and growing investor interest. However, market conditions and technical indicators suggest caution in the short term.
Frequently Asked Questions (FAQs)
Solana’s all-time high is $263.83, reached on November 23, 2024.
Yes, Solana is currently consolidating in a bullish pattern, with higher lows indicating potential for further gains.
A breakout from the current consolidation phase and sustained buying momentum could drive Solana’s price toward new ATHs.
Coingape Staff
CoinGape comprises an experienced team of native content writers and editors working round the clock to cover news globally and present news as a fact rather than an opinion. CoinGape writers and reporters contributed to this article.
Disclaimer: The presented content may include the personal opinion of the author and is subject to market condition. Do your market research before investing in cryptocurrencies. The author or the publication does not hold any responsibility for your personal financial loss.
Source link


Bitcoin (BTC) showed strength over the weekend after a 2.45% rally to the upside. This minor rally aligns with the US stock market’s positive outlook and rising global liquidity, which promotes a risk-on behavior among investors. With the global liquidity index’s Z score flashing a buy signal, Bitcoin price could be set for explosive growth in the near future.
Bitcoin Price Today
Bitcoin price today is up 1.39%, continuing its weekend rally, slowly approaching the $90,000 psychological level. BTC saw a 4.24% gain last week, marking the second positive week after a brutal 15% sell-off in the first week of March.
Odds of BTC Rally Improves as Global Liquidity Explodes
According to data provider Alpha Edge, the traditional Global Liquidity Index is not a great tool to track. However, the Z-score of this metric shows that every time the liquidity index has fallen to -3, it was a strong buy signal. On the other hand, a +3 reading of the Z score is a sell signal. After the early March crash, the Global Liquidity Index flashed a buy signal, suggesting that an explosive uptrend is next for BTC price.
“The Divergence metric between Global Liquidity and Bitcoin has flashed a rare green buy signal. Historically, every green buy or red sell offered a good opportunity to add or sell.”

With abundant liquidity, risk-on behaviour is a must, as seen in late 2021 and 2023, which were followed by periods of exponential rally in BTC price.
Reduced Selling Pressure Points to Bullish Bitcoin Outlook
Adding credence to this outlook is the net Taker Volume indicator that has been reducing since late February 2025. A decline in this metric shows that the selling pressure is dwindling, which further hints at a potential bullish reversal in Bitcoin price trend.
Analyst Axel Adler Jr, who pointed out this outlook, says,
“In the absence of negative macroeconomic or market catalysts, the current week holds potential for moderate growth.”

In conclusion, the two positive weekly closes, coupled with increasing global liquidity and declining taker volume, hint at a bullish Bitcoin price prediction. Let’s explore key BTC levels to watch for when this scenario unfolds.
Key BTC Price Levels to Watch as $1.5B Positions At Risk of Liquidation
Liquidation map data from CoinGlass shows that $87,813 is critical; a BTC price breakout above this could liquidate $640 million worth of short positions. On the contrary, a breakdown below $85,633 will liquidate $942 million in long positions
In total, a spike in Bitcoin price below $85,633 followed by a continuation of the uptrend toward $90K could result in a liquidation event earily worth more than $1.5 billion.

Conclusion
The combination of the Global Liquidity Index’s Z score flashing a buy signal, declining net Taker Volume, and positive weekly closes suggests that Bitcoin price is set for an explosive growth in the near future.
Akash Girimath
Senior Cryptocurrency Analyst & Market Strategist
Engineer-turned-analyst Akash Girimath delivers data-driven insights on cryptocurrency markets, DeFi, and blockchain technology for platforms like AMBCrypto and FXStreet. Specializing in technical analysis, on-chain analytics, and risk management, he empowers institutional investors and retail traders to navigate market volatility and regulatory shifts.
A hands-on strategist, Akash merges active crypto portfolio management with research on Web3, NFTs, and tokenomics. At AMBCrypto, he led cross-functional teams to redesign content frameworks, achieving record-breaking traffic growth through scalable editorial strategies. His analyses dissect market sentiment, investment strategies, and price predictions, blending macroeconomic trends with real-world trading expertise.
Known for mentoring analysts and optimizing workflows for high-impact reporting, Akash’s work is cited across global crypto publications, reaching 500k+ monthly readers. Follow his insights on YouTube, X, and LinkedIn for cutting-edge perspectives on decentralized ecosystems and crypto innovation.
Disclaimer: The presented content may include the personal opinion of the author and is subject to market condition. Do your market research before investing in cryptocurrencies. The author or the publication does not hold any responsibility for your personal financial loss.
Source link
Bitcoin’s price rose 2.6% on Sunday, March 23, crossing the $86,000 mark after a three-day consolidation around $84,000. With growing market optimism following the recent Fed rate pause, speculative BTC traders deployed increased leverage over the weekend. Will BTC advance above $90,000, or will it reverse to $80,000 in the week ahead?
Bitcoin (BTC) Retakes $85,500 After Three-Day Consolidation
After a prolonged consolidation phase, Bitcoin (BTC) made a major recovery bounce on Sunday. Following Trump’s appearance at Blockworks’ Digital Asset Summit, many short-term traders opted to take profits on their BTC holdings.
Despite the decline, Bitcoin continues to find buyers, as the recent U.S. Fed rate pause announced on Wednesday prompted macro-sensitive capital to flow toward risky assets.

Bullish tailwinds from the Fed rate pause counteracted the downward pressure from profit-taking, leading to a three-day stalemate at the $84,000 level since Thursday.
However, as sell-side pressure subsided, BTC price recorded a major breakout above $86,000 on Sunday, March 23. The chart above shows how BTC rose 2.6%, hitting a daily peak of $85,600.
BTC Options Volume nears $800M as Whales Return After Fed Rate Pause
Bitcoin price demonstrated remarkable resilience consolidating around $84,000 over the past three days, as macro-sensitive institutional investors reassess their stance on U.S. economic policies.
Earlier this month, fears of inflationary pressure from Trump’s proposed tariffs triggered a cautious retreat from risk assets, including Bitcoin. However, with recent CPI and PPI reports showing inflation cooling and the Federal Reserve opting to pause rate hikes, large investors appear to be re-entering the market.
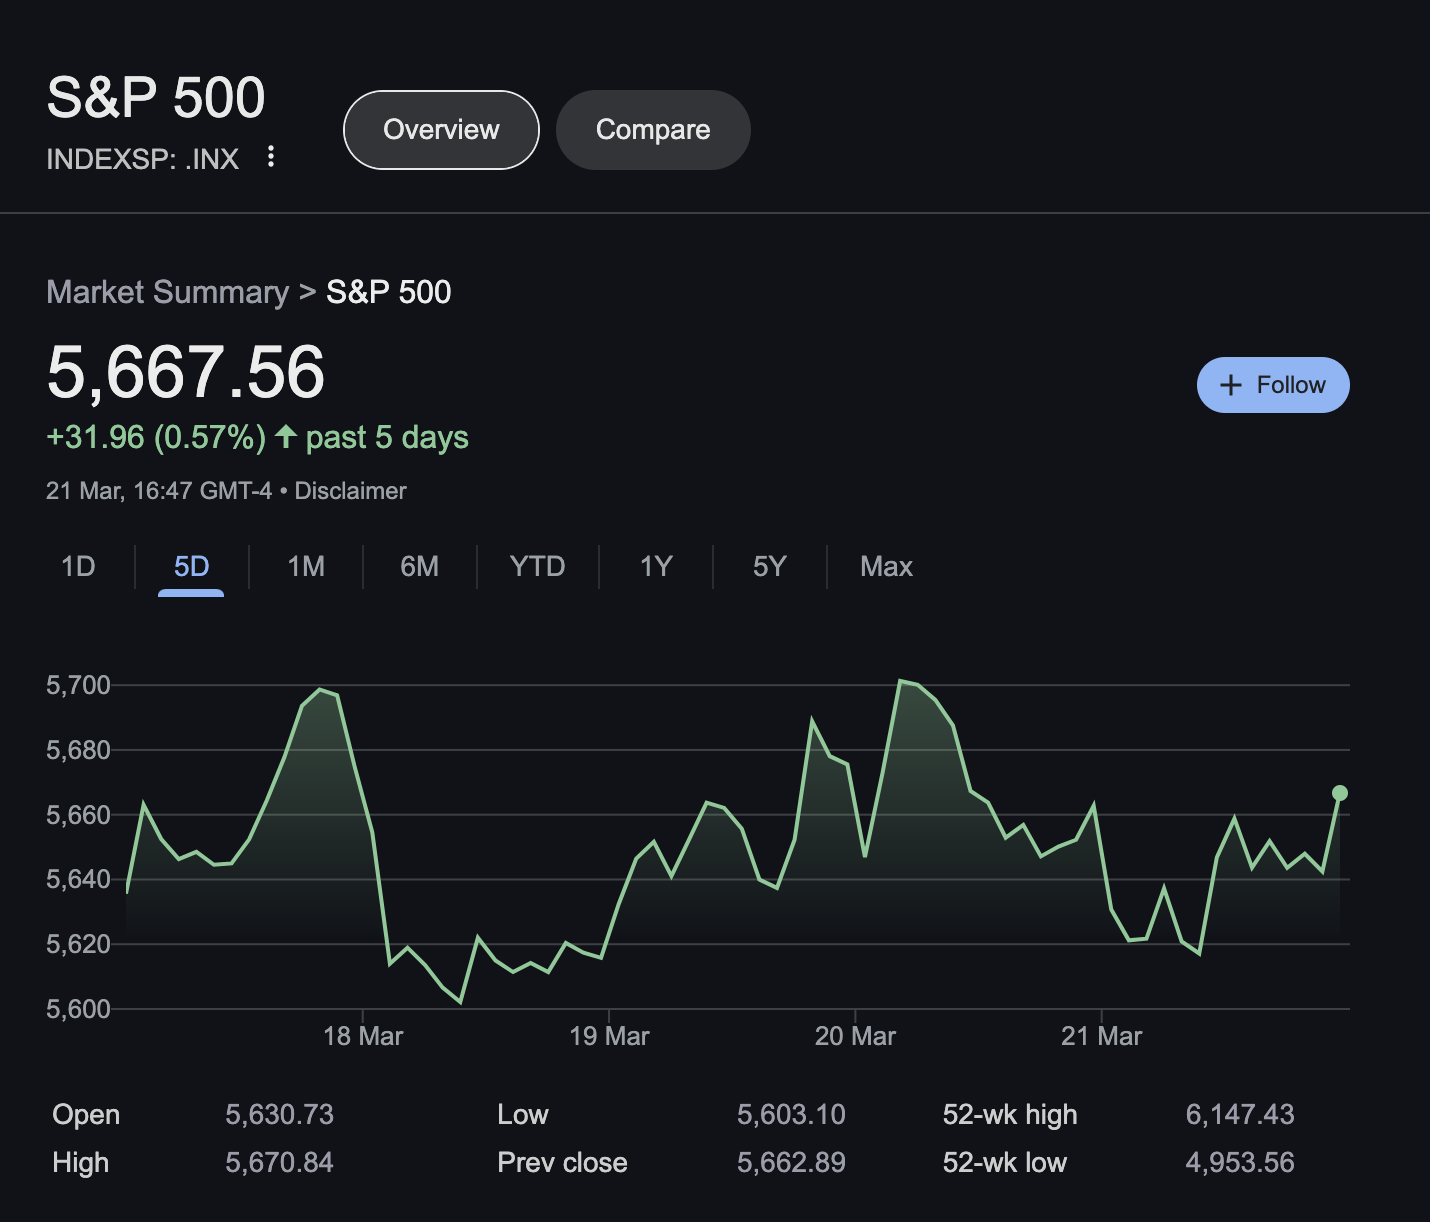
This shift in sentiment is reflected in broader financial markets. The S&P 500 surged by 32 points following the Fed rate pause, signalling renewed risk appetite. As Bitcoin mirrors this trend, it has seen a sharp uptick in speculative trading activity from large investors.
Validating this stance, Coinglass derivatives market data shows BTC’s options trading volume skyrocketed 24% in the last 24 hours, pushing total volume above $793 million.

What Does 24% Options Trading Surge Mean for Bitcoin Price Action This Week?
Options trading is a derivatives market strategy that allows traders to bet on the future price movements of an asset without directly purchasing it. This technique is particularly popular among institutional investors and whales because leverage enables traders to control large positions with relatively small capital, amplifying returns, especially during periods of market volatility.
Given that options trading volume surged 24% over the last day, it suggests that whales and institutional investors are taking bullish positions on BTC’s near-term price movements.
Why is BTC Options Volume Rising?
The renewed interest in BTC options trading aligns with key macroeconomic narratives:
- Fed Rate Pause Fuels Risk Appetite – With the Fed pausing rate hikes, liquidity-sensitive assets like Bitcoin become more attractive.
- S&P 500 Rally Indicates Broader Market Confidence – TradFi investors reallocating capital to stocks may also be expanding exposure to BTC.
- Altcoin Season Rotation – With BTC holding steady above $85,000, traders are betting on volatility to capture short-term gains.
Bitcoin Price Forecast: Data Supports Bullish Outlook, But $90K Flip Unlikely
Beyond options trading, other key metrics reinforce a positive BTC outlook for the week ahead:
- Open Interest Rose 3.88% to $54.04B – A sign that new capital is entering the derivatives market.
- Long/Short Ratio at 1.28 on OKX & 1.2217 on Binance – Indicates more traders are placing long bets.
- Liquidations Favor Shorts – Over the last 12 hours, $14.2M in short positions were wiped out, compared to just $2.82M in longs.
With Bitcoin showing strong demand above $86,000 and institutional investors actively positioning through options, a bullish breakout toward $90,000 remains a distinct possibility. However, signals on the daily Bitcoin price forecast charts below suggest the rally could face significant resistance below the $90,000 mark.
Despite these bullish signals, the technical chart presents a nuanced picture. While Bitcoin has reclaimed $85,600, the looming death cross—where the 50-day moving average trends below the 200-day moving average—remains a cause for concern. This bearish formation suggests that unless BTC can decisively break above $87,200, a retracement toward the $80,000 region remains plausible.
Bulls must clear this key resistance zone to sustain momentum toward $90,000. If BTC fails to establish support above $87,200, bears could regain control, triggering a potential pullback.
Frequently Asked Questions (FAQs)
Bitcoin’s bullish momentum suggests it could approach $90,000, but resistance around $87,200 and technical signals indicate potential pullbacks.
Institutional investors and whales are increasing leverage after the Fed rate pause, betting on Bitcoin’s near-term price movement.
The Fed rate pause, stock market trends, and increased institutional activity in options trading are driving Bitcoin’s recent price movements.
ibrahim
Crypto analyst covering derivatives markets, macro trends, technical analysis, and DeFi. His works feature in-depth market insights, price forecasts, and institutional-grade research on digital assets.
Disclaimer: The presented content may include the personal opinion of the author and is subject to market condition. Do your market research before investing in cryptocurrencies. The author or the publication does not hold any responsibility for your personal financial loss.
Source link
Altcoins have been attracting investor attention this weekend, with Bitcoin and Ethereum prices stagnating around $85,000 and $2,000, respectively, since Friday. Prominent crypto analysts have published data insights showing investors are increasingly rotating capital toward altcoins after recent U.S. macroeconomic updates.
Analysts Predict Altcoin Season as Fed Rate Pause Triggers Risk-On Appetite
The altcoin market had a rough start to March 2025 when U.S. President Donald Trump announced new tariffs on Canada and Mexico. However, the macroeconomic landscape has since improved. The Trump administration made adjustments to the tariffs, while U.S. CPI and PPI data indicated that inflation risks from the tariffs were overestimated.
This shift in sentiment was further reinforced after the latest Federal Open Market Committee (FOMC) meeting on Wednesday, where the U.S. Federal Reserve announced a pause in interest rate hikes.

Traditional finance (TradFi) investors reacted by moving capital out of safe-haven assets like gold and into stocks, pushing the S&P 500 up by 31.7 points last week.
Crypto markets appear to be following suit, with traders increasingly rotating funds from Bitcoin and Ethereum into altcoins.
Crypto Analysts Signal Imminent Altcoin Breakout
Adding to the growing optimism around altcoins, two major crypto analysts took to social media to highlight technical indicators pointing to an incoming “Alt Season”—a market phase where altcoins significantly outperform Bitcoin.
“2025 #ALTSEASON starts in less than 3 days now,” alongside a chart illustrating past cycles of altcoin dominance relative to Bitcoin.
Crypto analyst Sensei (@SenseiBR_btc) made a bold declaration, March 21, 2025 ,

The accompanying chart showed clear historical patterns where altcoins surged against Bitcoin, with a third major rally seemingly about to begin.
In response, OBI Real Estate (@Obirealestate) weighed in on the discussion, adding, “Markets are buzzing, timing will be everything.”
Key Takeaways: Why This Weekend Matters for Altcoins
Capital Rotation: With Bitcoin and Ethereum trading sideways, traders are diverting funds toward altcoins, anticipating stronger returns.
Macro Trends: Improved inflation outlook and the Fed’s rate pause have boosted risk-on sentiment across global markets.
Technical Indicators: Historical charts from top analysts suggest that the long-awaited Alt Season could be days away from starting.
As traders look ahead, this weekend may present a critical window of opportunity to accumulate promising altcoins before a broader market breakout.
3 Top Trending Altcoins to Watch in the Week Ahead
Bitcoin (BTC) has surged past the $85,000 mark, signaling strong market sentiment despite a slight 0.9% decline in global crypto market cap over the past 24 hours. While BTC’s resilience suggests growing confidence, a look at broader market trends reveals that large-cap altcoins remain stagnant, while smaller-cap assets are seeing significant moves.

Ethereum (ETH) remains subdued at $2,000, showing only a 0.5% gain in 24 hours. Similarly, Cardano (ADA) and Binance Coin (BNB) also moved sideways, conslidating at the $0.70, $620 respectively, while Solana (SOL), trading at $132 leads the top 10 assets with a 2.4% gain.
However a closer look at the Coinmarketcap above shows low-cap altcoins, are attracting significant search traffic, a move that could attract further capital inflows in the coming trading seesions.
1. Trump Memecoin (Official Trump) – Political optimism fuels rally
The Trump-themed memecoin is trading at $11.81, up 5.9% in the last 24 hours, making it one of the most notable gainers. This rally alligns with improved sentiment surrounding recent U.S. policy discussions and Trump’s appearance at the Blockwork’s Digital Assets Summit, last week.
With increasing political relevance and heightened social media buzz, this token is one to watch closely. A break above key resistance levels in the coming days could drive further gains.
2. Pi Network (PI) – Struggling to Break $1, But Buzz is Growing
Last week, PI endured major sell-offs as the network migration trigger mixed reactions among investors. However, Pi Network is now flashing recovery signals. At press time on Sunday, March 23, PI network price is facing strong resistance at the $1 mark, struggling to establish a breakout. However, with the token has become one of the most discussed assets in the last 24 hours, investor interest is evident.
If buying pressure continues and $1 resistance caves, a significant breakout could follow, making this an asset to monitor for a potential price explosion.
3. Wormhole (W) – Cross-Chain Demand Fuels Buying Activity
Ethereum’s native cross-chain bridge token, Wormhole (W) price, has surged 23.9%, driven by increased demand as investors rotate funds across chains.

The boost in market optimism, combined with the Fed’s recent decision to pause interest rate hikes, has further supported capital flows into decentralized finance (DeFi).
With more activity on cross-chain protocols, Wormhole’s demand could continue to rise, making it a strong candidate for further upside in the days ahead.
In Summary:
While Bitcoin’s dominance remains strong above $85,000, altcoins, particularly low-cap assets, are gaining momentum. The surge in Trump memecoin, Pi Network’s rising popularity, and Wormhole’s DeFi-driven gains all signal that the altcoin market could be gearing up for major moves. Traders should watch for key breakout levels as these assets continue to gain traction
Frequently Asked Questions (FAQs)
Altcoin Season refers to a market phase where altcoins outperform Bitcoin, often driven by capital rotation and favorable macroeconomic conditions.
Analysts predict an Altcoin Season due to Bitcoin’s stagnation, improving inflation data, and the Federal Reserve’s decision to pause rate hikes.
Trump memecoin, Pi Network, and Wormhole are gaining traction due to political sentiment, technical setups, and cross-chain DeFi demand.
ibrahim
Crypto analyst covering derivatives markets, macro trends, technical analysis, and DeFi. His works feature in-depth market insights, price forecasts, and institutional-grade research on digital assets.
Disclaimer: The presented content may include the personal opinion of the author and is subject to market condition. Do your market research before investing in cryptocurrencies. The author or the publication does not hold any responsibility for your personal financial loss.
Source link

Bitcoin and Stock Market Rally Hard as White House Narrows Scope of Tariffs

Tabit Insurance Raises $40 Million Bitcoin-Funded Insurance Facility

Strategy’s Bitcoin Holdings Cross 500,000 BTC After Stock Sales

PwC Italy, SKChain to launch self-sovereign EU digital ID

PwC Italy, SKChain Advisors to Build Blockchain-Based EU Digital Identity Product

Bitcoin Price Set To Explode as Global Liquidity Z Score Flashes Buy Signal

Crypto Braces For April 2 — The Most Crucial Day Of The Year

DYDX shoots up 10% as buybacks get a quarter of protocol revenue

$7,000,000 Up for Grabs As Feds Tell Crypto Fraud Victims To Come Recover Their Money

Berachain rolls out next phase of proof-of-liquidity system

White House to Scale Back Tariffs, Bitcoin Gains on Eased Economic Jitters

More is Less: Feature Fatigue is Driving Web3 Users Away

Trump-Linked WLFI Snaps Up 3.54M MNT After Last Week’s Hard Fork

Tokenized US gold could ultimately benefit Bitcoin: NYDIG

XRP Price Reclaims Ground—Is a Bigger Push Just Getting Started?


 24/7 Cryptocurrency News5 months ago
Arthur Hayes, Murad’s Prediction For Meme Coins, AI & DeFi Coins For 2025

 Bitcoin2 months ago
Expert Sees Bitcoin Dipping To $50K While Bullish Signs Persist

 24/7 Cryptocurrency News2 months ago
Aptos Leverages Chainlink To Enhance Scalability and Data Access

 Bitcoin5 months ago
Bitcoin Could Rally to $80,000 on the Eve of US Elections

 Bitcoin4 months ago
Institutional Investors Go All In on Crypto as 57% Plan to Boost Allocations as Bull Run Heats Up, Sygnum Survey Reveals

 Altcoins2 months ago
Sonic Now ‘Golden Standard’ of Layer-2s After Scaling Transactions to 16,000+ per Second, Says Andre Cronje

 Opinion5 months ago
Crypto’s Big Trump Gamble Is Risky

 Price analysis5 months ago
Ripple-SEC Case Ends, But These 3 Rivals Could Jump 500x

✓ Share: