
crypto
Analyst Reveals What You Can’t Miss

In a market breakdown shared on X, independent trader and Zero Complexity Trading founder Koroush Khaneghah points to a handful of critical crypto charts that he believes could dictate the next major market move. Khaneghah, who has invested in over 50 startups, emphasizes that the charts for BTC/USD, BTC Dominance (BTC.D), TOTAL2, ETH/BTC, and SOL/BTC provide invaluable insights into the crypto market’s current condition and possible future shifts.
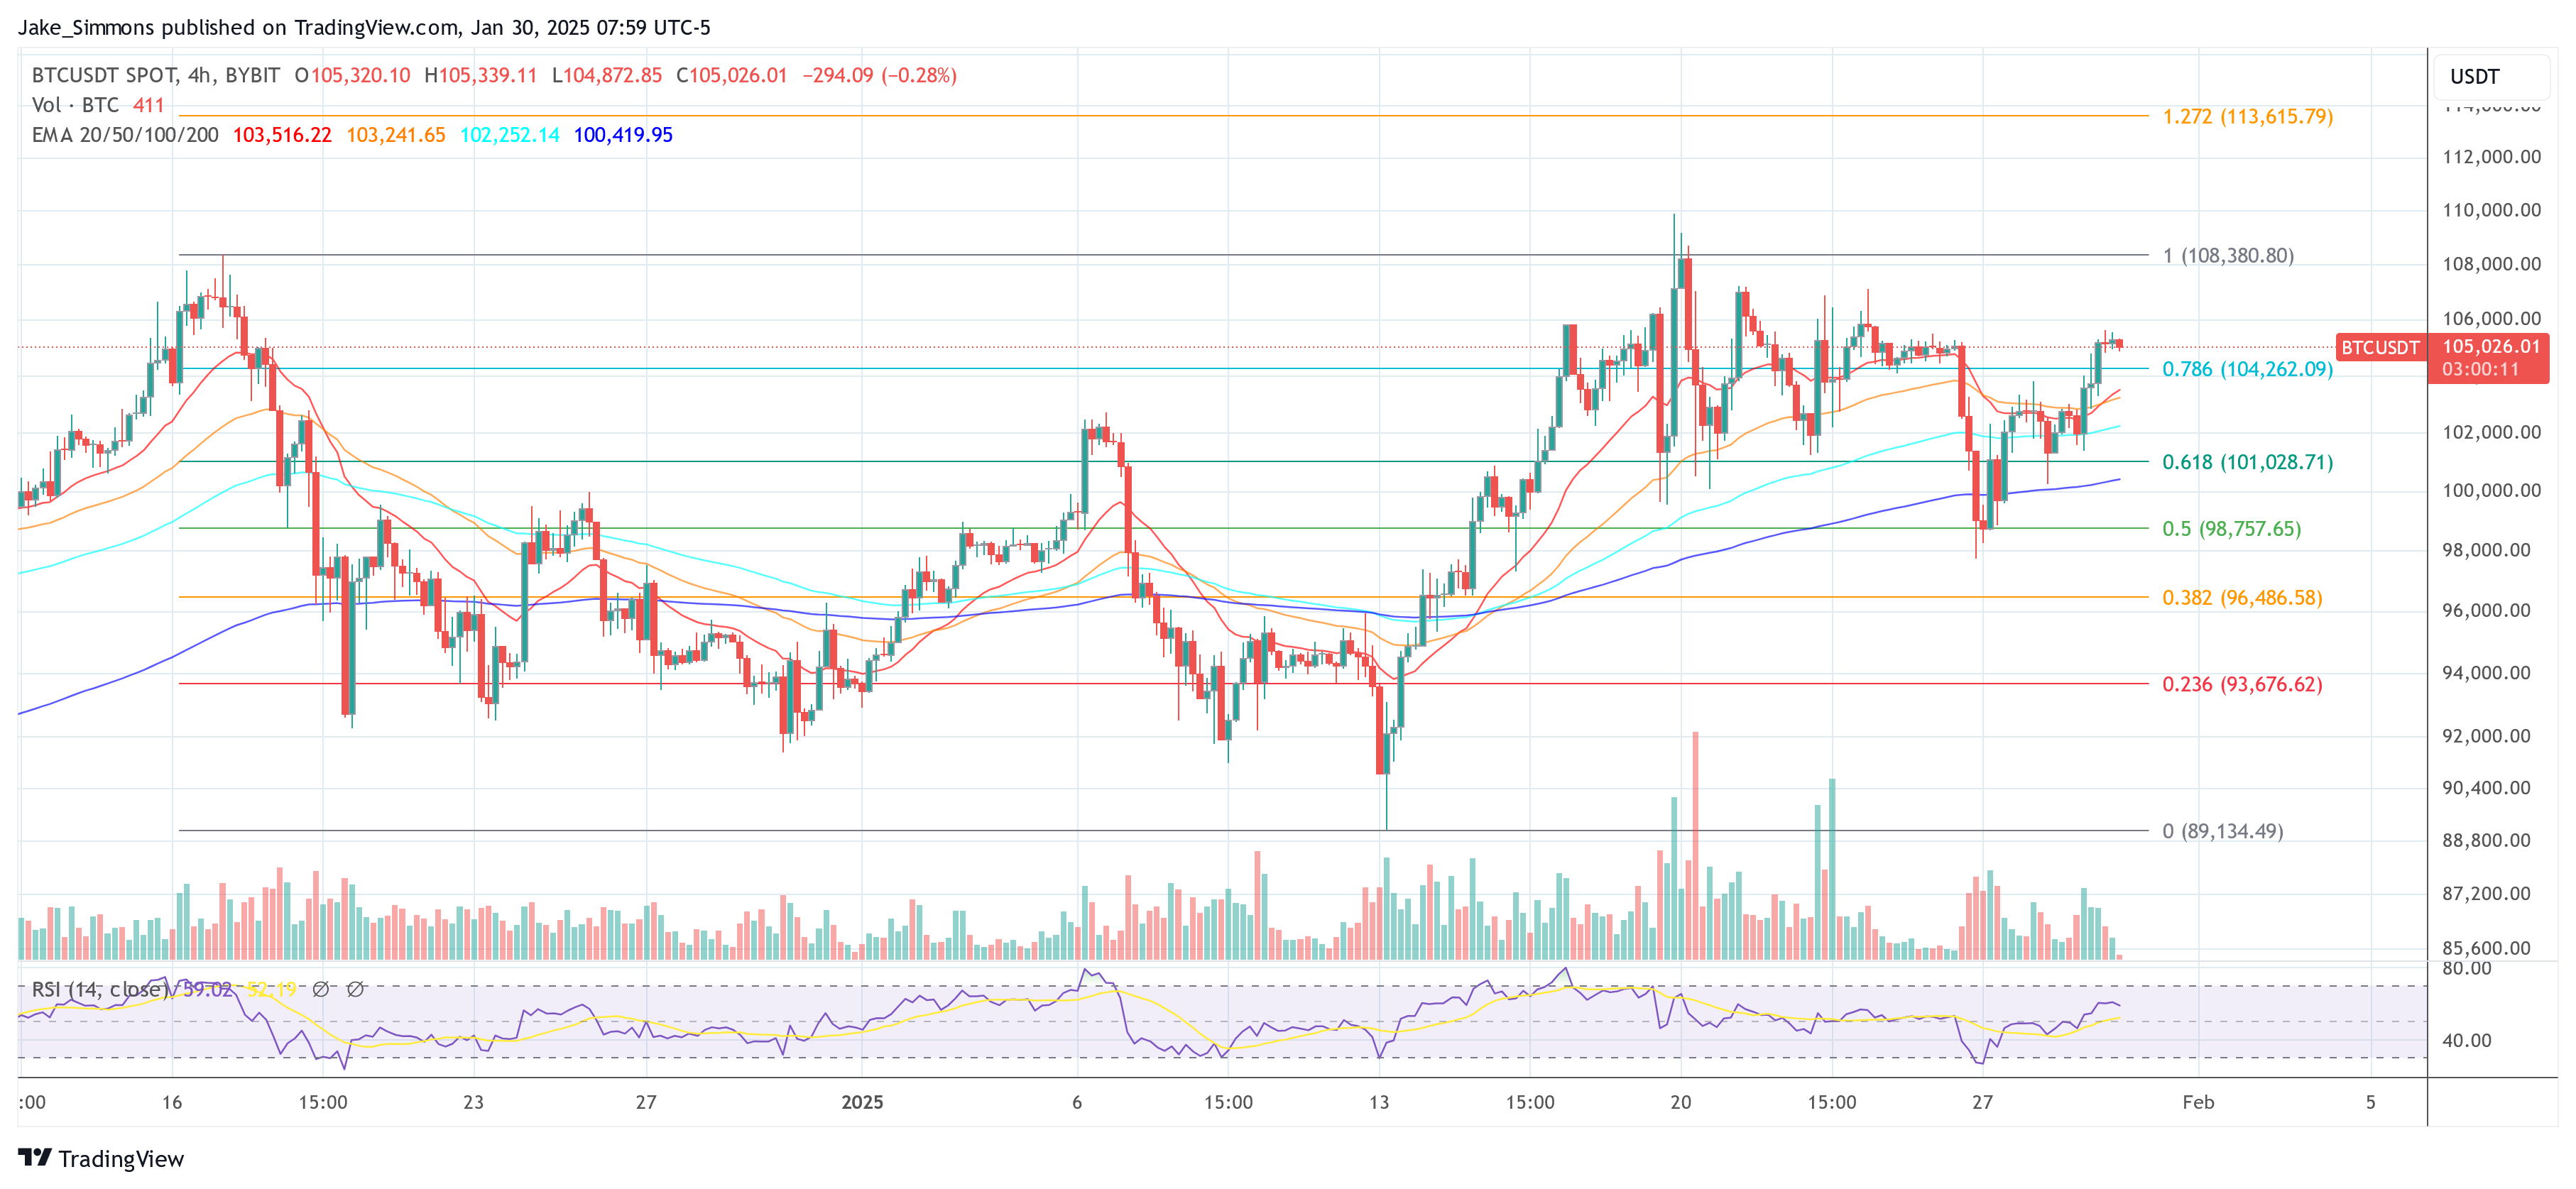
BTC/USD: Defining The Crypto Market
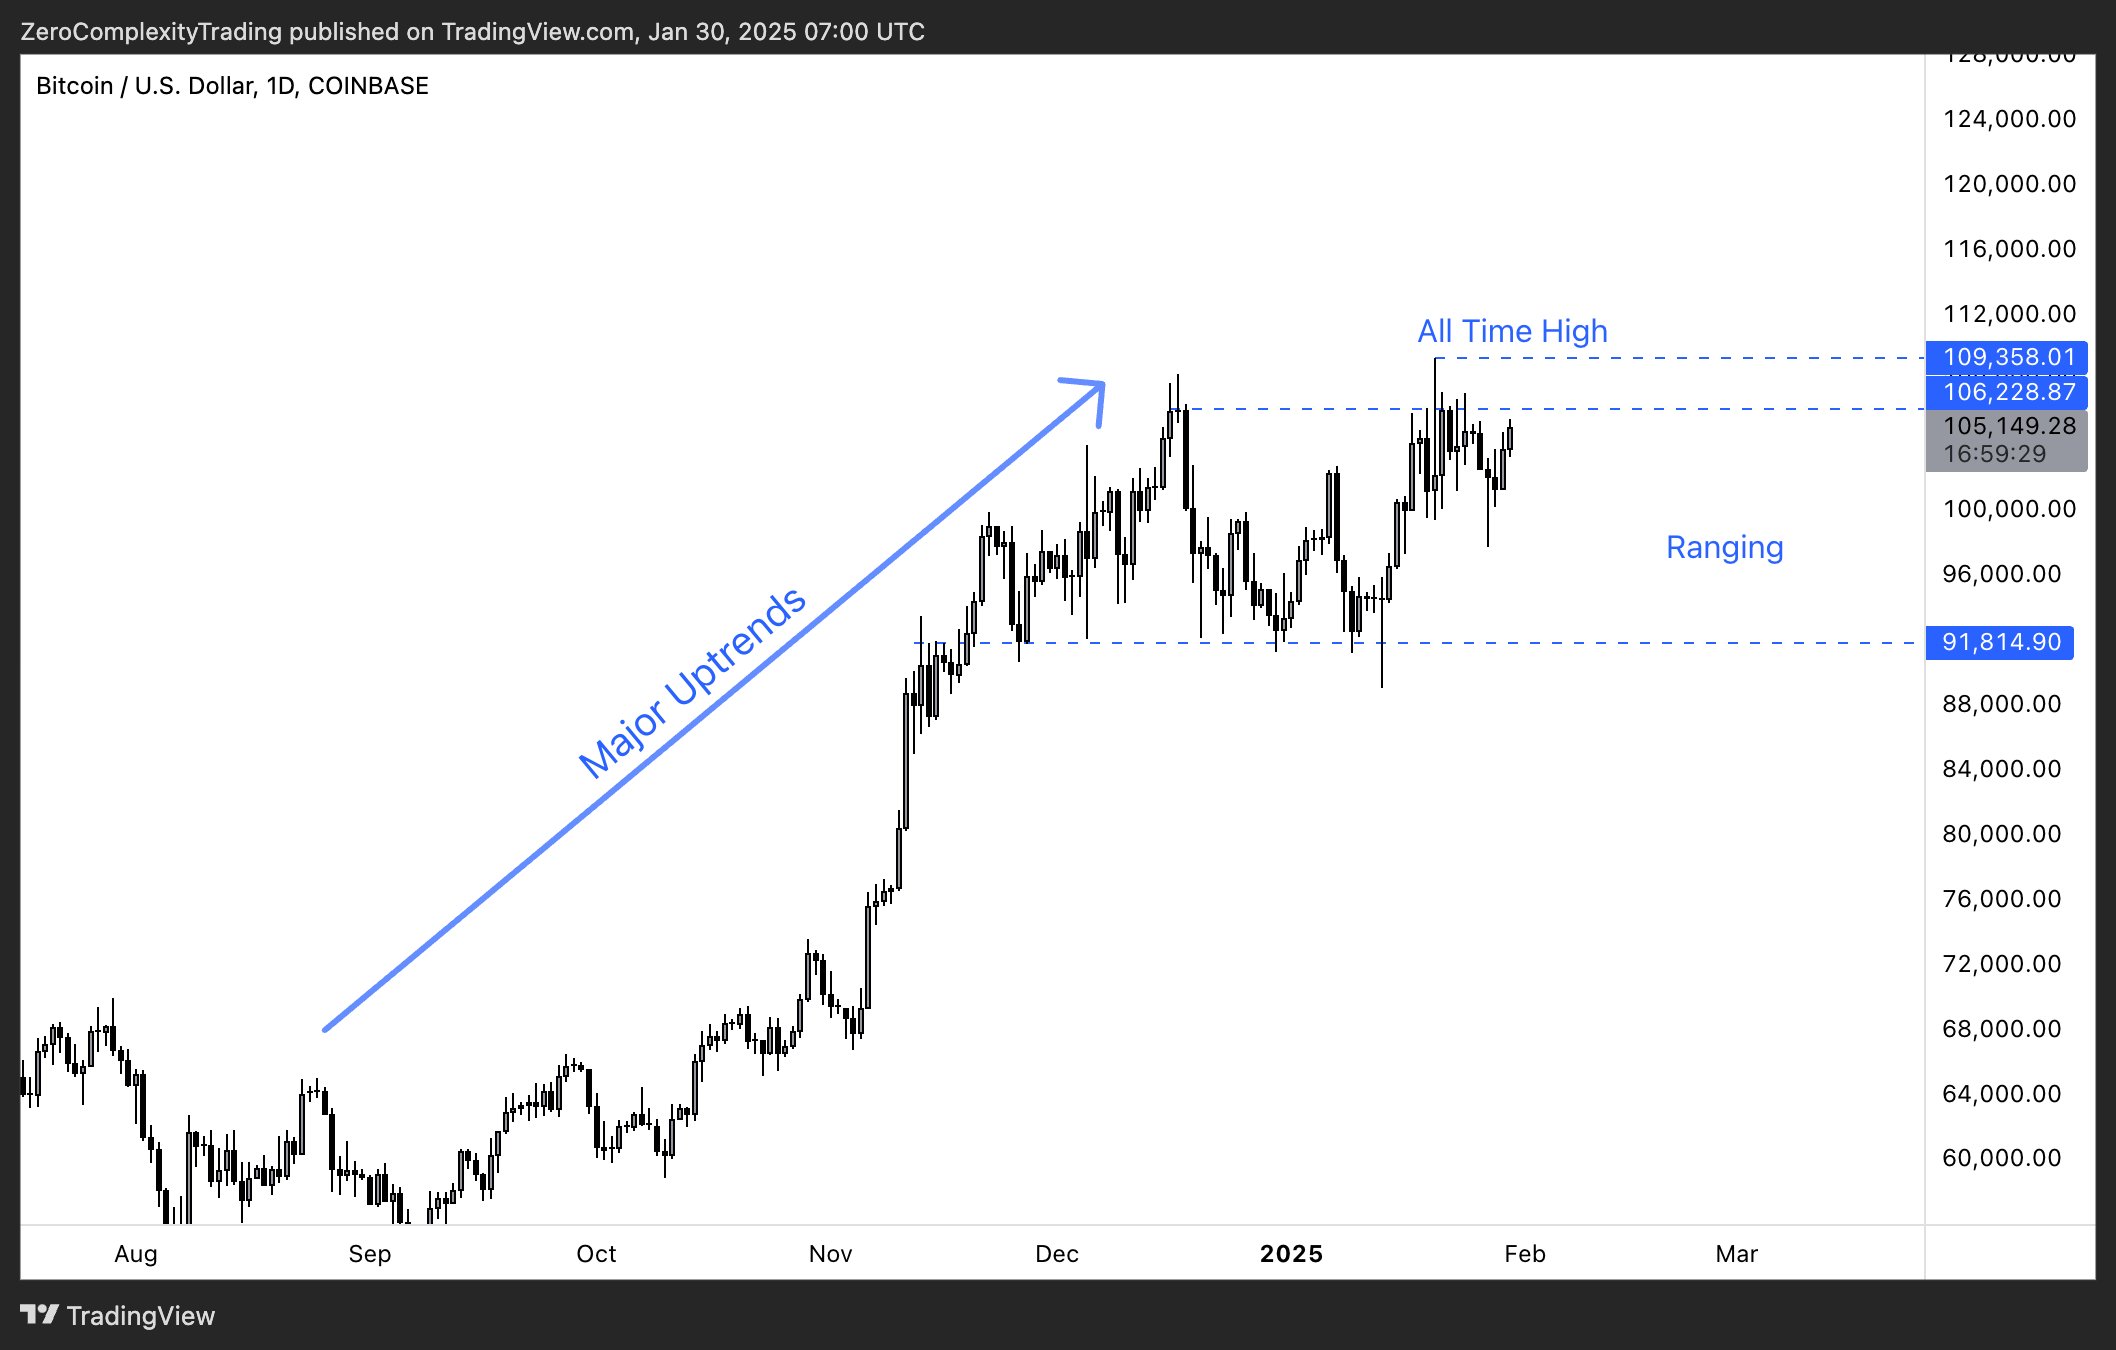
Khaneghah identifies BTC/USD as the yardstick for gauging what stage of the bull run the market might be in. According to his view:
“This decides what stage of the bull run we’re in.
– Breaks above ATH resume the bull run
– Consolidation below ATH -> Altcoins enter accumulation zones
– Major structural breaks -> Time to turn bearish”
He suggests traders begin by determining which of three market environments Bitcoin is in: a raging bull market, a consolidation phase, or a structural downturn. Currently, Khaneghah sees BTC/USD “ranging below all-time highs, coming off some major uptrends,” which often presents either a catch-up scenario for altcoins or a prolonged accumulation phase ahead of Bitcoin’s next attempt to break all-time highs.
BTC Dominance (BTC.D)
To clarify whether altcoins are poised for a significant move, Khaneghah turns to BTC Dominance. As he explains: “BTC.D (bitcoin dominance) tracks Bitcoin’s share of the total crypto market cap. “Increasing Dominance = BTC outperforms and altcoins lag (same for upside and downside). Decreasing Dominance = BTC cools off and money flows into Altcoins.”
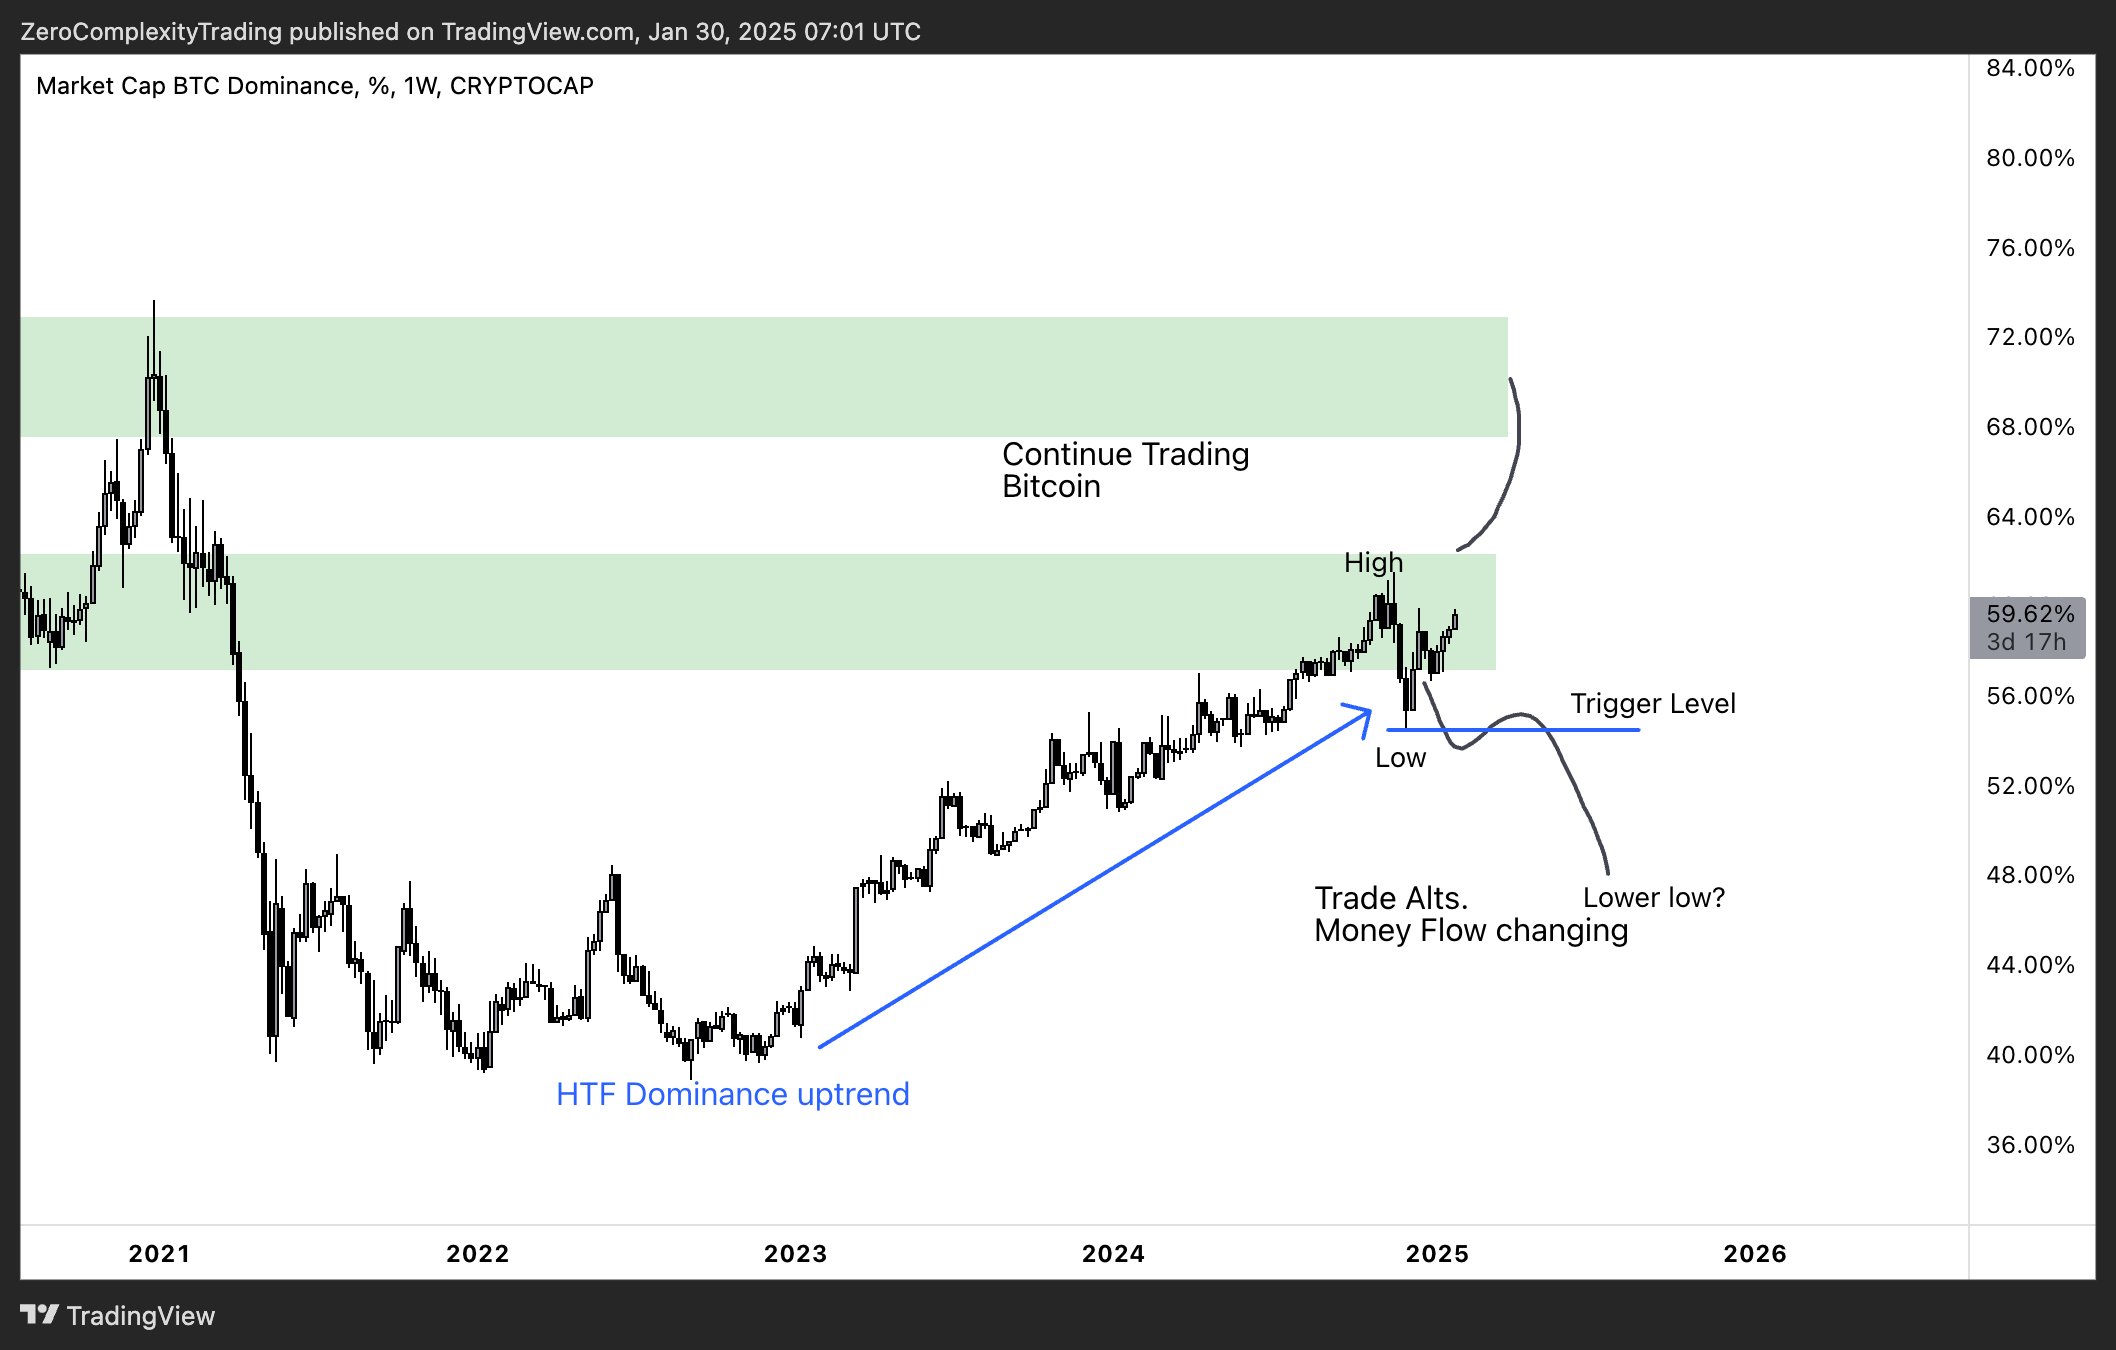
Dominance rising typically means Bitcoin is absorbing the bulk of market liquidity. Meanwhile, a drop in BTC.D often suggests altcoins are about to see greater inflows of capital.
Crypto Market Cap Excluding Bitcoin (TOTAL2)
The TOTAL2 chart, which excludes Bitcoin from the total crypto market capitalization, is key to analyzing altcoin behavior. Khaneghah advises: “When BTC.D Falls, TOTAL2 increases because capital is rotating into altcoins. When TOTAL2 breaks out, look for longs on the strongest altcoins, rotate out of Bitcoin, and shift capital into alts again.”
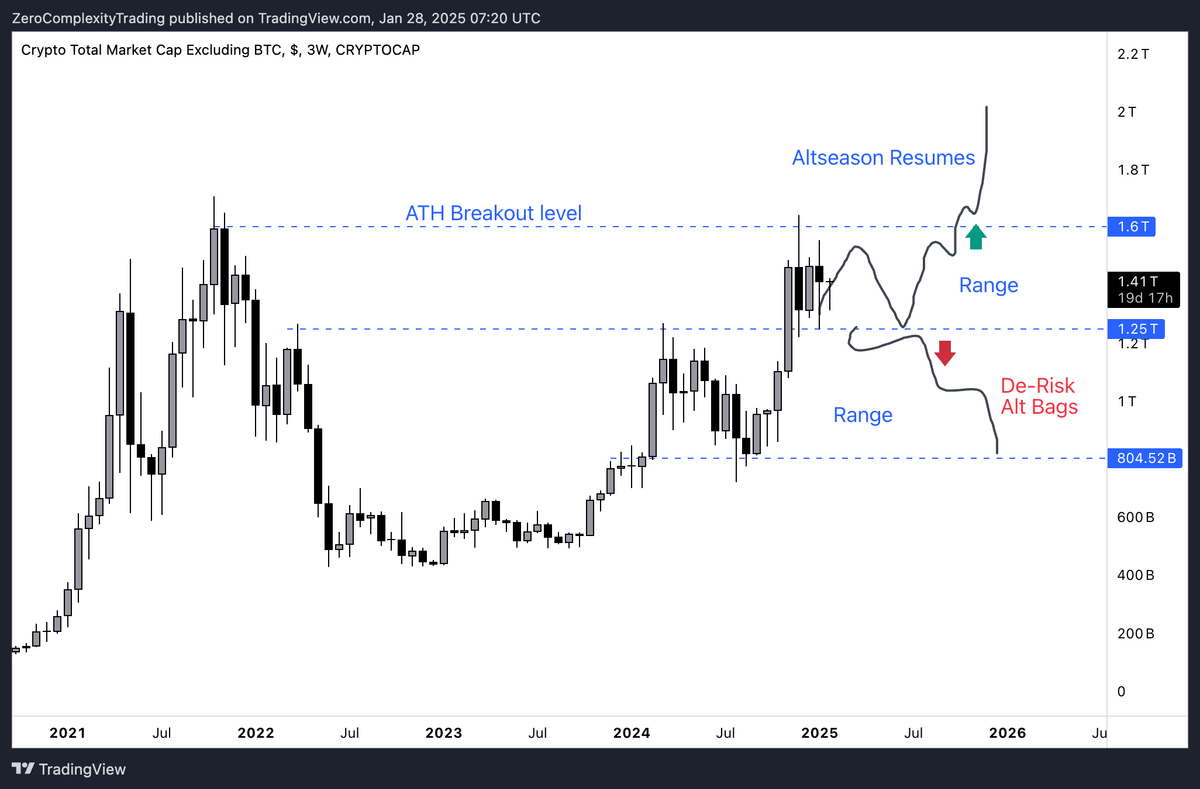
He stresses that the highest probability trades come from identifying moments when the market rotates away from Bitcoin. In these instances, traders might see stronger returns by entering altcoin positions rather than remaining primarily in BTC.
ETH/BTC
Khaneghah underscores that ETH/BTC is a helpful barometer for broader altcoin sentiment: “The best altcoin plays happen when ETH/BTC stops trending downwards because the market confidence in alts returns here.”
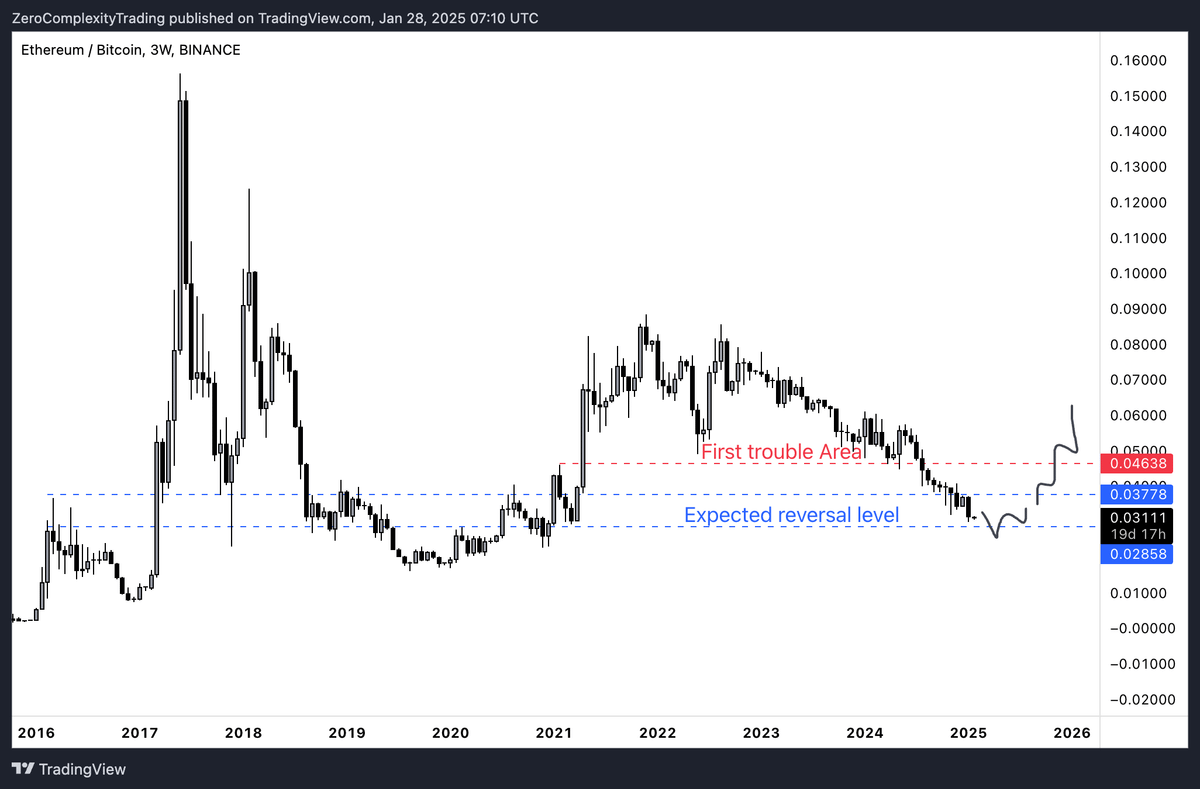
When Ethereum is outperforming Bitcoin or stabilizing against it, it generally sparks confidence that altcoins could experience rallies, often referred to as “altseason.”
SOL/BTC
Khaneghah also shines a spotlight on SOL/BTC, suggesting that Solana’s performance relative to Bitcoin could reshape altcoin capital rotation: “I don’t normally look at this but a comparison helps decide if the money rotation has a better reward within the SOL ecosystem or ETH. People will think SOL has ‘pumped already’ but I like buying coins with strength, rather than buying coins that might catch a bid.”
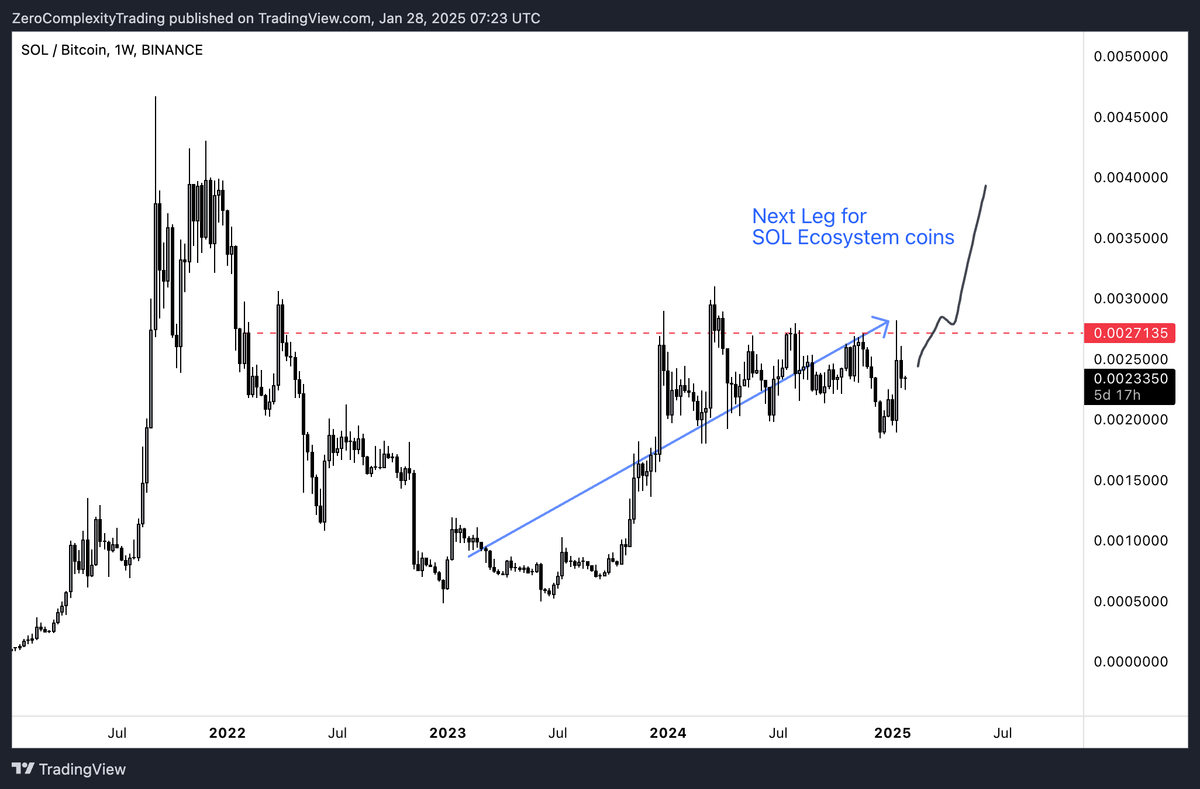
While Solana has posted significant gains, Khaneghah believes its strong performance could continue. He notes that if Solana keeps outperforming Bitcoin, some capital might shift away from ETH, potentially amplifying activity across the SOL ecosystem.
At press time, BTC traded at $105,026.
Featured image from Shutterstock, chart from TradingView.com
Source link


Blockchain
Financial Firm Republic Plans To Acquire Crypto and Tokenized Securities Trading Platform INX for $60,000,000

The global financial firm Republic is planning on purchasing a crypto and tokenized securities trading platform for tens of millions of dollars.
According to a new press release, Republic – founded in 2016 and backed by banking giant Morgan Stanley – plans on purchasing real-world asset tokenization platform INX (INXDF) for up to $60 million.
The terms of the deal would have Republic purchase all outstanding public shares of INX for approximately $54.8 million, though the finalized deal could be worth up to $60 million.
The press release says Republic was interested in acquiring INX because it allows the firm, which was already a shareholder of INX, to fully immerse itself in the world of digital assets by providing blockchain-based decentralized finance (DeFi) and tokenization services.
As stated by Shy Datika, Founder and chief executive of INX,
“Joining forces with Republic accelerates our vision of a fully regulated, tokenized economy that empowers investors globally. Together, we’re setting a new standard for how real-world assets and digital securities are issued, traded, and managed.
By combining INX’s expertise in security token and cryptocurrency trading with Republic’s global investment reach, the merged entity will offer a full investment lifecycle in a regulated and scalable ecosystem – bridging traditional finance and blockchain technology.”
According to the press release, Republic is purchasing the rest of INX’s outstanding shares at a staggering 457% premium, based on its latest closing price.
INXDF is trading for $0.0634 at time of writing, a 20.75% decrease on the day.
Follow us on X, Facebook and Telegram
Don’t Miss a Beat – Subscribe to get email alerts delivered directly to your inbox
Check Price Action
Surf The Daily Hodl Mix
 

Disclaimer: Opinions expressed at The Daily Hodl are not investment advice. Investors should do their due diligence before making any high-risk investments in Bitcoin, cryptocurrency or digital assets. Please be advised that your transfers and trades are at your own risk, and any losses you may incur are your responsibility. The Daily Hodl does not recommend the buying or selling of any cryptocurrencies or digital assets, nor is The Daily Hodl an investment advisor. Please note that The Daily Hodl participates in affiliate marketing.
Featured Image: Shutterstock/Zaleman/Fotomay
Source link

A new decentralized finance (DeFi) trading altcoin is surging after gaining support from the top US-based crypto exchange platform by volume.
In a new thread on the social media platform X, Coinbase says it’s adding the DeFi token Definitive Finance (EDGE) to its suite of digital asset products with an experimental label, causing the altcoin to skyrocket.
Coinbase’s experimental label designates assets as having higher volatility and lower trading volume compared to other products offered by the firm.
News of the addition sent EDGE flying, as the token went from an April 2nd low of $0.0274 to a peak of $0.1157 just a few hours later. The digital asset has since retraced and is trading for $0.086 at time of writing, a staggering gain of nearly 180% during the last 24 hours.
According to its official website, Definitive aims to mimic the experience offered by centralized exchange platforms, such as Coinbase and Binance, despite being decentralized.
“Definitive is the future of onchain trade execution. We deliver a CeFi-like experience on DeFi rails via a fully non-custodial platform and API (application program interface) that is live across Solana, Base and other major EVM (Ethereum virtual machine) chains.
With Definitive, anyone – from a retail user, to a whale, to a liquid fund, or even an AI agent – can trade any asset on any chain with the same institutional-grade execution found in CeFi.”
Follow us on X, Facebook and Telegram
Don’t Miss a Beat – Subscribe to get email alerts delivered directly to your inbox
Check Price Action
Surf The Daily Hodl Mix
 
Disclaimer: Opinions expressed at The Daily Hodl are not investment advice. Investors should do their due diligence before making any high-risk investments in Bitcoin, cryptocurrency or digital assets. Please be advised that your transfers and trades are at your own risk, and any losses you may incur are your responsibility. The Daily Hodl does not recommend the buying or selling of any cryptocurrencies or digital assets, nor is The Daily Hodl an investment advisor. Please note that The Daily Hodl participates in affiliate marketing.
Generated Image: Midjourney
Source link
crypto
JPMorgan Chase, Capital One and Other US Banks Engaging in ‘Cancel Culture,’ Creating Need for Crypto: Eric Trump
Eric Trump, executive vice president of the Trump Organization, says that de-banking concerns make a strong case for cryptocurrency adoption.
In a new interview with Fox Business, the son of US President Donald Trump alleges that he is a victim of the “cancel culture” engaged in by US banks, including Capital One and JPMorgan Chase.
Asked which financial institutions de-banked him, the youngest son of US President Donald Trump says,
“Oh God, everybody. Capital One being the largest. I’ve sued them recently. Chase canceled us…
You can’t believe when you get those calls. And we have properties, commercial buildings, that literally have hundreds and hundreds of employees, thousands of people that work in those buildings every single day. They call you up saying in two weeks we’re going need you to shut down the bank account.”
Trump says he became a big supporter of crypto as a result of the alleged de-banking.
“These bank accounts are ecosystems, and they came after us viciously, because my father was in the White House and they wanted to punish us. It was legal lawfare. It was political lawfare. And that’s what opened my eyes.
I’m a hard asset guy. My entire life has been building hotels, golf courses, real estate buildings, commercial buildings, etc. That’s what I’ve done. If there’s anybody’s eyes who shouldn’t have been open to the world of cryptocurrency it was mine other than I realized the power that these banks had, and I realized how they were exerting that power, and they were canceling businesses all over our country. It was political. It was forced. They were targeting people that they didn’t like. It wasn’t fair. And then you realize that there’s not a single thing that those banks do that can’t be done better, cheaper, more efficiently, faster on blockchain.”
Follow us on X, Facebook and Telegram
Don’t Miss a Beat – Subscribe to get email alerts delivered directly to your inbox
Check Price Action
Surf The Daily Hodl Mix
 
Disclaimer: Opinions expressed at The Daily Hodl are not investment advice. Investors should do their due diligence before making any high-risk investments in Bitcoin, cryptocurrency or digital assets. Please be advised that your transfers and trades are at your own risk, and any losses you may incur are your responsibility. The Daily Hodl does not recommend the buying or selling of any cryptocurrencies or digital assets, nor is The Daily Hodl an investment advisor. Please note that The Daily Hodl participates in affiliate marketing.
Generated Image: Midjourney
Source link

Crypto Trader Unveils Best-Case Scenario for Bitcoin To Avoid 2021-Style Market Meltdown

Bitcoin ETFs post $172m in weekly outflows amid market bloodbath

Trump Ally Bill Ackman Calls for 90-Day Pause on US Tariffs as Crypto Sinks

Ethereum price Tags $1,500 As Global Stock Market Crash Triggers Circuit Breakers

Bitcoin Trades Above $79K as Asia Markets React to Trump Tariffs

Memecoin platform Pump.fun brings livestream feature back to 5% of users

Bitcoin Price On The Verge Of Explosive 15% Breakout As Analyst Spots Triangle Formation

Strategy CEO Makes The Case For Corporate Bitcoin Adoption In MIT Keynote

Hackers Hammer Android and iPhone Users As Bank Account Attacks Surge 258% in One Year: Kaspersky

Cryptocurrencies to watch this week: Aptos, XRP, Solana

This Week in Crypto Games: ‘Off the Grid’ Token Live, Logan Paul ‘CryptoZoo’ Lawsuit Continues

Crypto Liquidations hit $600M as BTC Plunges Below $80K First Time in 25-days

Bitcoin (BTC) Price Posts Worst Q1 in a Decade, Raising Questions About Where the Cycle Stands

Stablecoins are the best way to ensure US dollar dominance — Web3 CEO

Chainlink (LINK) Targets Rebound To $19 — But Only If This Key Support Holds


 24/7 Cryptocurrency News5 months ago
Arthur Hayes, Murad’s Prediction For Meme Coins, AI & DeFi Coins For 2025

 Bitcoin3 months ago
Expert Sees Bitcoin Dipping To $50K While Bullish Signs Persist

 24/7 Cryptocurrency News3 months ago
Aptos Leverages Chainlink To Enhance Scalability and Data Access

 Bitcoin5 months ago
Bitcoin Could Rally to $80,000 on the Eve of US Elections

 Altcoins2 months ago
Sonic Now ‘Golden Standard’ of Layer-2s After Scaling Transactions to 16,000+ per Second, Says Andre Cronje

 Bitcoin5 months ago
Institutional Investors Go All In on Crypto as 57% Plan to Boost Allocations as Bull Run Heats Up, Sygnum Survey Reveals

 Opinion5 months ago
Crypto’s Big Trump Gamble Is Risky

 Price analysis5 months ago
Ripple-SEC Case Ends, But These 3 Rivals Could Jump 500x
