
Analyst
Analyst Sets $320,000 Target As Wave 5 Begins

The Bitcoin price has finally broken out of resistance and is on a journey to the $320,000 threshold, according to a crypto analyst. Notably, the Bitcoin price has now returned into a full bullish sentiment, with the crypto fear and greed index now pointing to extreme greed.
In a recent technical analysis, crypto analyst Gert van Lagen identified a bullish pattern in Bitcoin’s price chart, specifically pointing to a confirmed breakout of the classic ‘cup-and-handle’ pattern formation that has essentially kicked off a bullish Wave 5 run.
Bitcoin Price Sets Sights On $320,000 As Wave 5 Begins
Bitcoin’s price action has been nothing short of impressive in the past few days. Notably, the Bitcoin price has created multiple all-time highs in quick succession, as many investors start to pour in. This sustained demand has created successive bullish candles on both the daily and weekly charts, illustrating a continued strong upward momentum.
Related Reading
Interestingly, these bullish candle formations have validated what crypto analyst Gert van Lagen called the start of a sub-wave 5 formation. This wave, which is known to be bullish, is expected to be the final sub-wave formation in a larger Elliot wave uptrend that has been in play since January 2023.
Supporting the possibility of the wave 5 formation, technical analysis of the Bitcoin price formation shows that the recent price rally has seen Bitcoin breaking out of a cup-and-handle formation. This pattern, which is known to be bullish, has been in formation since 2022. The ‘cup’ portion of this pattern began forming in early 2022 and eventually ended with Bitcoin’s peak above $73,700 in March 2024. The subsequent consolidation phase, which lasted until October, represents the ‘handle’ segment of the pattern.
In addition to this, Bitcoin has managed to break free from what van Lagen described as a ‘base 4 step-wise formation,’ effectively shaking off a bear trap. With this breakout now confirmed, van Lagen’s analysis points to a projected target range between $220,000 and $320,000. This range marks what he considers a ‘major sell line,’ which is a zone where profit-taking might intensify as Bitcoin reaches these upper limits.

Related Reading
Current State Of BTC
At the time of writing, Bitcoin is trading at $89,500 with a market cap of $1.77 trillion and an all-time high of $89,864, having increased by about 10.5% in the past 24 hours. However, given this trend, this all-time high might not last long. The bullish sentiment and inflow surrounding Bitcoin has been so massive that investors don’t know when to take profit at the moment. The RSI is above 70 on every single timeframe from the daily to the yearly. This shows how strong the buying momentum is at the moment.
Nevertheless, the momentum is expected to continue, with the next target at $90,000 and another at $100,000. A move to Gert van Lagen’s target of $220,000 to $320,000 will represent a 145% and 255% increase, respectively, from the current price.
Featured image created with Dall.E, chart from Tradingview.com
Source link


The Bitcoin price has struggled to reclaim previous price highs above $100,000, with bearish sentiment dominating the market. Currently, the Bitcoin price is retesting the support line of an Ascending Channel after crashing below $95,000. A crypto analyst has predicted that if it can hold this key support level, it could stage a recovery and skyrocket to its next bullish target, aligning with the upper resistance line of the channel.
Bitcoin Price Retest Support Line; New Target In Sight
In a chart illustrating Bitcoin’s price movement within an Ascending Channel, Trader Tardigrade, a crypto analyst on X (formerly Twitter), revealed that the cryptocurrency has temporarily declined below the lower support line on the channel. The analyst labeled this decline a “False Break,” highlighting that the Ascending Channel remains intact despite the drop.
Related Reading
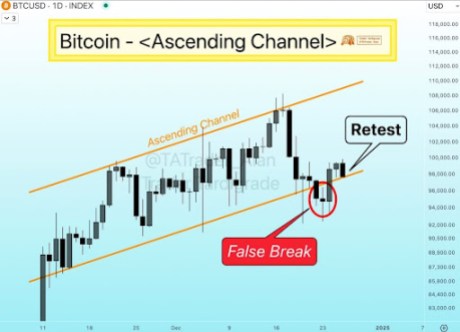
As indicated by the red circle in the price chart, the False Break suggests that Bitcoin’s brief move below the support level was short-lived and does not confirm the continuation of its previous downtrend. Trader Tardigrade noted that after Bitcoin’s False break, the cryptocurrency quickly moved back into the Ascending Channel to reclaim the lower support line.
Interestingly, Bitcoin’s drop below the False break comes as the pioneer cryptocurrency experienced a sharp price crash below $95,000. Lately, the flagship cryptocurrency has been under significantly bearish pressure, recording notable declines as market volatility intensifies.
Despite this bearish performance, Trader Tardigrade has disclosed that Bitcoin is now retesting the channel’s support line again, aiming to break above and trigger a price reversal. The analyst predicts that if Bitcoin can hold this support line, it will likely continue moving upwards within the channel.
Consequently, the analyst has forecasted that Bitcoin’s next price target would be the upper resistance line of the Ascending Channel. Looking at the price chart, the channel points upwards towards a range between $110,000 and $112,000.
If Bitcoin can successfully recover toward the upper resistance line, it could signal the continuation of a bullish trend within the Ascending Channel. Additionally, a breakout above the resistance line could further validate the bullish momentum, setting up a stage for Bitcoin to potentially target higher price levels and possibly retest its all-time high.
Related Reading
Analyst Says Bitcoin Could Crash To $87,000
Bitcoin is currently in a downward trend, experiencing severe price declines despite analysts’ optimistic projections of a price surge. According to crypto analyst Titan of Crypto, the Bitcoin price could see another decline, with the support level at $87,000 being the next target.
However, according to the analyst, a drop to this price low could bring “maximum pain” to both short—and long-term investors. Nevertheless, Titan of Crypto believes this severe price decline could also present a strong foundation for Bitcoin’s next price rally.
He emphasized that price movements are rarely linear, highlighting the crypto market’s inherent unpredictability and volatility. Despite Bitcoin’s bearish behavior, Titan of Crypto confidently predicts that a price rally to $110,000 is inevitable.
Featured image created with Dall.E, chart from Tradingview.com
Source link

Crypto analyst Trade PSH has revealed the major Bitcoin support levels to watch out for as BTC bulls push for a rally to the psychological $100,000 level. The analyst also mentioned what price levels Bitcoin could reach in the short term as it breaks above $100,000.
Bitcoin Support Levels To Watch Out For As Bulls Push For $100,000
In a TradingView post, Trade PSH stated that the local maximum is $99,450 as bulls are repeatedly trying to push the price above $100,000. The crypto analyst also mentioned that the nearest key support zone comes in between $95,000 and $96,600. This aligns with a recent Bitcoinist report that highlighted the $96,000 level as a crucial support zone.
Related Reading
While the Bitcoin price is moving above this support zone, Trade PSH stated that the primary scenario is continued growth for the flagship crypto. If Bitcoin maintains an uptrend and eventually breaks above the psychological $100,000 level, the crypto analyst predicts that the intermediate growth target is between $102,000 and $102,757.
Based on the current price action, the analyst suggested that Bitcoin could rally to $108,366. This would mark a new all-time high (ATH) for the flagship crypto, as its current ATH is $108,268. Meanwhile, Trade PSH mentioned that a drop below $94,300 would invalidate this trade setup.
The analyst’s accompanying chart showed that the Bitcoin price could break above $100,000 and reach these short-term targets before the year ends. While that remains to be seen, it is worth mentioning that January 2025 provides a bullish outlook for the flagship crypto.
Pro-crypto Donald Trump is set to take office on January 20, which could lead to the creation of the Strategic Bitcoin Reserve. Historically, Bitcoin also enjoyed a price recovery in January 2021 of the last bull run. As such, history could repeat itself again.
BTC Is Heading Higher
In an X post, crypto analyst Titan of Crypto also provided a bullish outlook for the Bitcoin price, stating that the flagship crypto is heading higher. His accompanying chart showed that Bitcoin could rally to as high as $158,000 by May 2025. The chart also showed a price target above $220,000, suggesting that the flagship crypto could rally even higher.
Related Reading
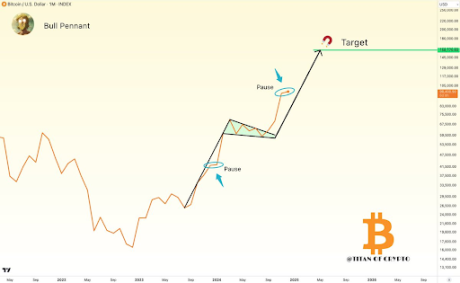
Titan of Crypto alluded to a bullish pennant, which he suggested was still in play for the Bitcoin price. This massive bull pennant is forming in the monthly timeframe, and if it plays out, the crypto analyst is confident that Bitcoin will enjoy a parabolic rally to this price target.
At the time of writing, the Bitcoin price is trading at around $98,100, down in the last 24 hours, according to data from CoinMarketCap.
Featured image created with Dall.E, chart from Tradingview.com
Source link

The Cardano price action has continued to stall below the $1 mark in light of corrections in the past seven days. This correction, which played out across the entire crypto industry, saw Cardano break below the $1 mark again on December 18%.
Although the broader trend suggests a possible move on the weekly timeframe towards a new all-time high (ATH), recent technical analysis on TradingView has opened up the possibility for a continued correction towards $0.43 before another strong upward move.
Current Price Movements Highlight Resistance And Cooling Period
According to technical analysis of the Cardano (ADA) price action on the weekly candlestick timeframe, the cryptocurrency has encountered notable resistance around the $1.2046 mark. This resistance has emerged after Cardano’s remarkable 205% surge from $0.4322 in late October to $1.32 in late November.
Related Reading
Interestingly, this remarkable price surge saw Cardano form significant lows that serve as support levels for the price. Furthermore, the rally ended up with Cardano entering the overbought zone on the Relative Strength Index (RSI) indicator. The rally culminated in the Cardano price peaking at 82.87 on the RSI, but it has since retraced into a cooling/corrective period where buying pressure is consolidating at the time of writing.
Cardano’s consolidation has opened up outlooks as to its next direction, with substantial buying volumes observed in recent trading sessions.
Deep Correction Could Test Critical Support At $0.43
While the long-term outlook remains bullish, the analysis highlights the scenario of a deep correction that could send the Cardano price falling further in the short term. With this in mind, the analyst points to support levels that ADA may revisit in the event of a deeper correction. The first key level at $0.7683 has already proven its significance, acting as a reactionary zone in recent price movements.
Related Reading
Below this, $0.4322 stands as the ultimate support for the current bullish leg. What this means is that ADA has to hold above the $0.43 support level in order for a bullish trajectory to remain valid. Failure to hold above $0.43 is likely to cascade into more price declines at this point and a change into bearish outlook.
The analyst also identifies $0.3166 and $0.2427 as primary supports. These levels are Cardano’s lowest support during the previous bear market and are considered less likely to be breached in case of a longer-term decline.
Despite the potential for a deep correction, Cardano’s recent market behavior and buying trends suggest a promising long-term outlook. At the time of writing, ADA is trading at $0.912 and has increased by 2% in the past 24 hours. Once the current resistance at $1.2046 is cleared, ADA is well-positioned to challenge its $3.09 all-time high and possibly establish new highs in the current cycle.
Featured image created with Dall.E, chart from Tradingview.com
Source link

From Booze to Barbells: Exercise May Offset Risks of College Partying

Ethereum Foundation shuffles leadership, splits board and management

Bitcoin Price (BTC) Retakes $95K Level After Early U.S. Decline

A New Risk For The Industry?

Justin Sun Bets Big On JUST Token, Sees 100x Potential

Worldcoin price prediction | What’s next for WLD price?

Bitcoin Is About To Begin Outperforming Gold, Says InvestAnswers – Here’s His Timeline

Bloomberg Analyst Confirms No Set Launch Date for ProShares XRP ETFs

What is Base? The Ethereum Layer-2 Network Launched by Coinbase

Loopscale hacker in talks to return stolen crypto

Bitcoin (BTC) Yield Platform Coming From Coinbase (COIN), Aspen Digital

The Emerging Market For State Services Via Citizen X

XRP Price Shoots For 20% Surge To $2.51 Amid Pullback To Breakout Zone

Stocks edge higher ahead of big earnings week

Here’s How Bitcoin Could Boost Demand for US Treasuries, According to Macro Guru Luke Gromen


 24/7 Cryptocurrency News6 months ago
Arthur Hayes, Murad’s Prediction For Meme Coins, AI & DeFi Coins For 2025

 Bitcoin3 months ago
Expert Sees Bitcoin Dipping To $50K While Bullish Signs Persist

 Ripple Price1 month ago
3 Voting Polls Show Why Ripple’s XRP Price Could Hit $10 Soon

 24/7 Cryptocurrency News4 months ago
Aptos Leverages Chainlink To Enhance Scalability and Data Access

 Bitcoin6 months ago
Bitcoin Could Rally to $80,000 on the Eve of US Elections

 Opinion6 months ago
Crypto’s Big Trump Gamble Is Risky

 Bitcoin6 months ago
Institutional Investors Go All In on Crypto as 57% Plan to Boost Allocations as Bull Run Heats Up, Sygnum Survey Reveals

 Bitcoin3 months ago
The Future of Bitcoin: Scaling, Institutional Adoption, and Strategic Reserves with Rich Rines
