
Bitcoin Magazine Pro
Are Retail Investors Behind The Bitcoin Price Surge This Bull Run?
As Bitcoin once again finds itself in price discovery mode, market watchers and enthusiasts are curious: has retail FOMO set in yet, or is the retail surge we’ve seen in past bull cycles still on the horizon? Using data from active addresses, historical cycles, and various market indicators, we’ll examine where the Bitcoin market currently stands and what it might signal about the near future.
Rising Interest
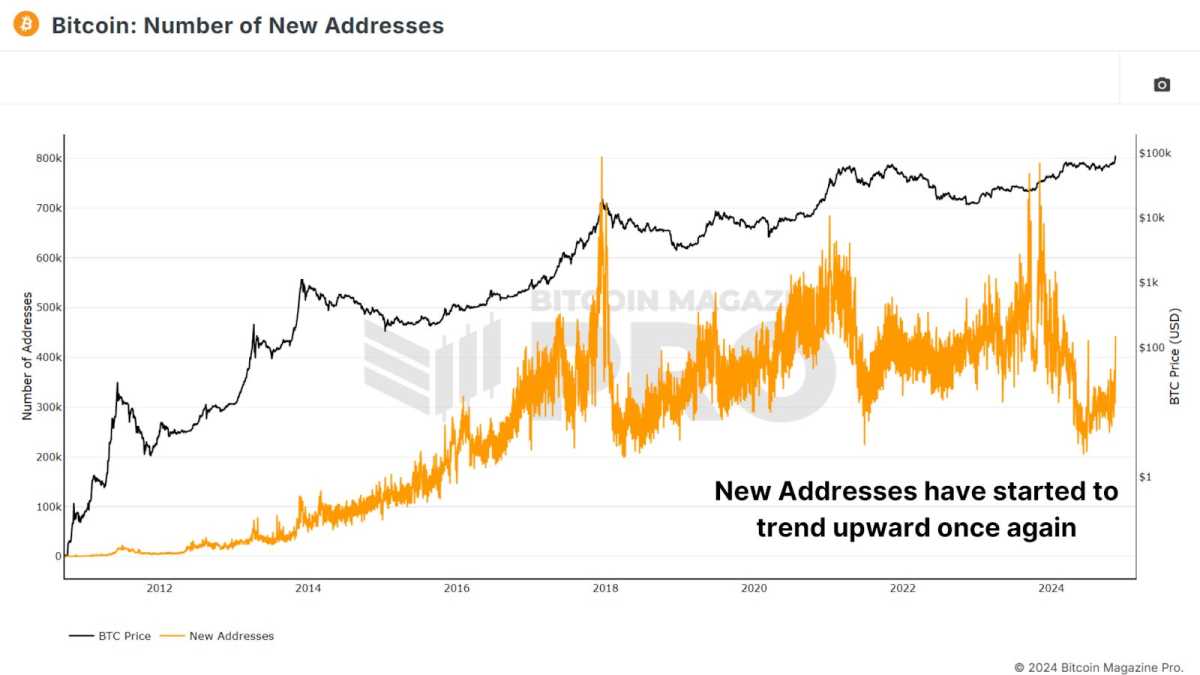
One of the most direct signs of retail interest is the number of new Bitcoin addresses created. Historically, sharp increases in new addresses have often marked the beginning of a bull run as new retail investors flood into the market. In recent months, however, the growth in new addresses hasn’t been as sharp as one might expect. Last year, we saw around 791,000 new addresses created in a single day—a sign of considerable retail interest. In comparison, we now hover significantly lower, although we have recently seen a modest uptick in new addresses.


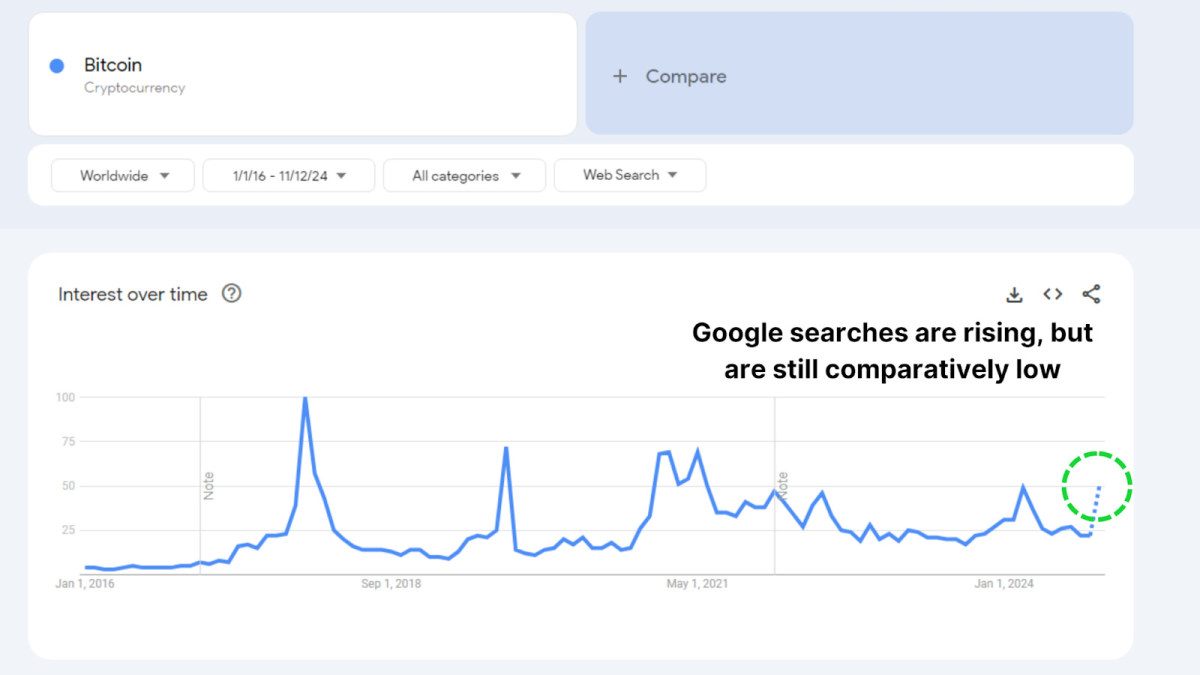
Google Trends also reflects this tempered interest. Although searches for “Bitcoin” have been increasing in the past month, they remain far below previous peaks in 2021 and 2017. It seems that retail investors are showing a renewed curiosity but not yet the fervent excitement typical of FOMO-driven markets.
Supply Shift
We are witnessing a slight transition of Bitcoin from long-term holders to newer, shorter-term holders. This shift in supply can hint at the potential start of a new market phase, where experienced holders begin taking profits and selling to newer market participants. However, the overall number of coins transferred remains relatively low, indicating that long-term holders aren’t yet parting with their Bitcoin in significant volumes.
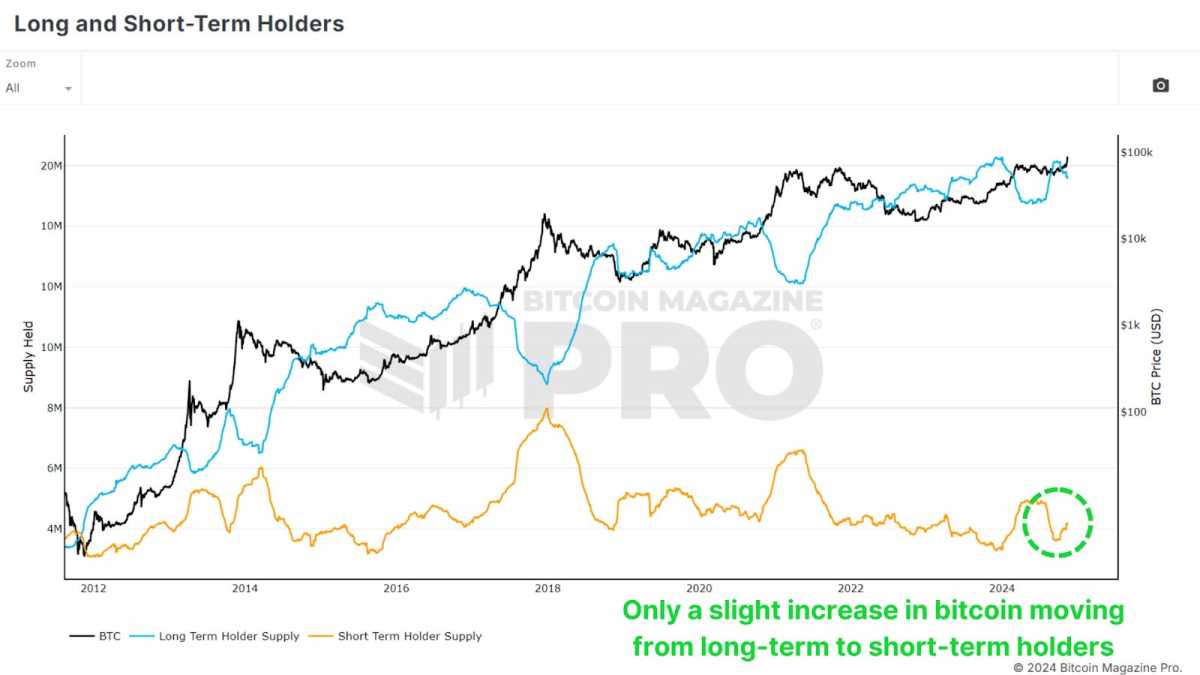
Historically, during the last bull run in 2020-2021, we saw large outflows from long-term holders to newer investors, which fueled a subsequent price rally. Currently, the shift is only minor, and long-term holders seem largely unfazed by current price levels, opting to hold onto their Bitcoin despite market gains. This reluctance to sell suggests that holders are confident in further upside potential.
A Spot-Driven Rally
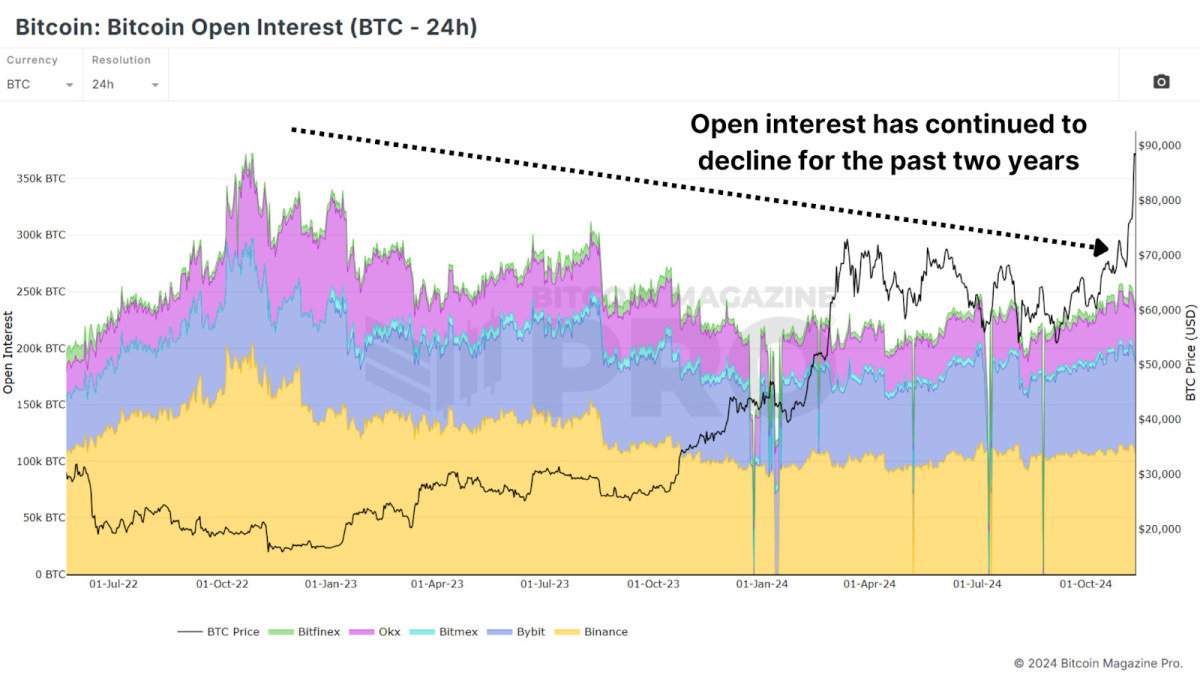
A key aspect of Bitcoin’s latest rally is its spot-driven nature, in contrast to previous bull runs heavily fueled by leveraged positions. Open interest in Bitcoin derivatives has seen only minor increases, which stands in sharp contrast to prior peaks. For instance, open interest was significant before the FTX crash in 2022. A spot-driven market, without excessive leverage, tends to be more stable and resilient, as fewer investors are at risk of forced liquidation.
Big Holders Accumulating
Interestingly, while retail addresses haven’t increased substantially, “whale” addresses holding at least 100 BTC have been rising. Over the past few weeks, wallets with large BTC holdings have added tens of thousands of coins, amounting to billions of dollars in value. This increase signals confidence among Bitcoin’s largest investors that the current price levels have more room to grow, even as Bitcoin reaches all-time highs.
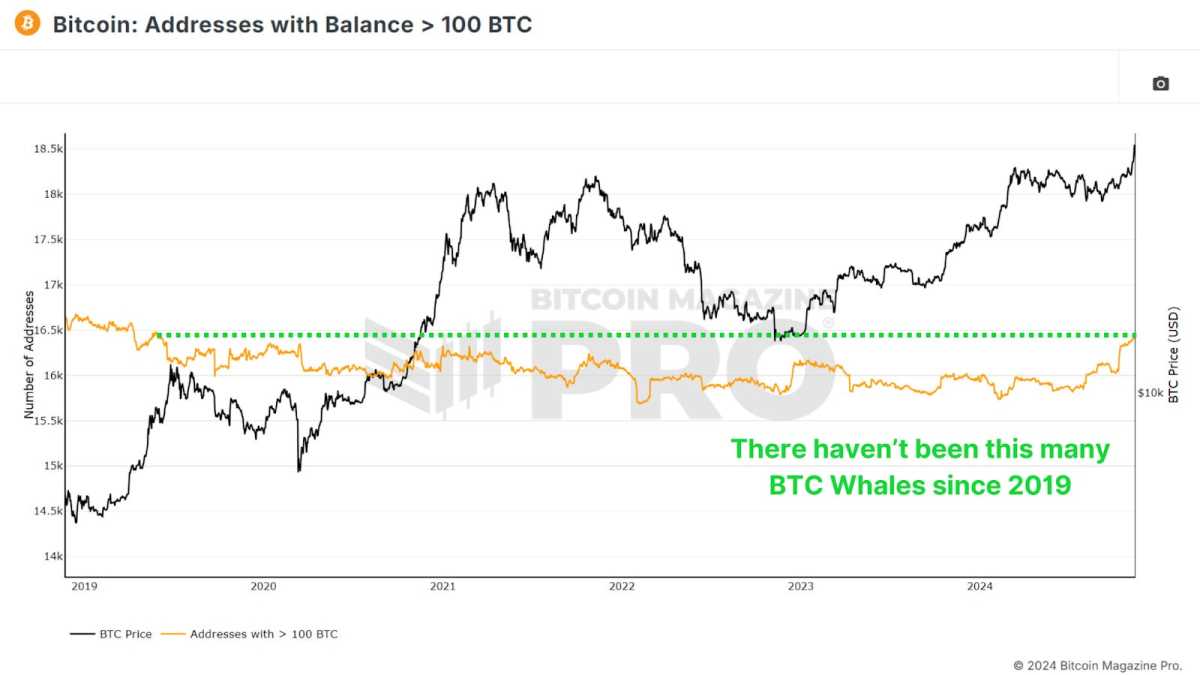
In past bull cycles, we saw whales exit or decrease their positions near market peaks, a behavior we’re not seeing this time. This trend of accumulation by experienced holders is a strong bullish indicator, as it suggests faith in the market’s long-term potential.
Conclusion
While Bitcoin’s rally to all-time highs has brought renewed attention, we’re not yet seeing the telltale signs of widespread retail FOMO. The subdued retail interest suggests we may be only in the beginning phase of this rally. Long-term holders remain confident, whales are accumulating, and leverage remains modest, all indicators of a healthy, sustainable rally.
As we continue into this bull cycle, the market’s structure suggests that the potential for a larger retail-driven surge remains ahead. If this retail interest materializes, it could propel Bitcoin to new heights.
For a more in-depth look into this topic, check out a recent YouTube video here: Has Retail Bitcoin FOMO Begun?
Source link


With all the current bearish sentiment and macroeconomic uncertainty swirling around both Bitcoin and the broader global economy, it might come as a surprise to see miners as bullish as ever. In this article, we’ll unpack the data that suggests Bitcoin miners are not just staying the course, they’re accelerating, doubling down at a time when many are pulling back. What exactly do they know that the broader market might be missing?
For a more in-depth look into this topic, check out a recent YouTube video here:
Why Bitcoin Miners Are Doubling Down Right Now
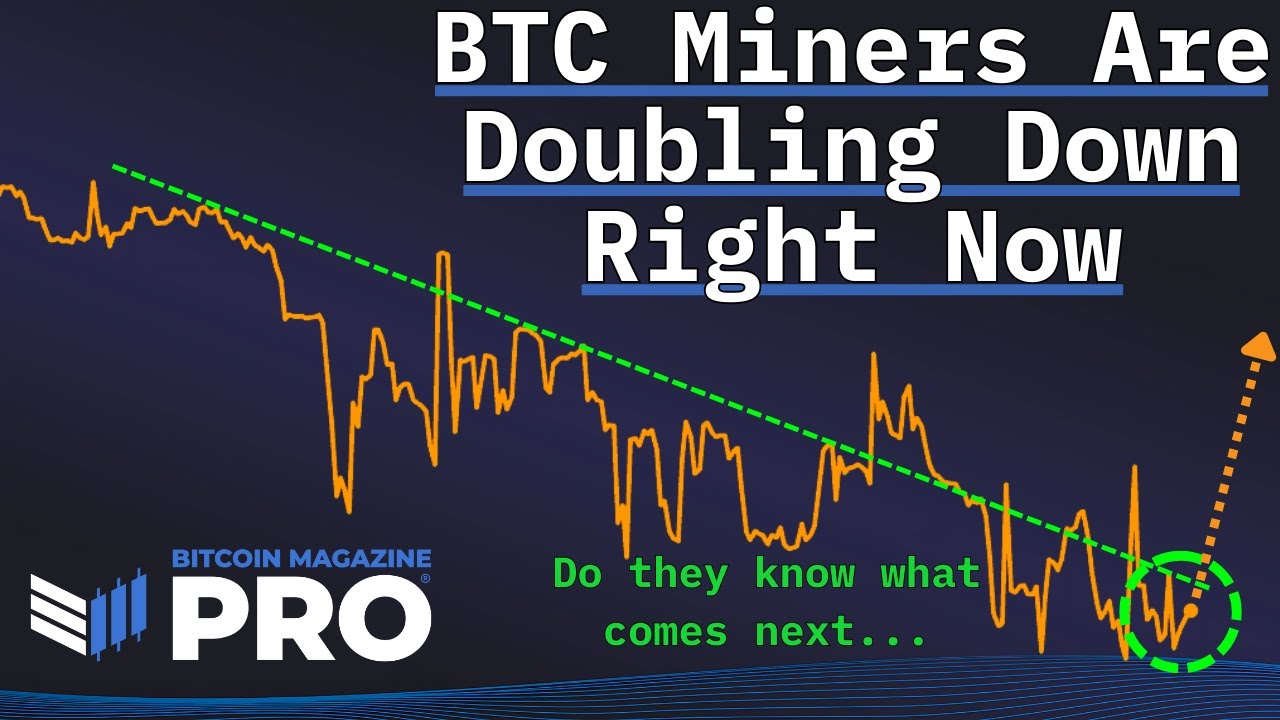
Bitcoin Hash Rate Going Parabolic
Despite Bitcoin’s recent price underperformance, the Bitcoin Hashrate has been going absolutely vertical, breaking all-time highs with seemingly no regard for macro headwinds or sluggish price action. Typically, hash rate is tightly correlated with BTC price; when price drops sharply or remains stagnant, hash rate tends to plateau or decline due to economic pressure on miners.
Yet now, in the face of heightened global tariffs, economic slowdown, and a consolidating BTC price, hash rate is accelerating. Historically, this level of divergence between hash rate and price has been rare and often significant.

Bitcoin Miner Difficulty, a close cousin to hash rate, just saw one of its largest single adjustments upward in history. This metric, which auto-adjusts to keep Bitcoin’s block timing consistent, only increases when more computational power floods the network. A difficulty spike of this magnitude, especially when paired with poor price performance, is nearly unprecedented.
Again, this suggests that miners are investing heavily in infrastructure and resources, even when BTC price does not appear to support the decision in the short term.

Adding further intrigue, the Hash Ribbons Indicator, a blend of short and long-term hash rate moving averages, recently flashed a classic Bitcoin buy signal.
When the 30-day moving average (blue line) crosses back above the 60-day (purple line), it signals the end of miner capitulation and the beginning of renewed miner strength. Visually, the background of the chart shifts from red to white when this crossover occurs. This has often marked powerful inflection points for BTC price.

What’s striking this time around is how aggressively the 30-day moving average is surging away from the 60-day. This is not just a modest recovery, it’s a statement from miners that they are betting heavily on the future.
The Tariff Factor
So, what’s fueling this miner frenzy? One plausible explanation is that miners, especially U.S.-based ones, are trying to front-run the impact of looming tariffs. Bitmain, the dominant producer of mining equipment, is now in the crosshairs of trade policies that could see equipment prices surge by 30–50%, potentially to even over 100%!

Given that over 40% of Bitcoin’s hash rate is controlled by U.S.-based pools like Foundry USA, Mara Pool, and Luxor, any cost increase would drastically reduce profit margins. Miners may be aggressively scaling now while hardware is still (relatively) cheap and available.
Bitcoin Miners Keep Mining
Hashprice, the BTC-denominated revenue per terahash of computational power, is at historical lows. In other words, it’s never been less profitable in BTC terms to operate a Bitcoin miner on a per-terahash basis. Typically, we see hash price increase toward the tail-end of bear markets, as competition fades and weaker players exit the space.

But that’s not happening here. Despite terrible profitability, miners are not only staying online, they’re deploying more hash power. This could imply one of two things; either miners are racing against deteriorating margins to front-load BTC accumulation, or, more optimistically, they have strong conviction in Bitcoin’s future profitability and are buying the dip aggressively.
Bitcoin Miners Conclusion
So, what’s really happening? Either miners are desperately front-running hardware costs, or, more likely, they’re signaling one of the strongest collective votes of confidence in the future of Bitcoin we’ve seen in recent memory. We’ll continue tracking these metrics in future updates to see whether this miner conviction is proven right.

If you’re interested in more in-depth analysis and real-time data, consider checking out Bitcoin Magazine Pro for valuable insights into the Bitcoin market.
Disclaimer: This article is for informational purposes only and should not be considered financial advice. Always do your own research before making any investment decisions.
Source link

Bitcoin has seen an institutional capital influx on a scale previously unfathomable. Billions of dollars are flowing into Bitcoin ETFs, reshaping the liquidity landscape, inflow-outflow dynamics, and investor psychology. While many interpret this movement as smart money executing complex strategies backed by proprietary analytics, a surprising reality surfaces: outperforming the institutions might not be as difficult as it seems.
For a more in-depth look into this topic, check out a recent YouTube video here:
Outperforming Bitcoin – Invest Like Institutions
Canary In The Bitcoin Coal Mine
One of the most revealing datasets available today is daily Bitcoin ETF flow data. These flows, denoted in USD, offer direct insight into how much capital is entering or exiting the Bitcoin ETF ecosystem on any given day. This data has a startlingly consistent relationship with short to mid-term price action.
Importantly, while these flows do impact price, they are not the primary movers of a multi-trillion-dollar market. Instead, ETF activity functions more like a mirror for broad market sentiment, especially as retail traders dominate volume during trend inflections.

Surprisingly Simple
The average retail investor often feels outmatched, overwhelmed by the data, and disconnected from the tactical finesse institutions supposedly wield. But institutional strategies are often simple trend-following mechanisms that can be emulated and even surpassed with disciplined execution and proper risk framing:
Strategy Rules:
- Buy when ETF flows are positive for the day.
- Sell when ETF flows turn negative.
- Execute each trade at daily close, using 100% portfolio allocation for clarity.
- No complex TA, no trendlines, just follow the flows.
This system was tested using Bitcoin Magazine Pro’s ETF data starting from January 2024. The base assumption was a first entry on Jan 11, 2024, at ~$46,434 with subsequent trades dictated by flow changes.

Performance vs. Buy-and-Hold
Backtesting this basic ruleset yielded a return of 118.5% as of the end of March 2025. By contrast, a pure buy-and-hold position over the same period yielded 81.7%, a respectable return, but a near 40% underperformance relative to this proposed Bitcoin ETF strategy.
Importantly, this strategy limits drawdowns by reducing exposure during downtrends, days marked by institutional exits. The compounding benefit of avoiding steep losses, more than catching absolute tops or bottoms, is what drives outperformance.

Institutional Behavior
The prevailing myth is that institutional players operate on superior insight. In reality, the majority of Bitcoin ETF inflows and outflows are trend-confirming, not predictive. Institutions are risk-managed, highly regulated entities; they’re often the last to enter and the first to exit based on trend and compliance cycles.
What this means is that institutional trades tend to reinforce existing price momentum, not lead it. This reinforces the validity of using ETF flows as a proxy signal. When ETFs buy, they’re confirming a directional shift that is already unfolding, allowing the retail investor to “surf the wave” of their capital inflow.

Conclusion
The past year has proven that beating Bitcoin’s buy-and-hold strategy, one of the toughest benchmarks in financial history, is not impossible. It requires neither leverage nor complex modeling. Instead, by aligning oneself with institutional positioning, retail investors can benefit from market structure shifts without the burden of prediction.
This doesn’t mean the strategy will work forever. But as long as institutions continue to influence price through these large, visible flow mechanics, there is an edge to be gained in simply following the money.

If you’re interested in more in-depth analysis and real-time data, consider checking out Bitcoin Magazine Pro for valuable insights into the Bitcoin market.
Disclaimer: This article is for informational purposes only and should not be considered financial advice. Always do your own research before making any investment decisions.
Source link
Following a sharp multi-week selloff that dragged Bitcoin from above $100,000 to below $80,000, the recent price bounce has traders debating whether the Bitcoin bull market is truly back on track or if this is merely a bear market rally before the next macro leg higher.
Bitcoin’s Local Bottom or Bull Market Pause?
Bitcoin’s latest correction was deep enough to rattle confidence, but shallow enough to maintain macro trend structure. Price seems to have set a local bottom between $76K–$77K, and several reliable metrics are beginning to solidify the local lows and point towards further upside.
The Net Unrealized Profit and Loss (NUPL) is one of the most reliable sentiment gauges across Bitcoin cycles. As price fell, NUPL dropped into “Anxiety” territory, but following the rebound, NUPL has now reclaimed the “Belief” zone, a critical sentiment transition historically seen at macro higher lows.

The Value Days Destroyed (VDD) Multiple weighs BTC spending by both coin age and transaction size, and compares the data to a previous yearly average, giving insight into long term holder behavior. Current readings have reset to low levels, suggesting that large, aged coins are not being moved. This is a clear signal of conviction from smart money. Similar dynamics preceded major price rallies in both the 2016/17 and 2020/21 bull cycles.

Bitcoin Long-Term Holders Boost Bull Market
We’re also now seeing the Long Term Holder Supply beginning to climb. After profit-taking above $100K, long-term participants are now re-accumulating at lower levels. Historically, these phases of accumulation have set the foundation for supply squeezes and subsequent parabolic price action.

Bitcoin Hash Ribbons Signal Bull Market Cross
The Hash Ribbons Indicator has just completed a bullish crossover, where the short-term hash rate trend moves above the longer-term average. This signal has historically aligned with bottoms and trend reversals. Given that miner behavior tends to reflect profitability expectations, this cross suggests miners are now confident in higher prices ahead.

Bitcoin Bull Market Tied to Stocks
Despite bullish on-chain data, Bitcoin remains closely tied to macro liquidity trends and equity markets, particularly the S&P 500. As long as that correlation holds, BTC will be partially at the mercy of global monetary policy, risk sentiment, and liquidity flows. While rate cut expectations have helped risk assets bounce, any sharp reversal could cause renewed choppiness for Bitcoin.

Bitcoin Bull Market Outlook
From a data-driven perspective, Bitcoin looks increasingly well-positioned for a sustained continuation of its bull cycle. On-chain metrics paint a compelling picture of resilience for the Bitcoin bull market. The Net Unrealized Profit and Loss (NUPL) has shifted from “Anxiety” during the dip to the “Belief” zone after the rebound—a transition often seen at macro higher lows. Similarly, the Value Days Destroyed (VDD) Multiple has reset to levels signaling conviction among long-term holders, echoing patterns before Bitcoin’s rallies in 2016/17 and 2020/21. These metrics point to structural strength, bolstered by long-term holders aggressively accumulating supply below $80,000.
Further supporting this, the Hash Ribbons indicator’s recent bullish crossover reflects growing miner confidence in Bitcoin’s profitability, a reliable sign of trend reversals historically. This accumulation phase suggests the Bitcoin bull market may be gearing up for a supply squeeze, a dynamic that has fueled parabolic moves before. The data collectively highlights resilience, not weakness, as long-term holders seize the dip as an opportunity. Yet, this strength hinges on more than just on-chain signals—external factors will play a critical role in what comes next.
However, macro conditions still warrant caution, as the Bitcoin bull market doesn’t operate in isolation. Bull markets take time to build momentum, often needing steady accumulation and favorable conditions to ignite the next leg higher. While the local bottom between $76K–$77K seems to hold, the path forward won’t likely feature vertical candles of peak euphoria yet. Bitcoin’s tie to the S&P 500 and global liquidity trends means volatility could emerge from shifts in monetary policy or risk sentiment.
For example, while rate cut expectations have lifted risk assets, an abrupt reversal—perhaps from inflation spikes or geopolitical shocks—could test Bitcoin’s stability. Thus, even with on-chain data signaling a robust setup, the next phase of the Bitcoin bull market will likely unfold in measured steps. Traders anticipating a return to six-figure prices will need patience as the market builds its foundation.
If you’re interested in more in-depth analysis and real-time data, consider checking out Bitcoin Magazine Pro for valuable insights into the Bitcoin market.
Disclaimer: This article is for informational purposes only and should not be considered financial advice. Always do your own research before making any investment decisions.
Source link

Futureverse Acquires Candy Digital, Taps DC Comics and Netflix IP to Boost Metaverse Strategy
Court Grants Ripple And SEC’s Joint Motion To Suspend Appeal

AVAX Falls 2.1% as Nearly All Assets Trade Lower

What is a VTuber, and how do you become one in 2025?

Top Expert’s Update Sets $10 Target

How Academia Interacts With The Bitcoin Ecosystem

AB DAO and Bitget Launch Dual Reward Campaign, Distributing $2.6M Worth of $AB Globally

AI crypto tokens at risk as Nvidia faces restrictions on China exports

Coinbase Urges Australia to Vote for Crypto Progress in May

How High Would Pi Network Price Go If Pi Coin Adopts Transparency to Avoid Mantra Pitfalls

XRP’s ‘Rising Wedge’ Breakdown Puts Focus on $1.6 Price Support

China selling seized crypto to top up coffers as economy slows: Report

Ethereum Price Dips Again—Time to Panic or Opportunity to Buy?

The Inverse Of Clown World”

Bitcoin Indicator Flashing Bullish for First Time in 18 Weeks, Says Analyst Who Called May 2021 Crypto Collapse


 24/7 Cryptocurrency News5 months ago
Arthur Hayes, Murad’s Prediction For Meme Coins, AI & DeFi Coins For 2025

 Bitcoin3 months ago
Expert Sees Bitcoin Dipping To $50K While Bullish Signs Persist

 24/7 Cryptocurrency News3 months ago
Aptos Leverages Chainlink To Enhance Scalability and Data Access

 Bitcoin5 months ago
Bitcoin Could Rally to $80,000 on the Eve of US Elections

 Opinion5 months ago
Crypto’s Big Trump Gamble Is Risky

 Altcoins3 months ago
Sonic Now ‘Golden Standard’ of Layer-2s After Scaling Transactions to 16,000+ per Second, Says Andre Cronje

 Bitcoin5 months ago
Institutional Investors Go All In on Crypto as 57% Plan to Boost Allocations as Bull Run Heats Up, Sygnum Survey Reveals

 Price analysis5 months ago
Ripple-SEC Case Ends, But These 3 Rivals Could Jump 500x
