
cryptocurrency
Bitcoin, crypto stocks surge as Harris congratulates Trump


Crypto stocks surged sharply on Nov. 6 as Donald Trump’s victory for a second term as U.S. president bolstered the market’s bullish outlook.
While cryptocurrencies have ripped in the lead up to the election as betting odds showed Trump was headed for victory, things got juicy on Election Day. Bitcoin (BTC) shot to above $75,000 before taking a breather.
The Trump trade, which relates to conviction that markets would rip if the Republican candidate won, engulfed not just the top coin, but also altcoins. Ethereum (ETH) has jumped above $2,700, Solana (SOL) is eyeing $190 and Dogecoin (DOGE) broke $0.20.
Meanwhile, stocks of crypto related companies, including Coinbase, MicroStrategy and Riot soared pre-market, continuing higher during the U.S. trading session. This came as Vice President Kamala Harris called Trump to congratulate him. Harris was expected to give her concession speech later in the day.
At the time of writing, Coinbase shares had increased by 30% to $253.58, marking a 50% gain over the past month and a 193% rise over the past year.
MicroStrategy, the largest corporate holder of Bitcoin, saw its stock rise nearly 13% on the day and 40% over the last 30 days. MSTR has outperformed most stocks, delivering a return of over 460% in the past year.
Other stocks making notable gains included Bitcoin mining companies Marathon Digital, Riot Platforms, CleanSpark, and Hut 8. Marathon (MARA) was up 19%, Riot (RIOT) +21%, CleanSpark (CLSK) +20%, and Hut 8 (HUT) +9%, following positive quarterly results.
Robinhood, which offers crypto trading, also recorded significant gains, while Block Inc. was up on the day. Robinhood (HOOD) has gained 20% so far, and Block (SQ) has risen more than 7%.
Source link


Disclosure: The views and opinions expressed here belong solely to the author and do not represent the views and opinions of crypto.news’ editorial.
Although some believe that crypto PR and communications efforts should slow down when the markets are cooling off, it couldn’t be further from the truth. Sure, during crypto winters, product development teams huddle together to work on building their solutions—and that’s great—but these are also the ideal times for brand building.
Indeed, when the market is going through a crypto slowdown, the strategic brands are seizing the opportunity to strengthen credibility while everyone else is hibernating. And when the market inevitably heats up, this strategy will position such players ahead of the competition.
Now, not all might agree with this point of view, arguing that pushing PR during a downturn is tone-deaf. Others might see slow market communications as unnecessary noise when product development should be the only priority. But visibility isn’t vanity—it’s strategy, and it’s easier to get noticed in calmer markets.
Slower news, hungrier journalists
As the movements in the crypto market slow down, so does everything else that relates to it, including newsrooms. In other words, journalists have more space (and patience) for stories that go beyond mere price action. There are no big stories of exploding digital assets. Bitcoin (BTC) is nowhere near reaching a new all-time high, and altcoins are taking the cue from the industry’s number one, sleeping it off themselves.
Thus, when the hype and the noise in the crypto sphere die down, media outlets are on the lookout for stories worth telling. In such moments, true innovation and strong projects get their chance to shine and get real editorial interest, instead of getting lost among drama-driven headlines.
Small news can be perceived as newsworthy in a bear market
Here’s a secret—during a bull run, not even a $10 million funding round might turn heads. It’s just too common when there’s money flowing everywhere across the board. To illustrate, an insider source at a crypto media powerhouse once said that their “funding news coverage threshold is a minimum of $10 million, with exceptions.”
This might sound counterintuitive at first, but in a more bearish market sentiment, that same outlet might just be interested in a mere $5 million, or even a $1.4 million seed round, like the one recently raised by crypto payment hub Lyzi to expand its Tezos-based service.
In other words, Lyzi has just told the world that it’s there and constantly working on building its product. Arguably, in a period of market pessimism, it would be one hell of a smart and well-timed PR move, and the best part—the likes of CoinDesk might pick it up.
Pick up the mic when no one else is talking
Providing expert commentary when the industry goes silent becomes even more valuable. Journalists still seek third-party sources and insights, and this is your chance to establish yourself as an authoritative figure in the sector, to whom journalists will come back when the bull market returns.
This means that when it’s all quiet on the crypto front and a journalist comes knocking at your door, be ready. Hiring a good PR firm that will lead you, shape your story, and provide the stage is certainly the right move, but it’s up to you to step up with confidence and claim the spotlight.
Execution still matters
With this in mind, don’t mindlessly drop news just for the sake of it. Be strategic about timing, like holidays, conferences, and other major events that might overshadow your news, as well as the tone—this isn’t the time to brag but display resilience and value.
Also, use the time of market bearishness to build your reputation and flesh out your digital footprint through earned media placements in trusted crypto outlets. Potential users, partners, and investors will look you up online, so make sure they have good things to read about you—that’s your PR working in the background.
The real bottom line
All things considered, crypto PR in times of market stagnation and bearish sentiment is not so much about creating hype as it is about demonstrating real substance. It’s about crafting a narrative that portrays you as the crypto player who can weather the blizzard, better positioning your brand.
So, the next time you’re considering staying silent during a crypto downturn, think again. You might miss out on the best PR opportunities of the cycle, as at this time, you could get more attention than usual.
Don’t wait for the bull to charge—make your mark when the field is clear.

Source link

Reason to trust
![]()
Strict editorial policy that focuses on accuracy, relevance, and impartiality
Created by industry experts and meticulously reviewed
The highest standards in reporting and publishing
Strict editorial policy that focuses on accuracy, relevance, and impartiality
Morbi pretium leo et nisl aliquam mollis. Quisque arcu lorem, ultricies quis pellentesque nec, ullamcorper eu odio.
As Bitcoin (BTC) edges closer to the psychologically significant $100,000 milestone, several technical and on-chain indicators suggest that a major breakout could be on the horizon. One such metric – Bitcoin’s Apparent Demand – has shown a strong rebound, signalling renewed interest and sustained accumulation in the market.
Bitcoin Sees Sharp Rebound In Apparent Demand
According to a recent CryptoQuant Quicktake post, contributor IT Tech pointed to a significant rise in BTC’s Apparent Demand. Most notably, this key indicator has returned to positive territory after spending several consecutive weeks in the red.
Related Reading
For the uninitiated, Bitcoin’s Apparent Demand (30-day sum) measures the cumulative net demand for BTC over the past 30 days by tracking wallet accumulation and exchange outflows. A sharp increase in this metric suggests strong, sustained buying pressure, which can indicate bullish sentiment and potential for a price rally.
The following chart illustrates this rebound in BTC’s Apparent Demand, which essentially reflects net changes in one-year inactive supply adjusted by daily block rewards – a metric designed to better represent organic demand growth.

Previously, this metric had fallen deeply into negative territory – dipping below -200,000 (highlighted in red) – suggesting waning demand. However, its recent reversal into positive territory signals that long-dormant capital is flowing back into the market. As noted in the post:
The demand pivot is closely aligned with the recent price rebound above $87K, implying this recovery is underpinned by real on-chain behavior rather than purely speculative flows.
This marks the first positive Apparent Demand reading since February and aligns with rising inflows into spot Bitcoin exchange-traded funds (ETFs), as well as growing accumulation by long-term holders.
Data from SoSoValue shows that US-based spot BTC ETFs have recorded five consecutive days of net positive inflows, totalling more than $2.5 billion. The cumulative net inflow into spot BTC ETFs now stands at an impressive $38.05 billion.
Is A BTC Rally In Sight?
IT Tech noted that past reversals in Apparent Demand have historically preceded either significant rallies or periods of strong price support. If the current trend continues, BTC may have the momentum needed to challenge the $90,000 level in the near term.
Related Reading
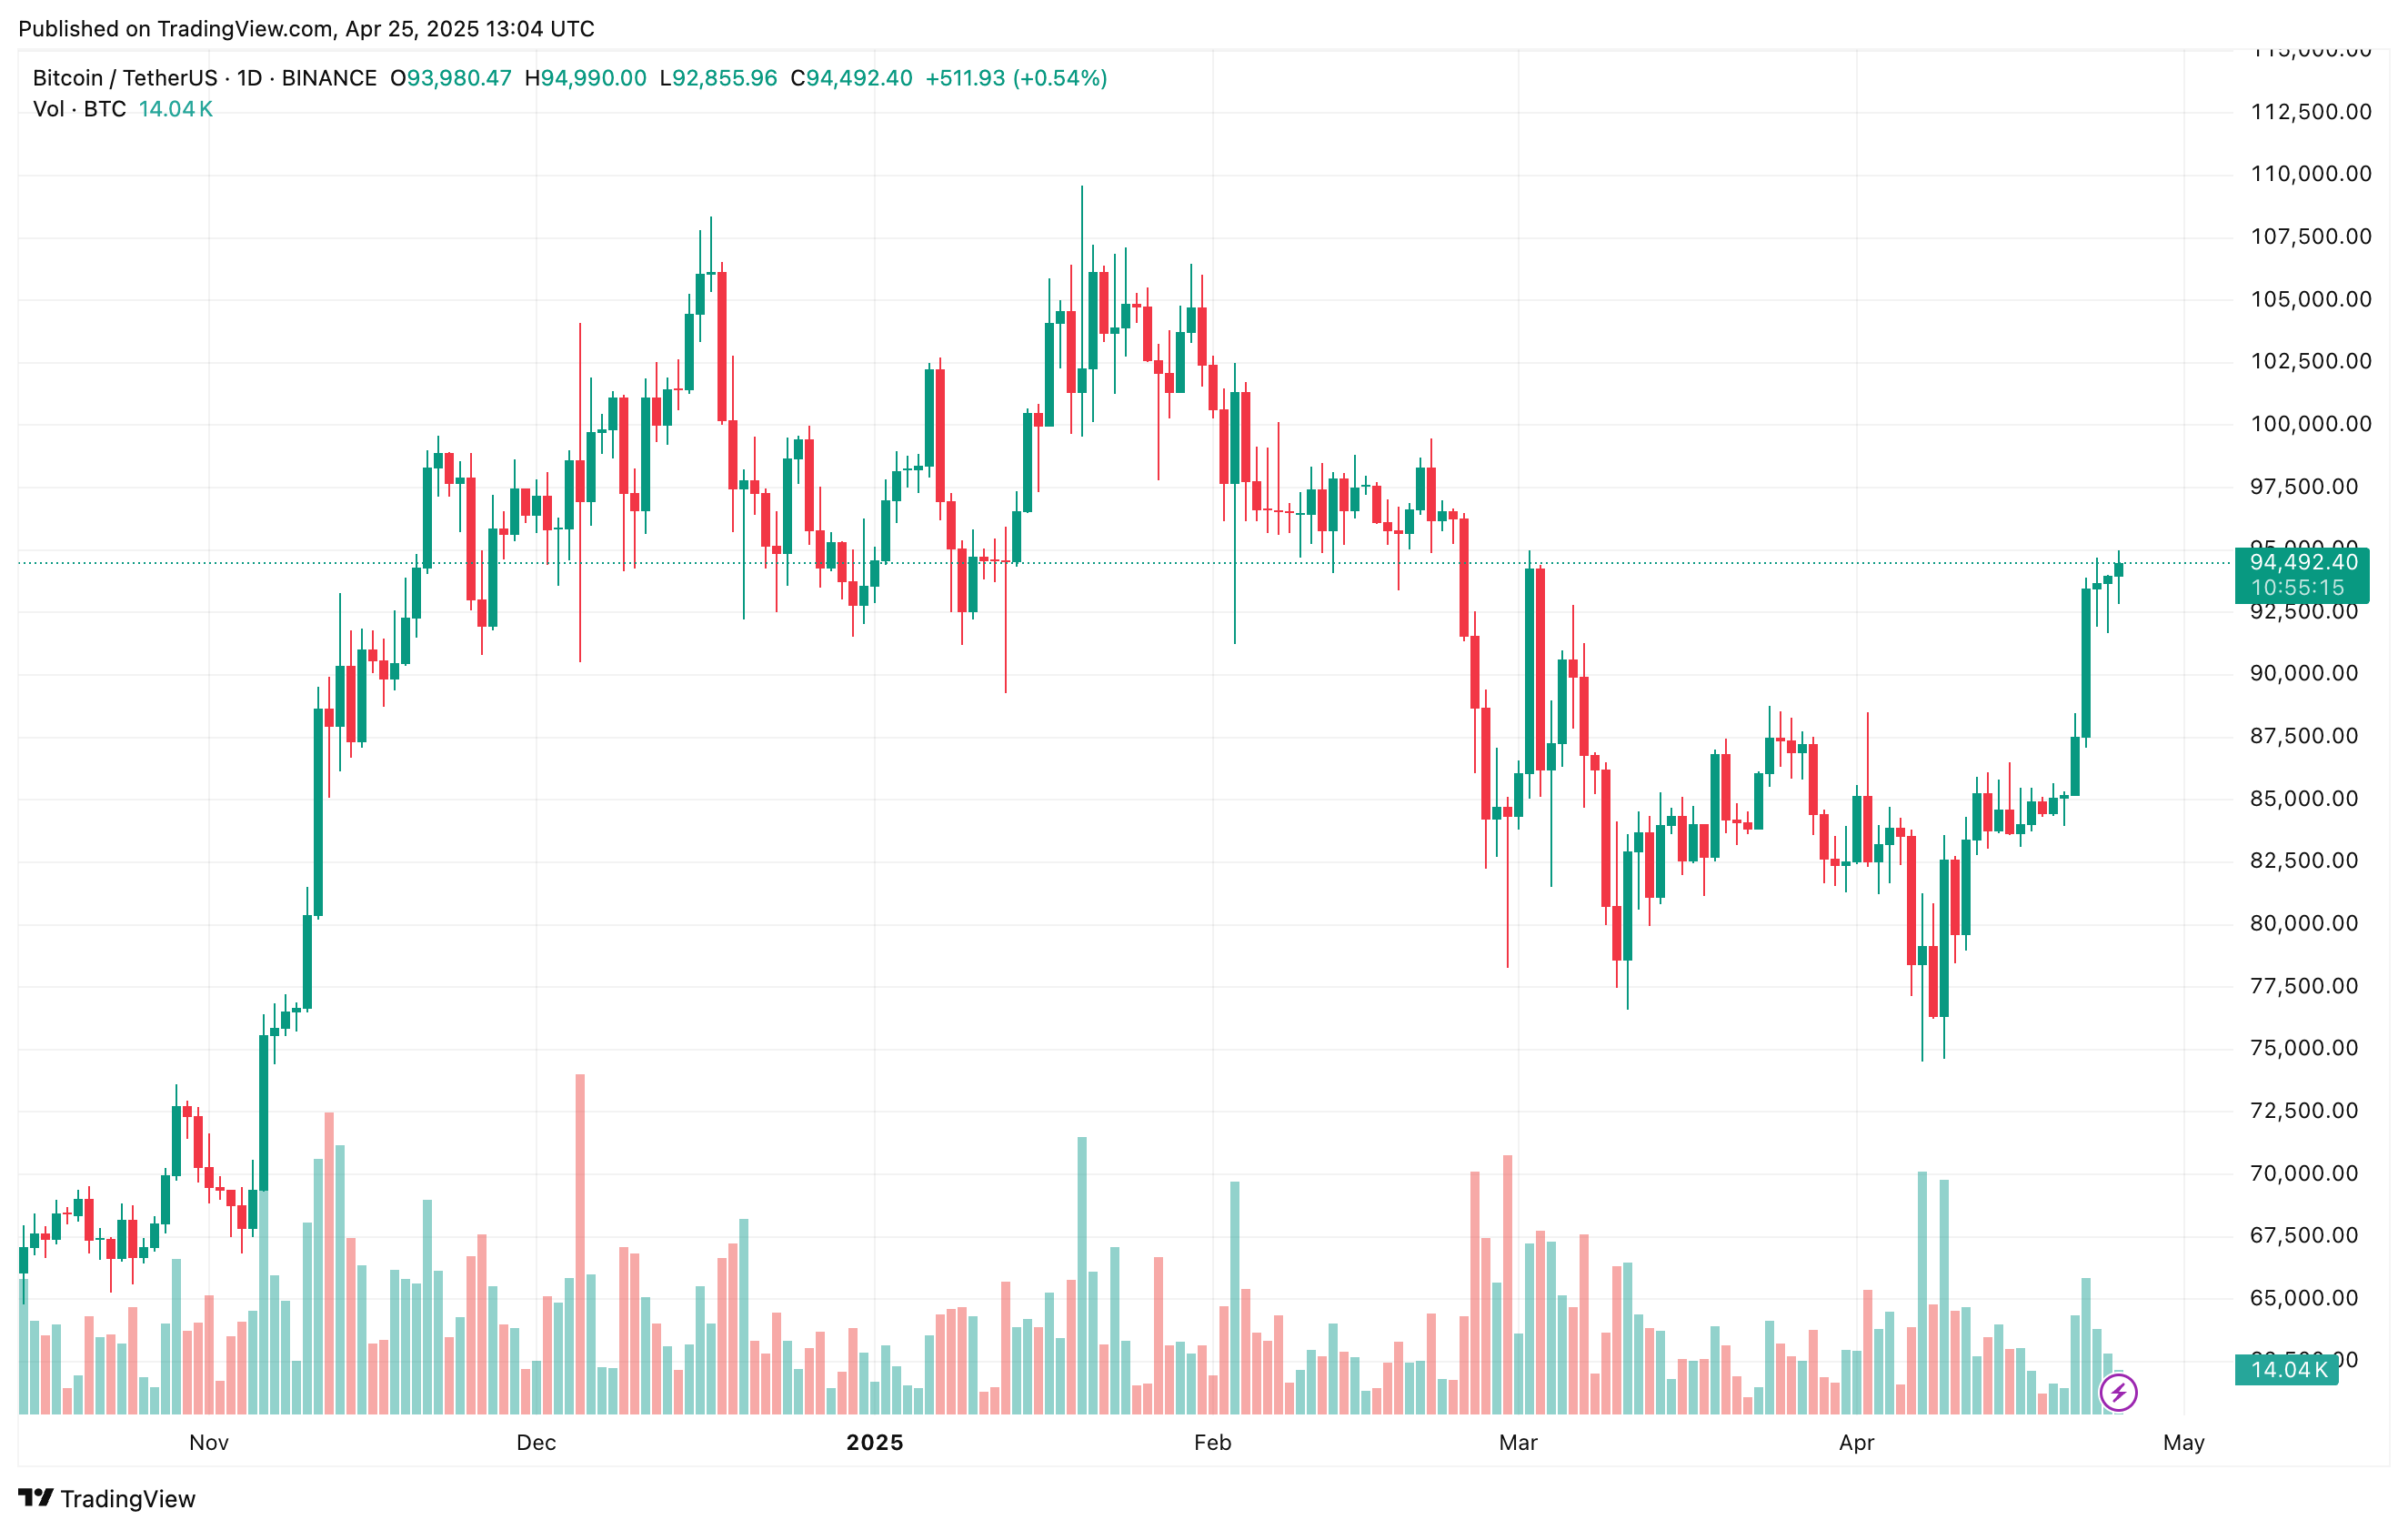
However, analysts caution that Bitcoin must hold its current support around $91,500 to maintain upward momentum. This level is particularly important because it is close to the realized price of short-term BTC holders, according to CryptoQuant contributor Crazzyblockk.
Further adding to this outlook, prominent crypto analyst Rekt Capital emphasized that Bitcoin needs to secure a weekly close above $93,500 and reclaim it as support in order to establish a clear path to $100,000. At press time, BTC trades at $94,492, up 2% in the last 24 hours.
Featured image from Unsplash, charts from CryptoQuant and Tradingview.com
Source link

Reason to trust
![]()
Strict editorial policy that focuses on accuracy, relevance, and impartiality
Created by industry experts and meticulously reviewed
The highest standards in reporting and publishing
Strict editorial policy that focuses on accuracy, relevance, and impartiality
Morbi pretium leo et nisl aliquam mollis. Quisque arcu lorem, ultricies quis pellentesque nec, ullamcorper eu odio.
In a recent CryptoQuant Quicktake post, contributor Crazzyblockk highlighted key Bitcoin (BTC) cost basis zones that the leading cryptocurrency must clear – or avoid breaking below – to sustain its bullish momentum.
Analyst Highlights Key Bitcoin Cost Basis Zones
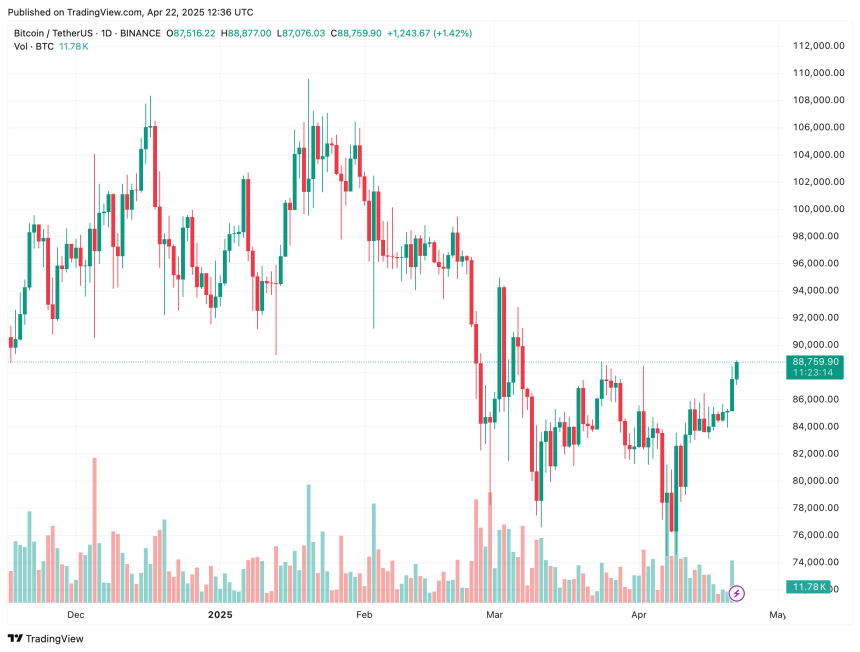
Bitcoin is beginning to show signs of newfound strength, with the top digital asset surging nearly 3.5% over the past week and trading in the high $80,000 range at the time of writing. BTC’s rise amid the global equity market downturn has reignited discussions about the cryptocurrency’s potential to ‘decouple’ from traditional markets.
Related Reading
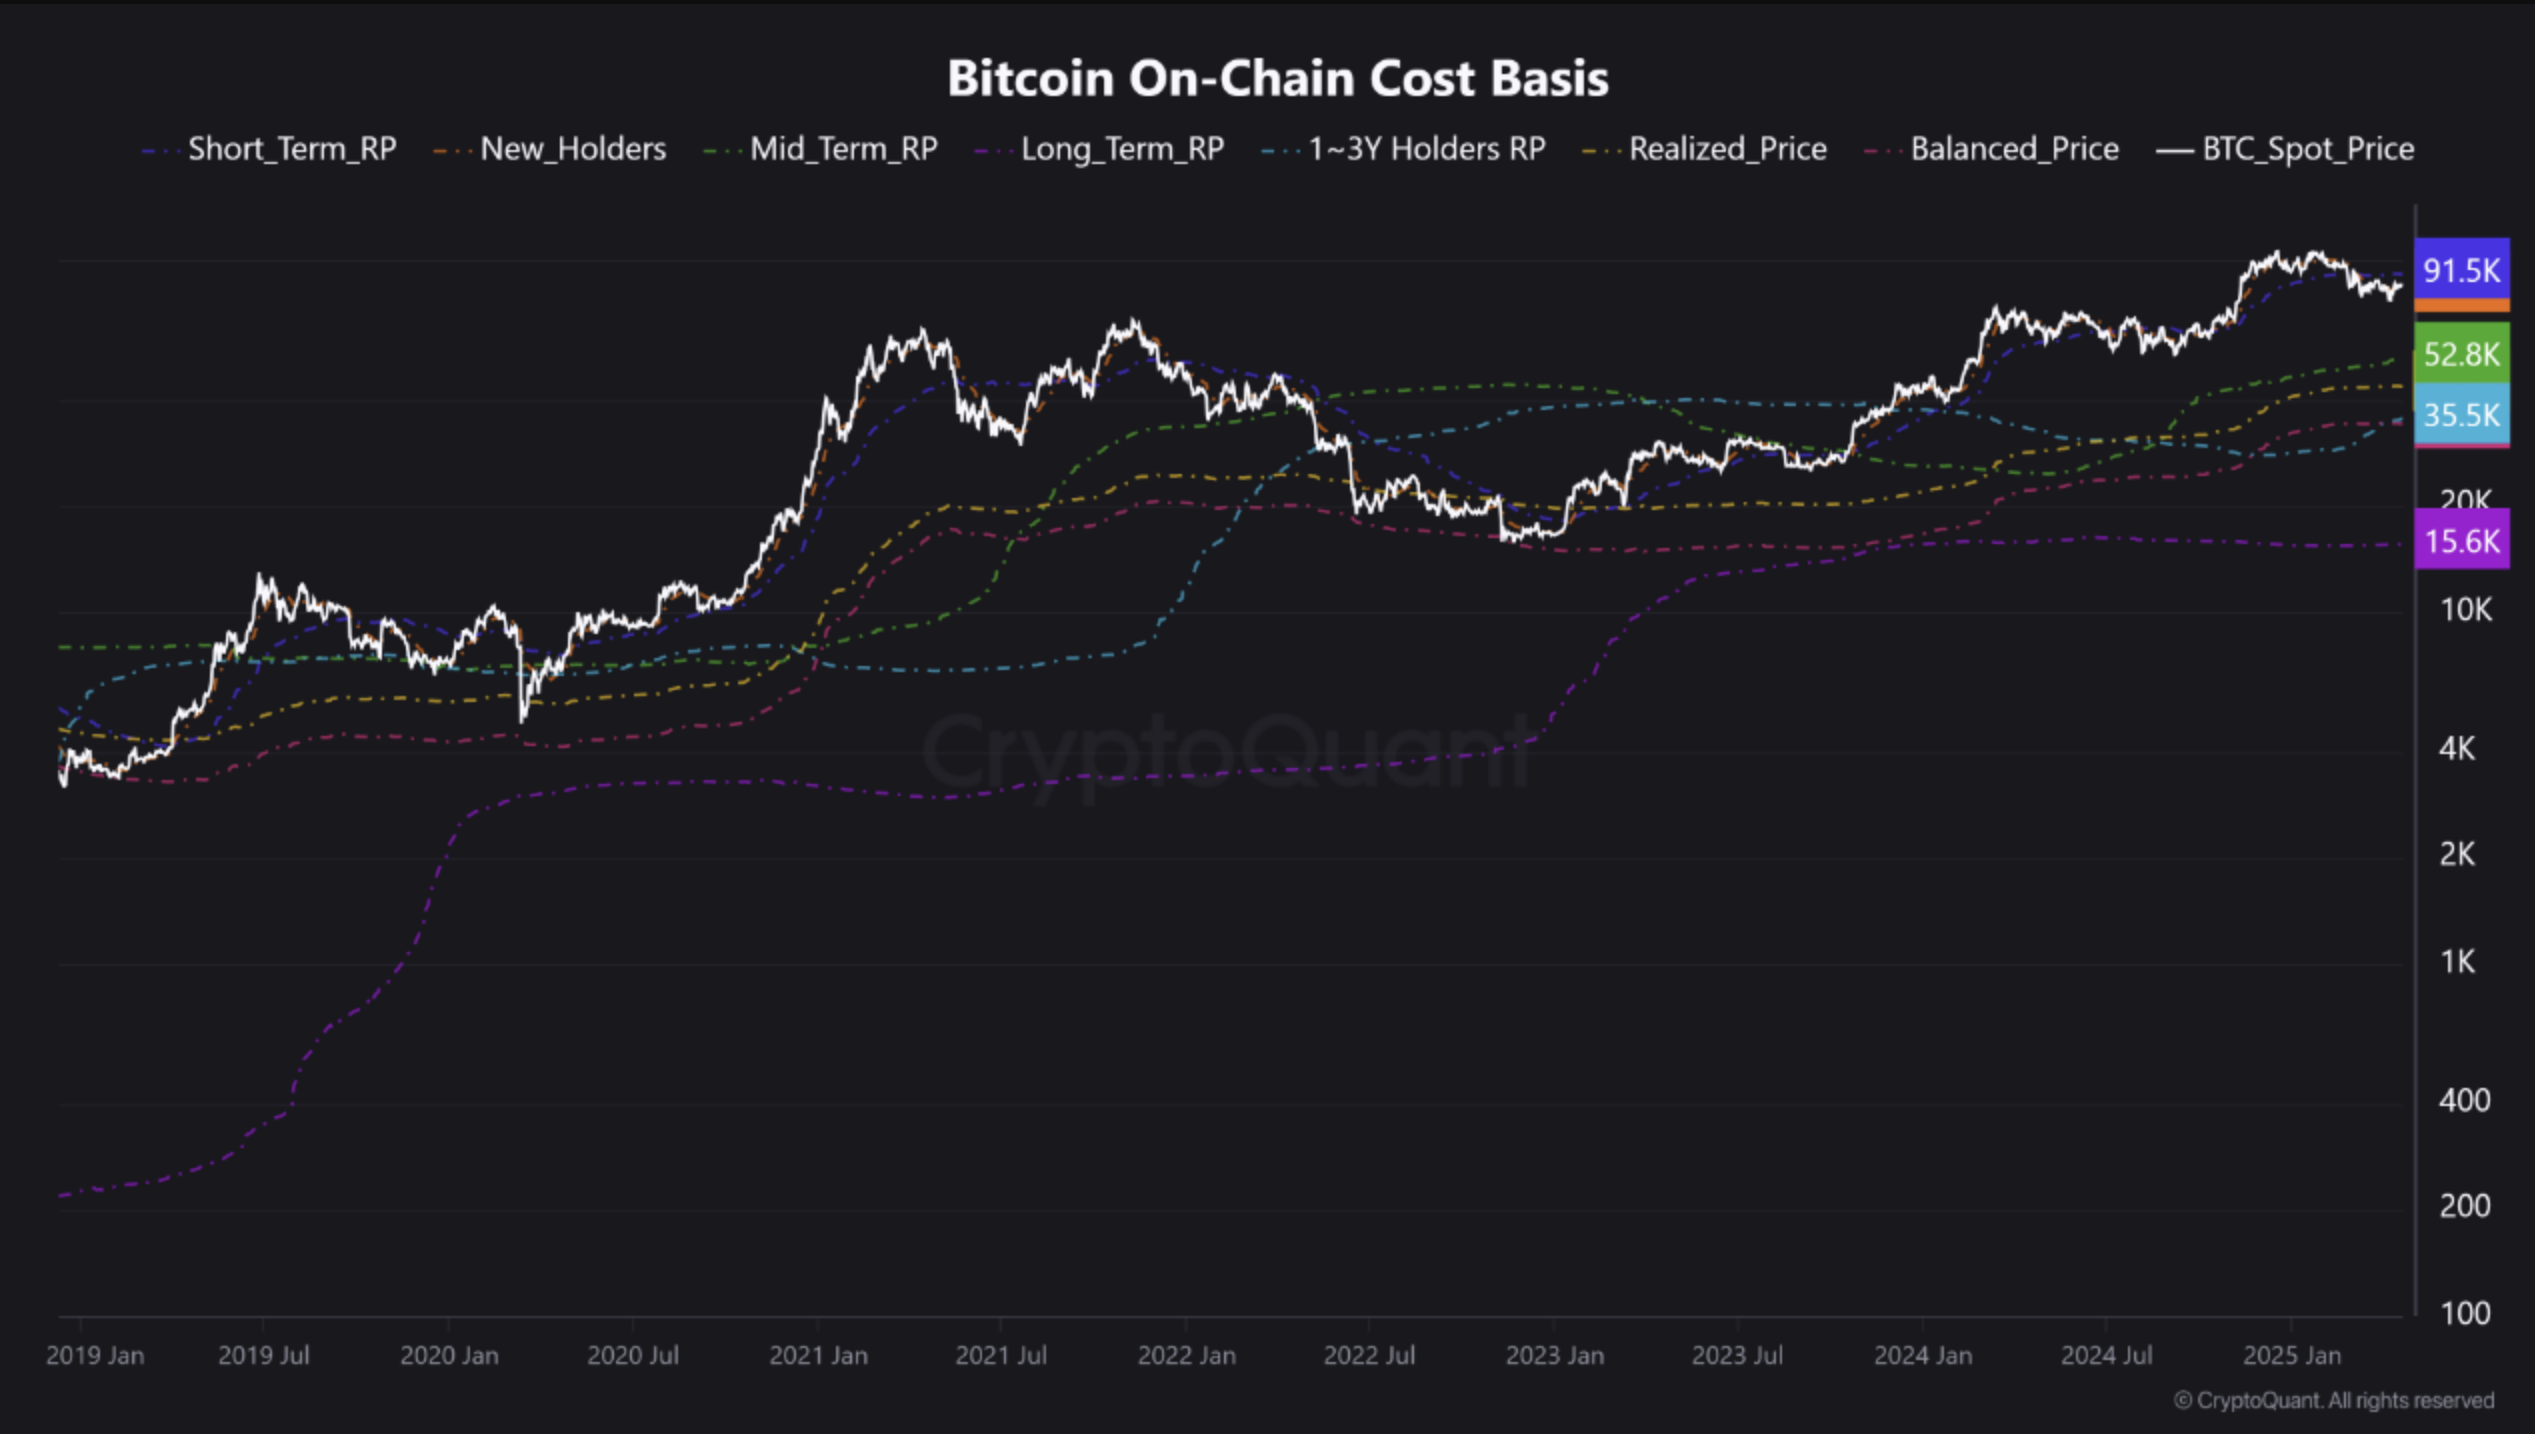
In a recent Quicktake post, CryptoQuant contributor Crazzyblockk outlined Bitcoin’s various cost basis zones and realized price cohorts to identify key resistance and support levels.
The analyst noted that short-term holders – those who have held BTC for less than 155 days – currently have their realized price, or average cost, sitting at the $91,500 resistance level. Crazzyblockk added that this group tends to be the most price-sensitive.
On the other hand, the cost basis for new holders – those who have held the digital asset for one to three months – currently has its strongest support level around $83,700. The analyst pointed out that this level represents the cost basis of recent market participants, who often lead short-term trend changes.
To clarify, cost basis zones are price levels where a significant amount of BTC was last moved or acquired. A potential breakout above the short-term holders’ realized price would suggest new bullish momentum, as these holders would be back in profit and less likely to sell their holdings.
Conversely, a break below the new holders’ cost basis support level could signal potential downside movement, as recent buyers might begin incurring losses and be forced to capitulate.
Notably, each cost basis line highlighted in the chart below is calculated based on the realized price of Unspent Transaction Outputs (UTXOs) held within a specific age band. Similarly, realized price is determined by dividing the total value of all UTXOs by the number of coins.
Are Investors Expecting Further Upside?
Recent on-chain analysis suggests that BTC holders may be anticipating further upside. Short-term holders appear to be holding onto their BTC despite being in a loss position.
Related Reading
Additionally, crypto exchange net flow data hints that a BTC price rally may be imminent. Some analysts are also drawing parallels to gold’s recent historic price action and predicting that ‘digital gold’ may soon experience similar momentum.
That said, Bitcoin futures index sentiment is pointing toward rising pessimism surrounding BTC, driven by macroeconomic uncertainty. As of press time, BTC is trading at $88,759, up 1.7% in the last 24 hours.
Featured image created with Unsplash, charts from CryptoQuant and TradingView.com
Source link

This Week in Crypto Games: Ubisoft’s ‘Might & Magic’, ‘Peaky Blinders’ in Development

Why Arbitrum-Nvidia Partnership Collapsed – And What It Means for Web3

Tariff Carnage Starting to Fulfill BTC’s ‘Store of Value’ Promise

The cost of innovation — Regulations are Web3’s greatest asset

Best Crypto to Buy as Derivatives Exchange CME Set to Launch XRP Futures

Metaplanet Buys Additional ¥1.92 Billion Worth Of Bitcoin

Here Are Four Signs the Stock Market Has Bottomed, According to Fundstrat’s Tom Lee

Bitcoin dips below $94,000 as ETFs record $3b weekly inflow

Bitcoin Post-Halving Price Performance Is the Worst on Record. Why?

Expert Predicts Start Date For Pi Network Price Pump

GameFi Tokens Show Signs of Life After Gala Games, White House Tie-Up

Bitcoin trades at ‘40% discount’ as spot BTC ETF buying soars to $3B in one week

Bitcoin Continues To Flow Out Of Major Exchanges — Supply Squeeze Soon?

BlackRock’s Bitcoin ETF Sees $643 Million Inflows

DePIN Altcoin Outpaces Crypto Market and Skyrockets by Nearly 44% Following High-Profile Exchange Listing


 24/7 Cryptocurrency News6 months ago
Arthur Hayes, Murad’s Prediction For Meme Coins, AI & DeFi Coins For 2025

 Bitcoin3 months ago
Expert Sees Bitcoin Dipping To $50K While Bullish Signs Persist

 Ripple Price1 month ago
3 Voting Polls Show Why Ripple’s XRP Price Could Hit $10 Soon

 24/7 Cryptocurrency News4 months ago
Aptos Leverages Chainlink To Enhance Scalability and Data Access

 Bitcoin6 months ago
Bitcoin Could Rally to $80,000 on the Eve of US Elections

 Opinion6 months ago
Crypto’s Big Trump Gamble Is Risky

 Altcoins3 months ago
Sonic Now ‘Golden Standard’ of Layer-2s After Scaling Transactions to 16,000+ per Second, Says Andre Cronje

 Bitcoin5 months ago
Institutional Investors Go All In on Crypto as 57% Plan to Boost Allocations as Bull Run Heats Up, Sygnum Survey Reveals
