Altcoin
Bitcoin Flash Crash Drags Meme Coins Down: Doge, Shiba, Pepe
Published
5 months agoon
By
admin
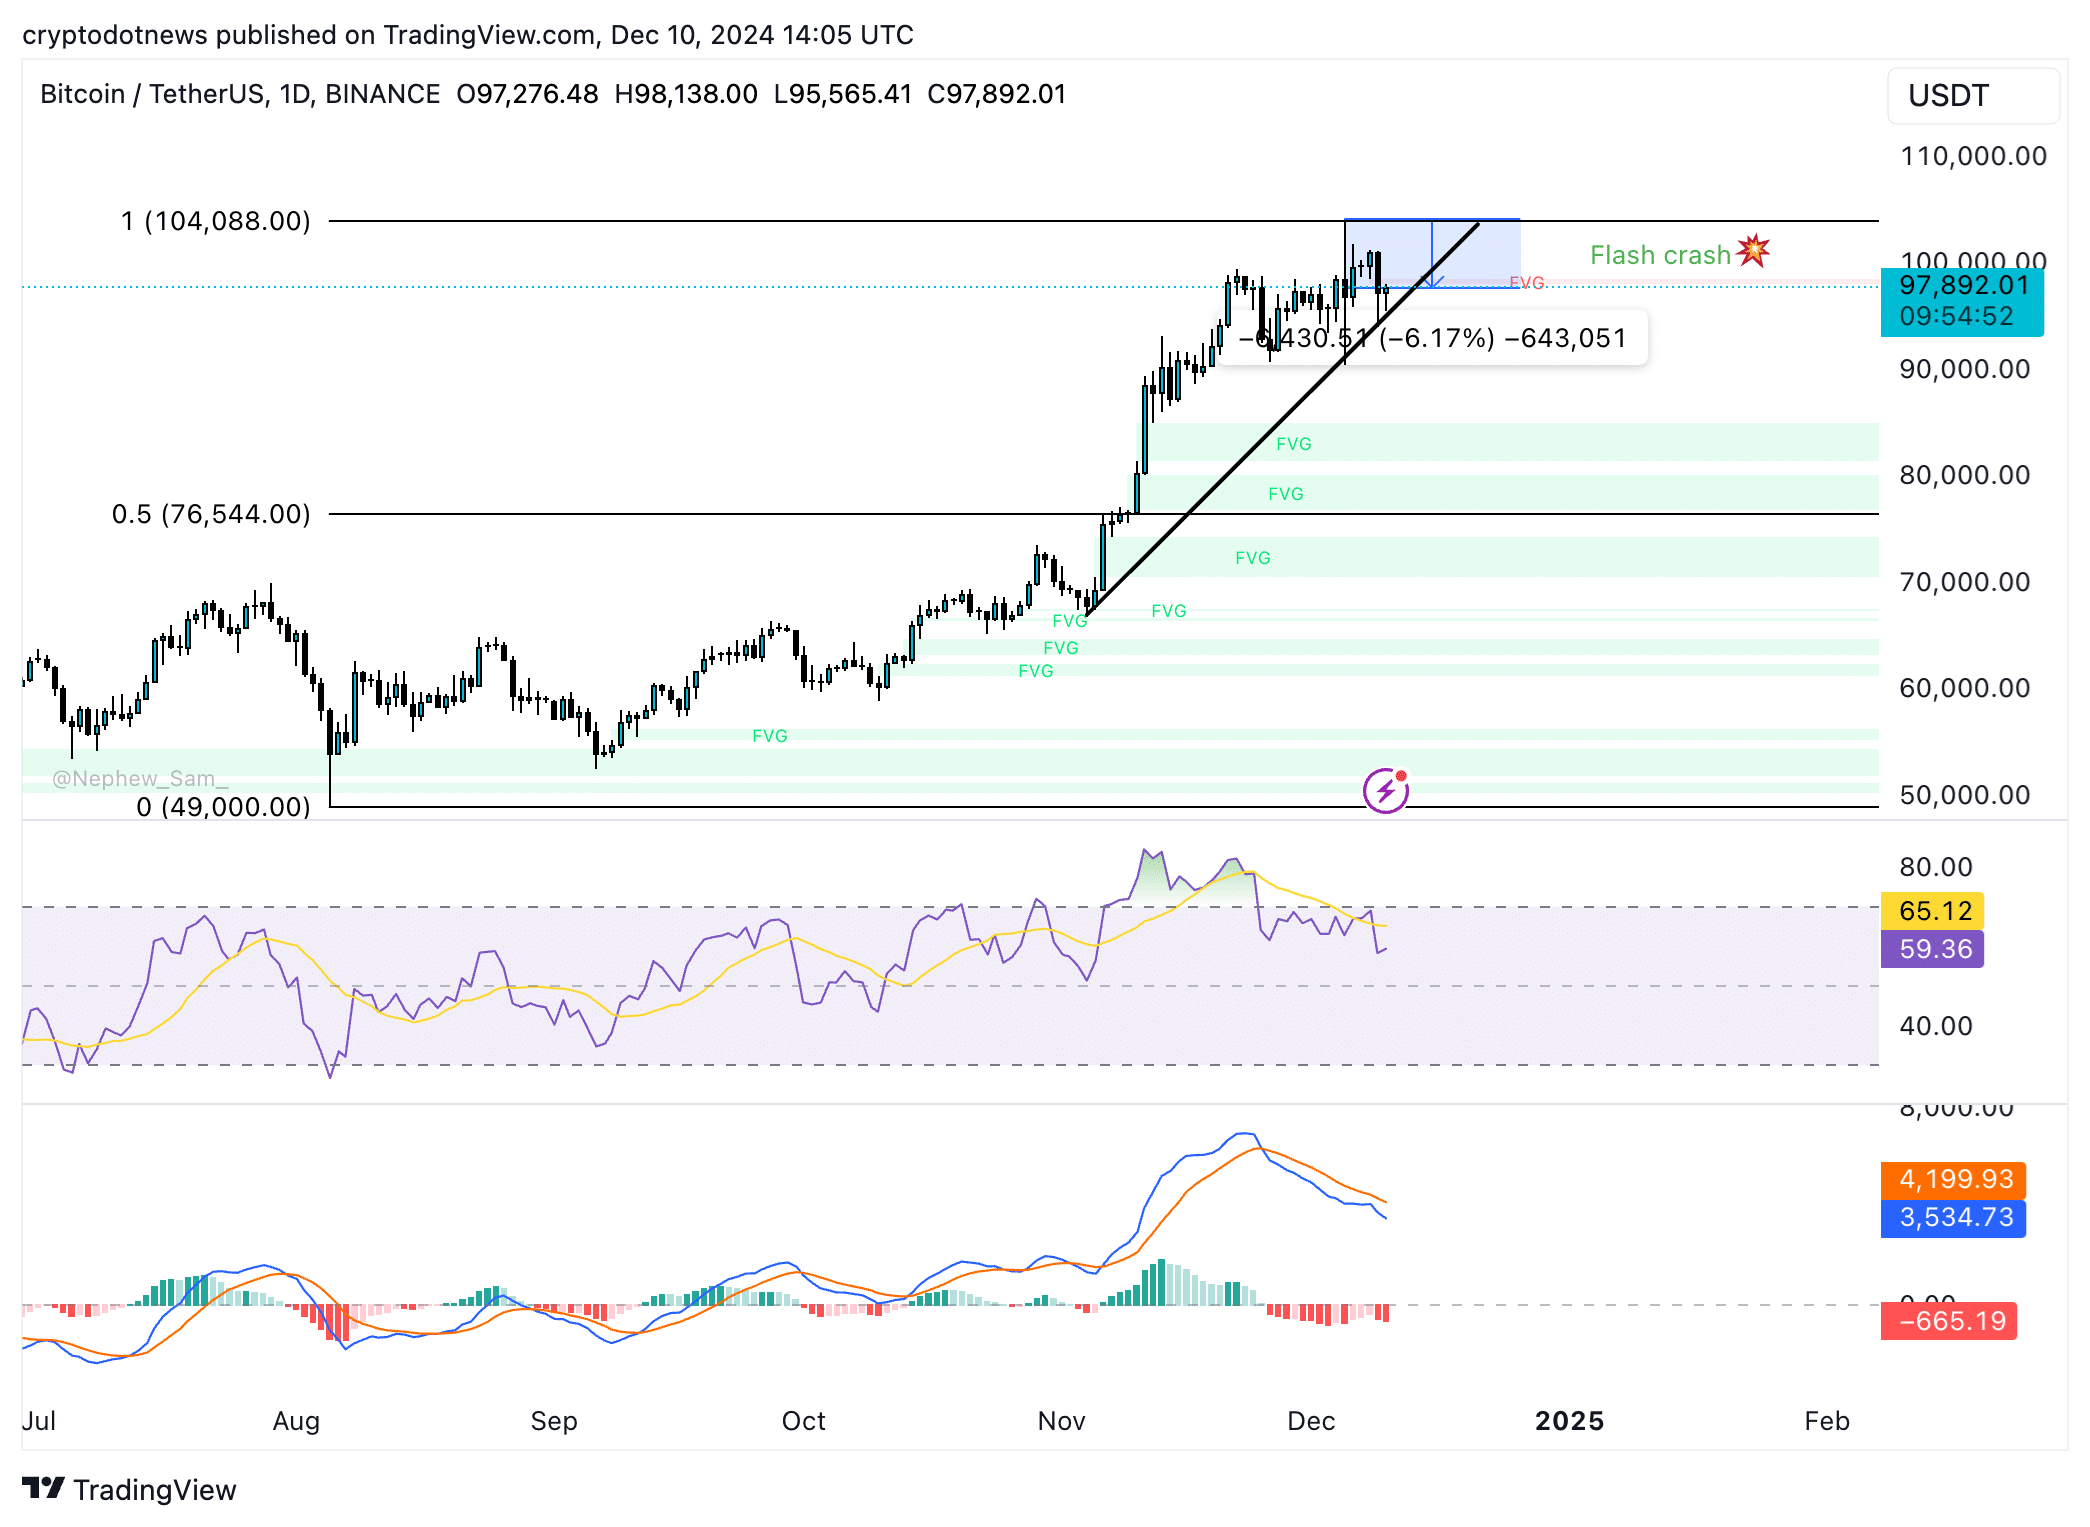
Bitcoin crashed nearly 10% below its all-time high of $104,088 to a low of $94,150 on Monday. The flash crash was short-lived, but it dragged down altcoins and meme coins like Dogecoin, Shiba Inu, Pepe, Dogwifhat and Bonk.
The top 10 meme coins ranked by market capitalization noted nearly double-digit losses in the past 24 hours. As altcoin season ends abruptly, it remains to be seen whether meme coins can recover from their recent losses and hit their cycle bottom.
Bitcoin correction and meme coin price trend
Bitcoin trades nearly 6% below its all-time high on Tuesday. The largest cryptocurrency’s flash crash ended the altcoin season. The blockchain centre altcoin season index reads 65 on a scale from 0 to 100, meaning the alt season has ended.
Technical indicators show mixed signals on where the BTC price is headed; the relative strength index reads 59 and is sloping upwards. However, moving average convergence divergence shows underlying negative momentum in the Bitcoin price trend.
Further correction in Bitcoin does not bode well for meme coins as a decline in the largest cryptocurrency ushers mass liquidation in meme coins and altcoins across derivatives exchanges.
Meme coins have suffered a steep decline in the past 24 hours, and while the tokens have started a recovery in the past hour, there have been double-digit corrections across the top 10 tokens.
The meme category erased nearly 15% in market capitalization in the past 24 hours, down to $128.26 billion.

Meme coins and Santa rally
While meme coins led gains this altcoin season, it remains to be seen whether the “seasonal” gains will push prices higher. Typically, during the Christmas holidays, altcoins tend to rally, this is a result of less activity across crypto exchanges and a relatively lower volume of trades.
Both factors make it easier for the market to move and prices to fluctuate against lower liquidity.
Meme coin price charts show tokens have rallied ahead of Christmas on previous instances, if history repeats meme tokens lead by Dogecoin could recover lost ground and make a comeback before the end of 2024.
DOGE has rallied nearly 350% year-to-date. In the same timeframe, SHIB, PEPE, WIF and BONK gained 160%, 1,860%, 145% and 180% respectively.
Despite the recent pullback in meme coin prices, each of the tokens in the top five has yielded over three-digit gains for hodlers in 2024. This supports a thesis of price recovery and year-end rally for the category.
Trump correlation and bullish drivers
The incoming U.S. President Donald Trump and his Department of Government Efficiency D.O.G.E, led by tech giant Elon Musk and fellow Presidential candidate Vivek Ramaswamy have acted as key drivers of the meme coin rally this cycle.
Elon Musk’s comments and D.O.G.E’s incorporation are top market movers for DOGE, other factors like capital rotation from altcoins and altcoin season drove meme coin prices higher in the past four weeks.
While several meme coins rank among trending tokens every day, DOGE, SHIB, PEPE, WIF and BONK have earned the reputation of blue-chip meme coins. The tokens have a market capitalization of between $1.21 billion and $15.33 billion, per CoinGecko data.
Even as top five cryptocurrencies compete with each other, Solana battles XRP and Ethereum for market share, meme coins play a crucial role in the narrative. A report by 21Shares published earlier this week states meme coins contributed to a majority of the trade volume across Solana-based decentralized exchanges.
Data from the Artemis Terminal shows that as of November 27, meme coins have achieved a 261% year-to-date growth, making them the second-best-performing sector in the crypto space, trailing only Real-world assets.
LBank, a cryptocurrency exchange platform, identified the top 10 meme coins of 2024 that include tokens that are not considered blue-chip but outperformed the sector.

Technical analysis and price targets
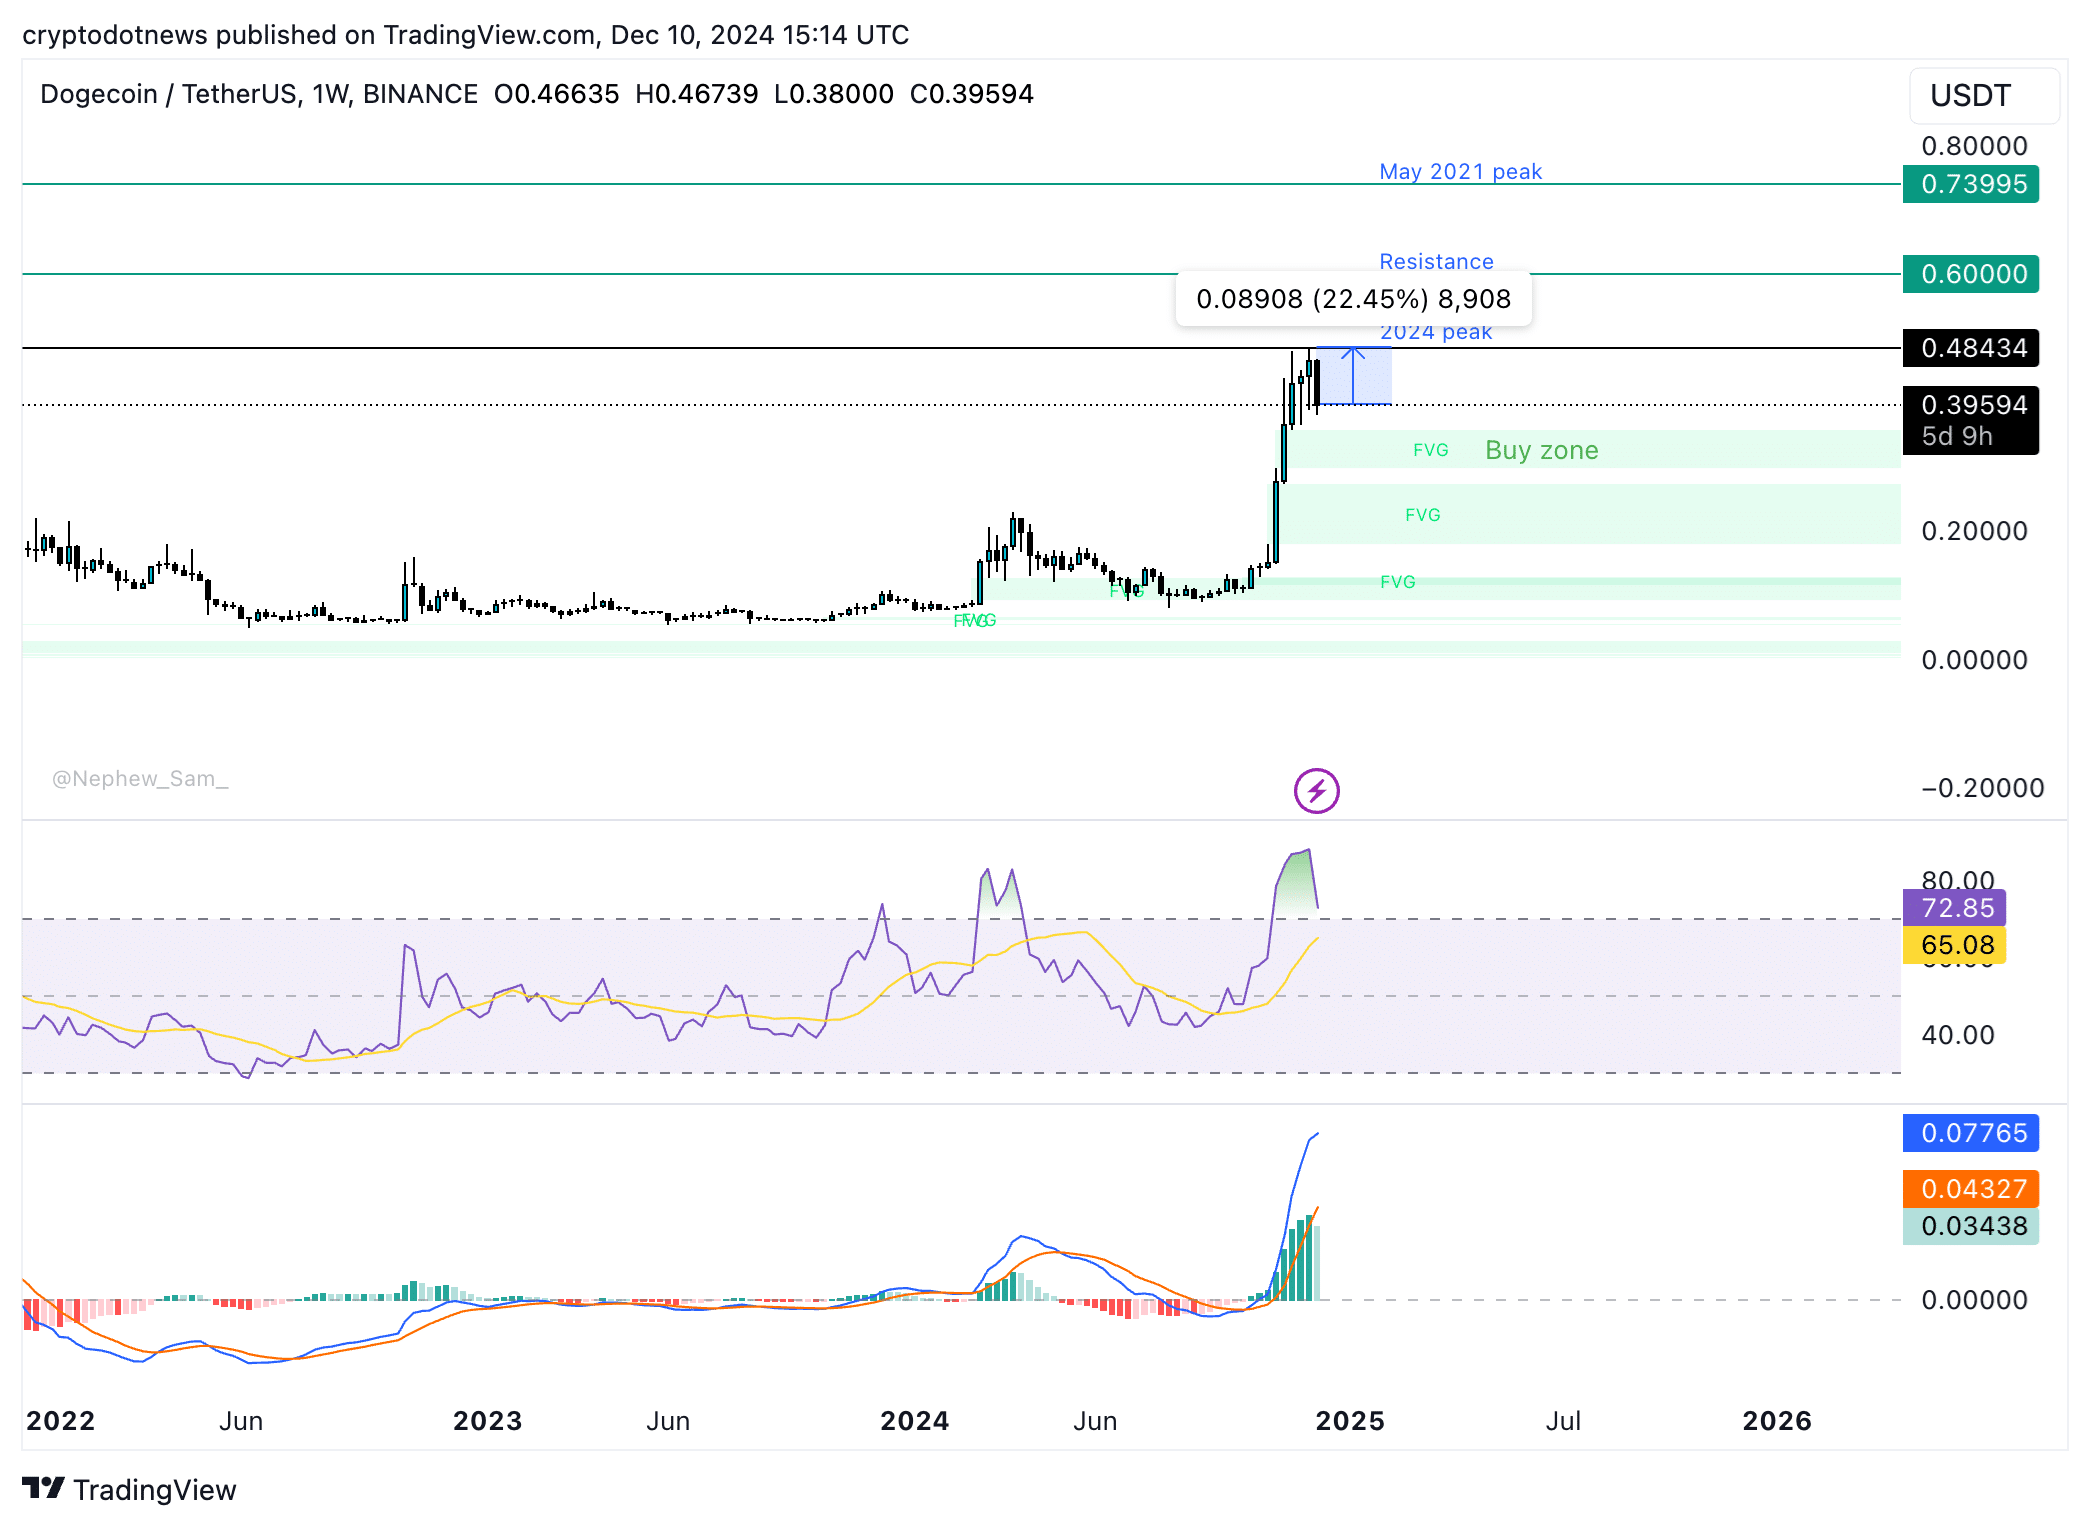
Dogecoin is currently trading 22% below its 2024 peak of $0.48434, as seen in the DOGE/USDT weekly price chart. The target for the cycle is the May 2021 peak of $0.73995, and a key resistance on the path is at $0.60000.
RSI shows DOGE is currently overvalued, and typically, this is considered a sell signal. A short-term correction could send the meme coin to the buy zone between $0.29874 and $0.35740.
MACD indicates an underlying positive momentum in the DOGE price trend.
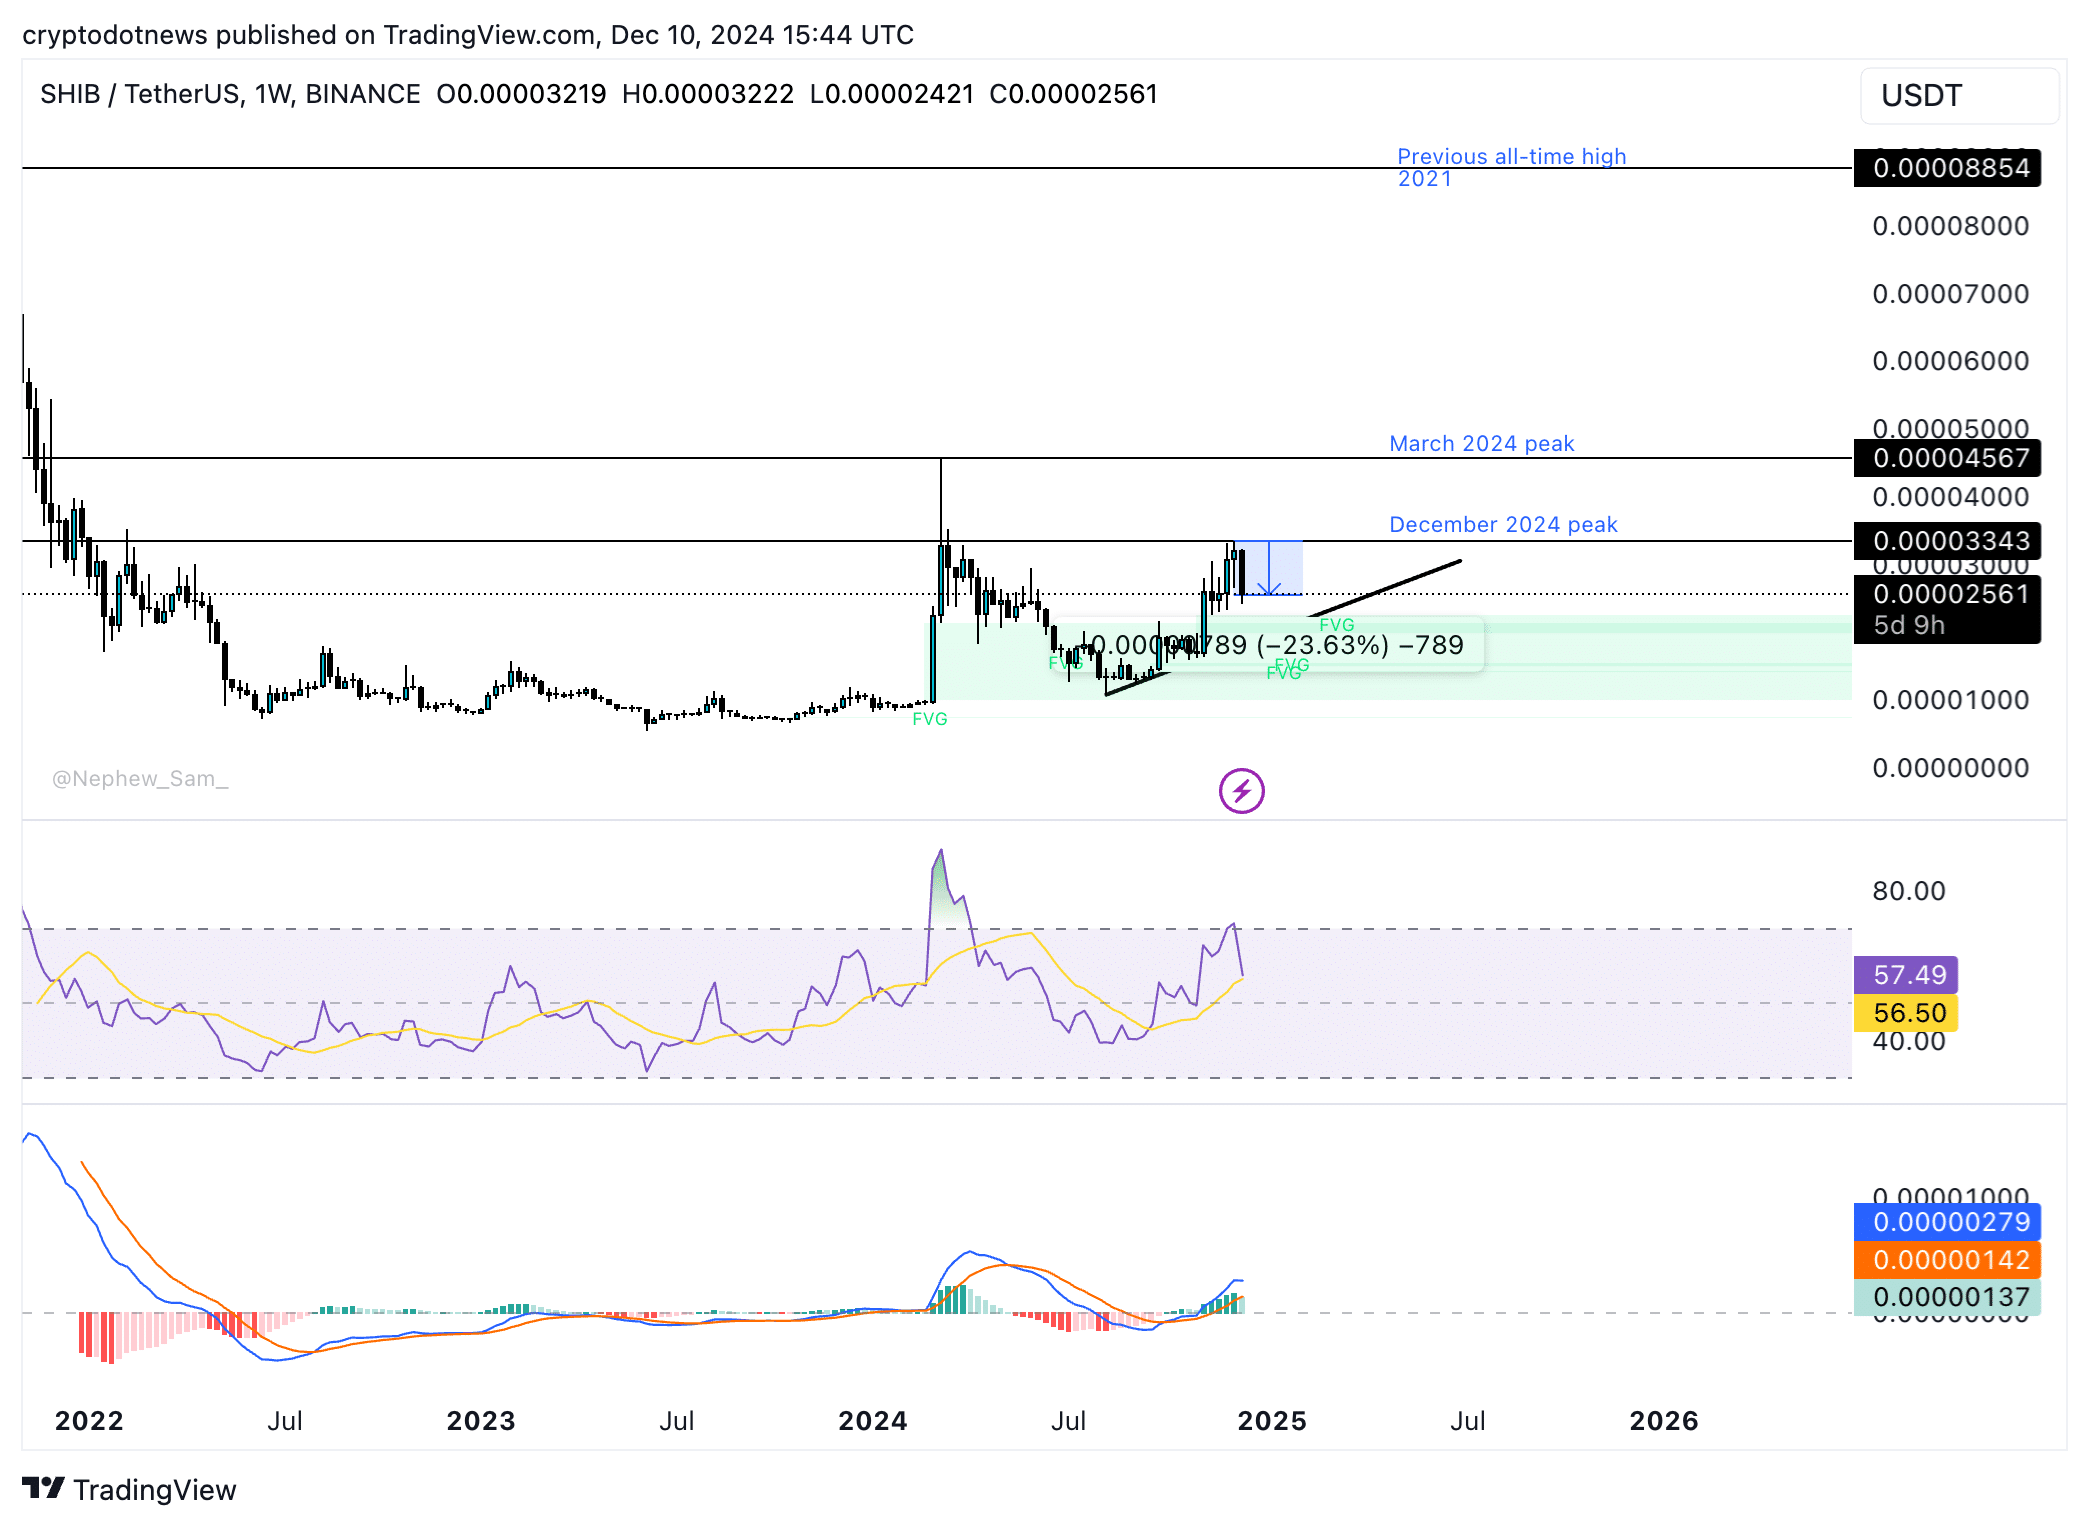
Shiba Inu declined nearly 23% from its December 2 top of $0.00003343. The momentum indicator MACD shows an underlying positive momentum in the SHIB price trend.
The target for the cycle is a March 2024 peak of $0.00004567, nearly 40% above the current price. The buy zone for Shiba Inu is between $0.00001983 and $0.00002259.
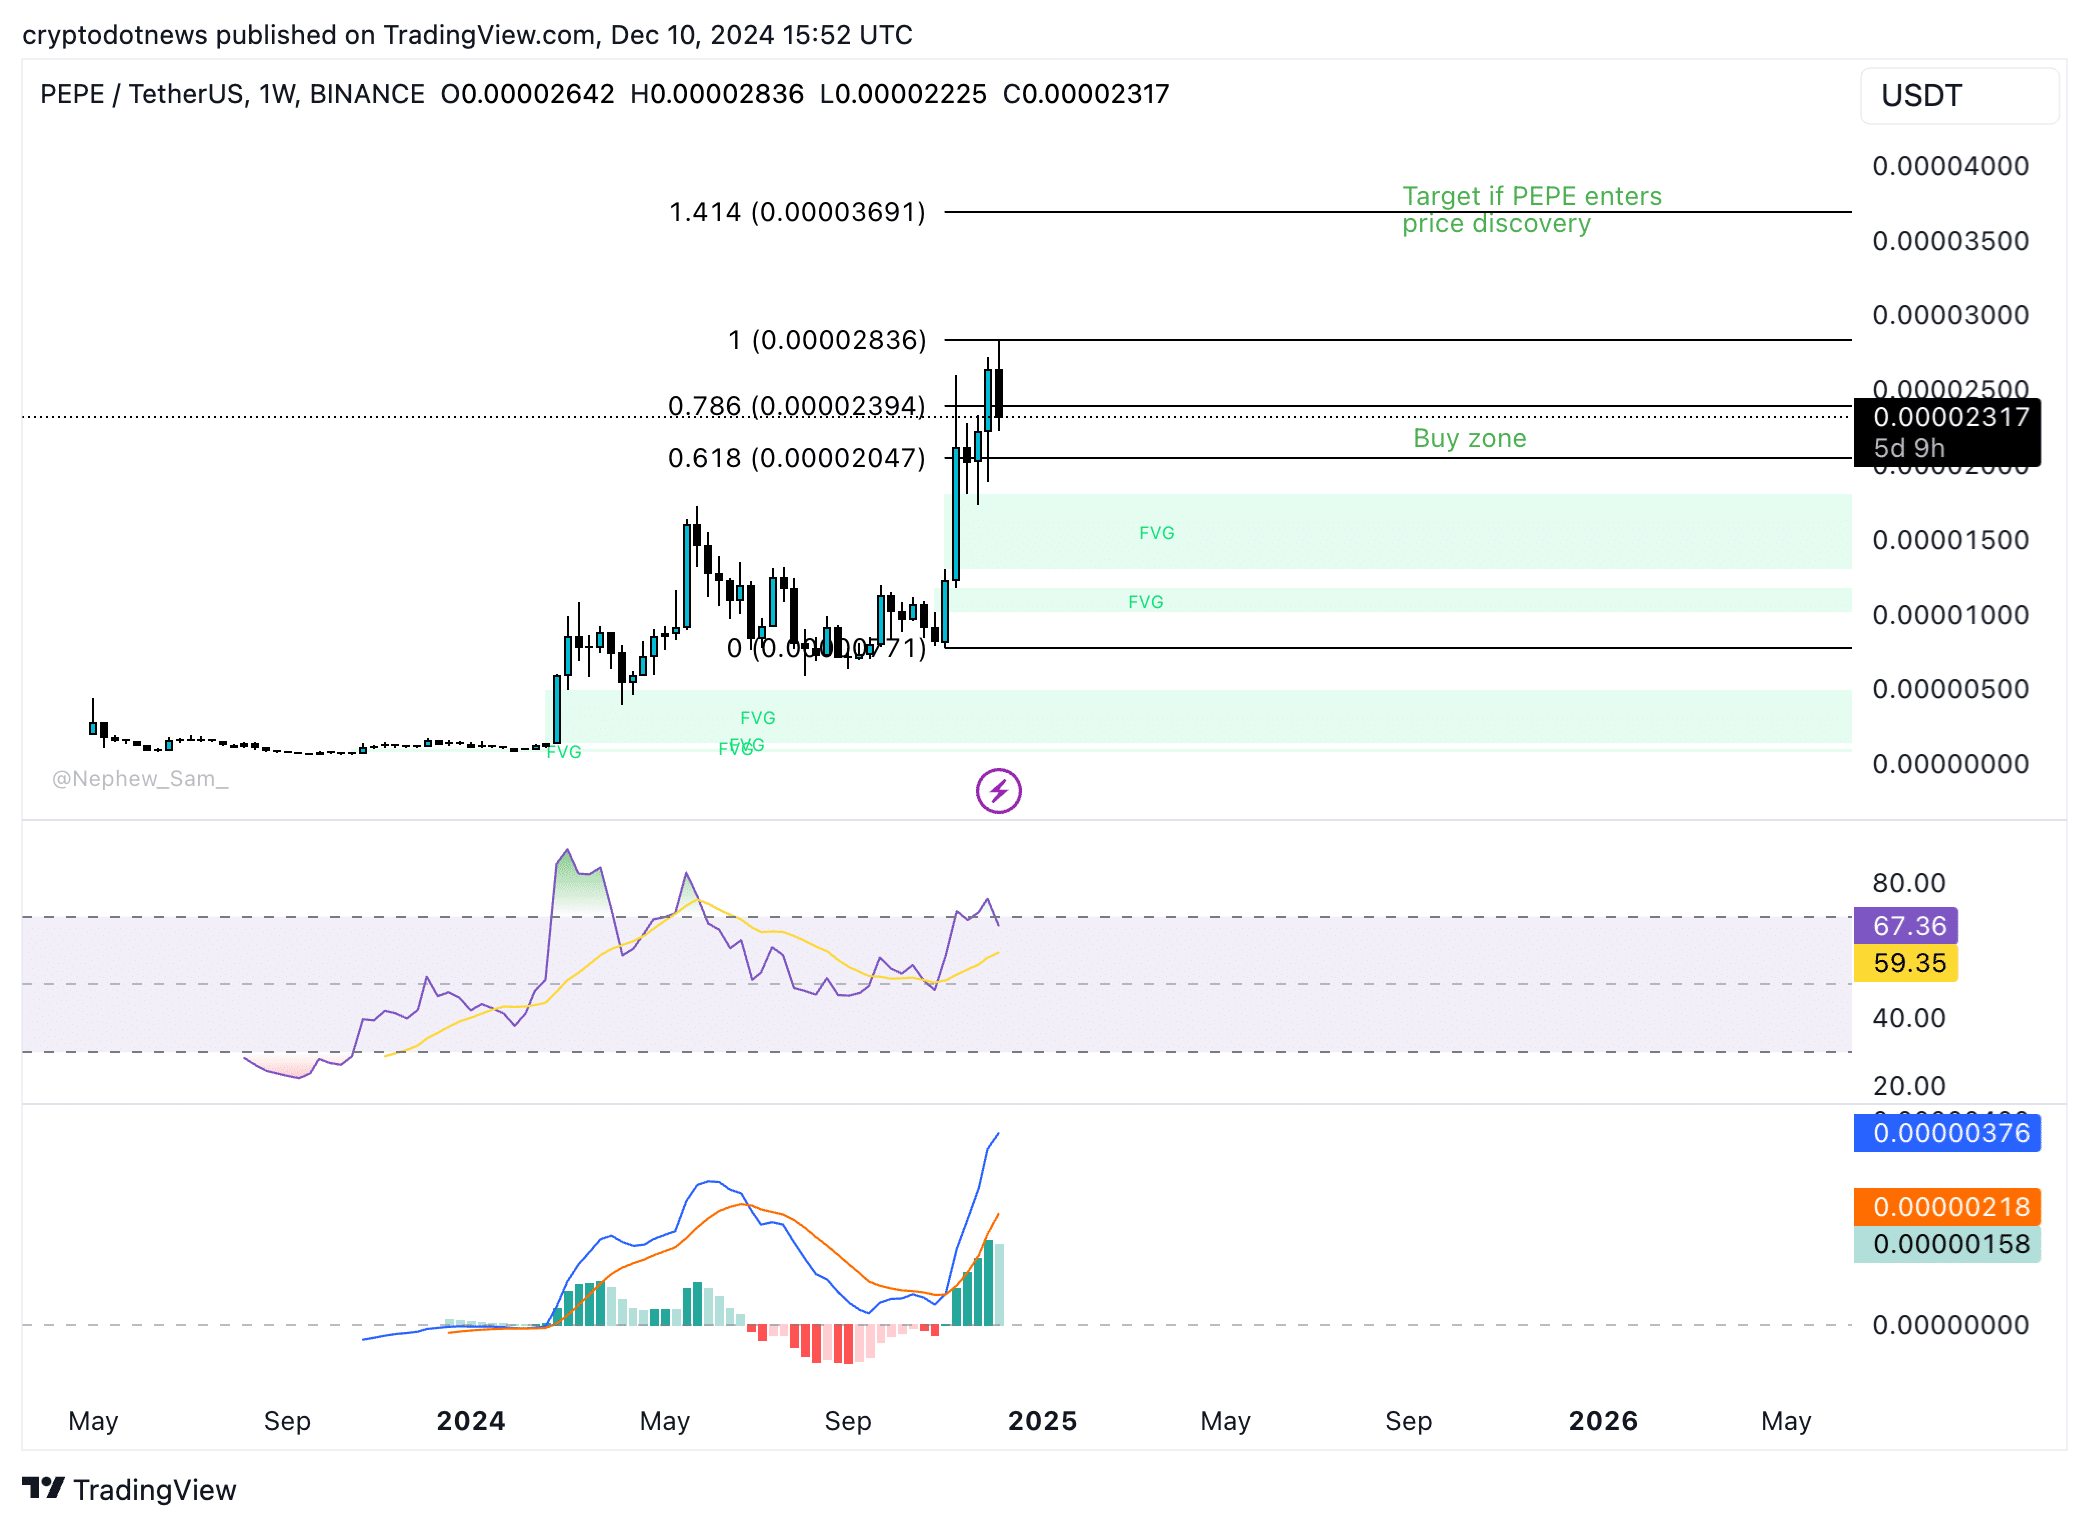
PEPE is currently within the buy zone, marked by the 61.8% and 78.6% Fibonacci retracement levels of the rally from the November 4 low of $0.00000771 and the December 9 peak of $0.00002836.
The target for the cycle is 141.4% Fibonacci retracement level at $0.00003691.
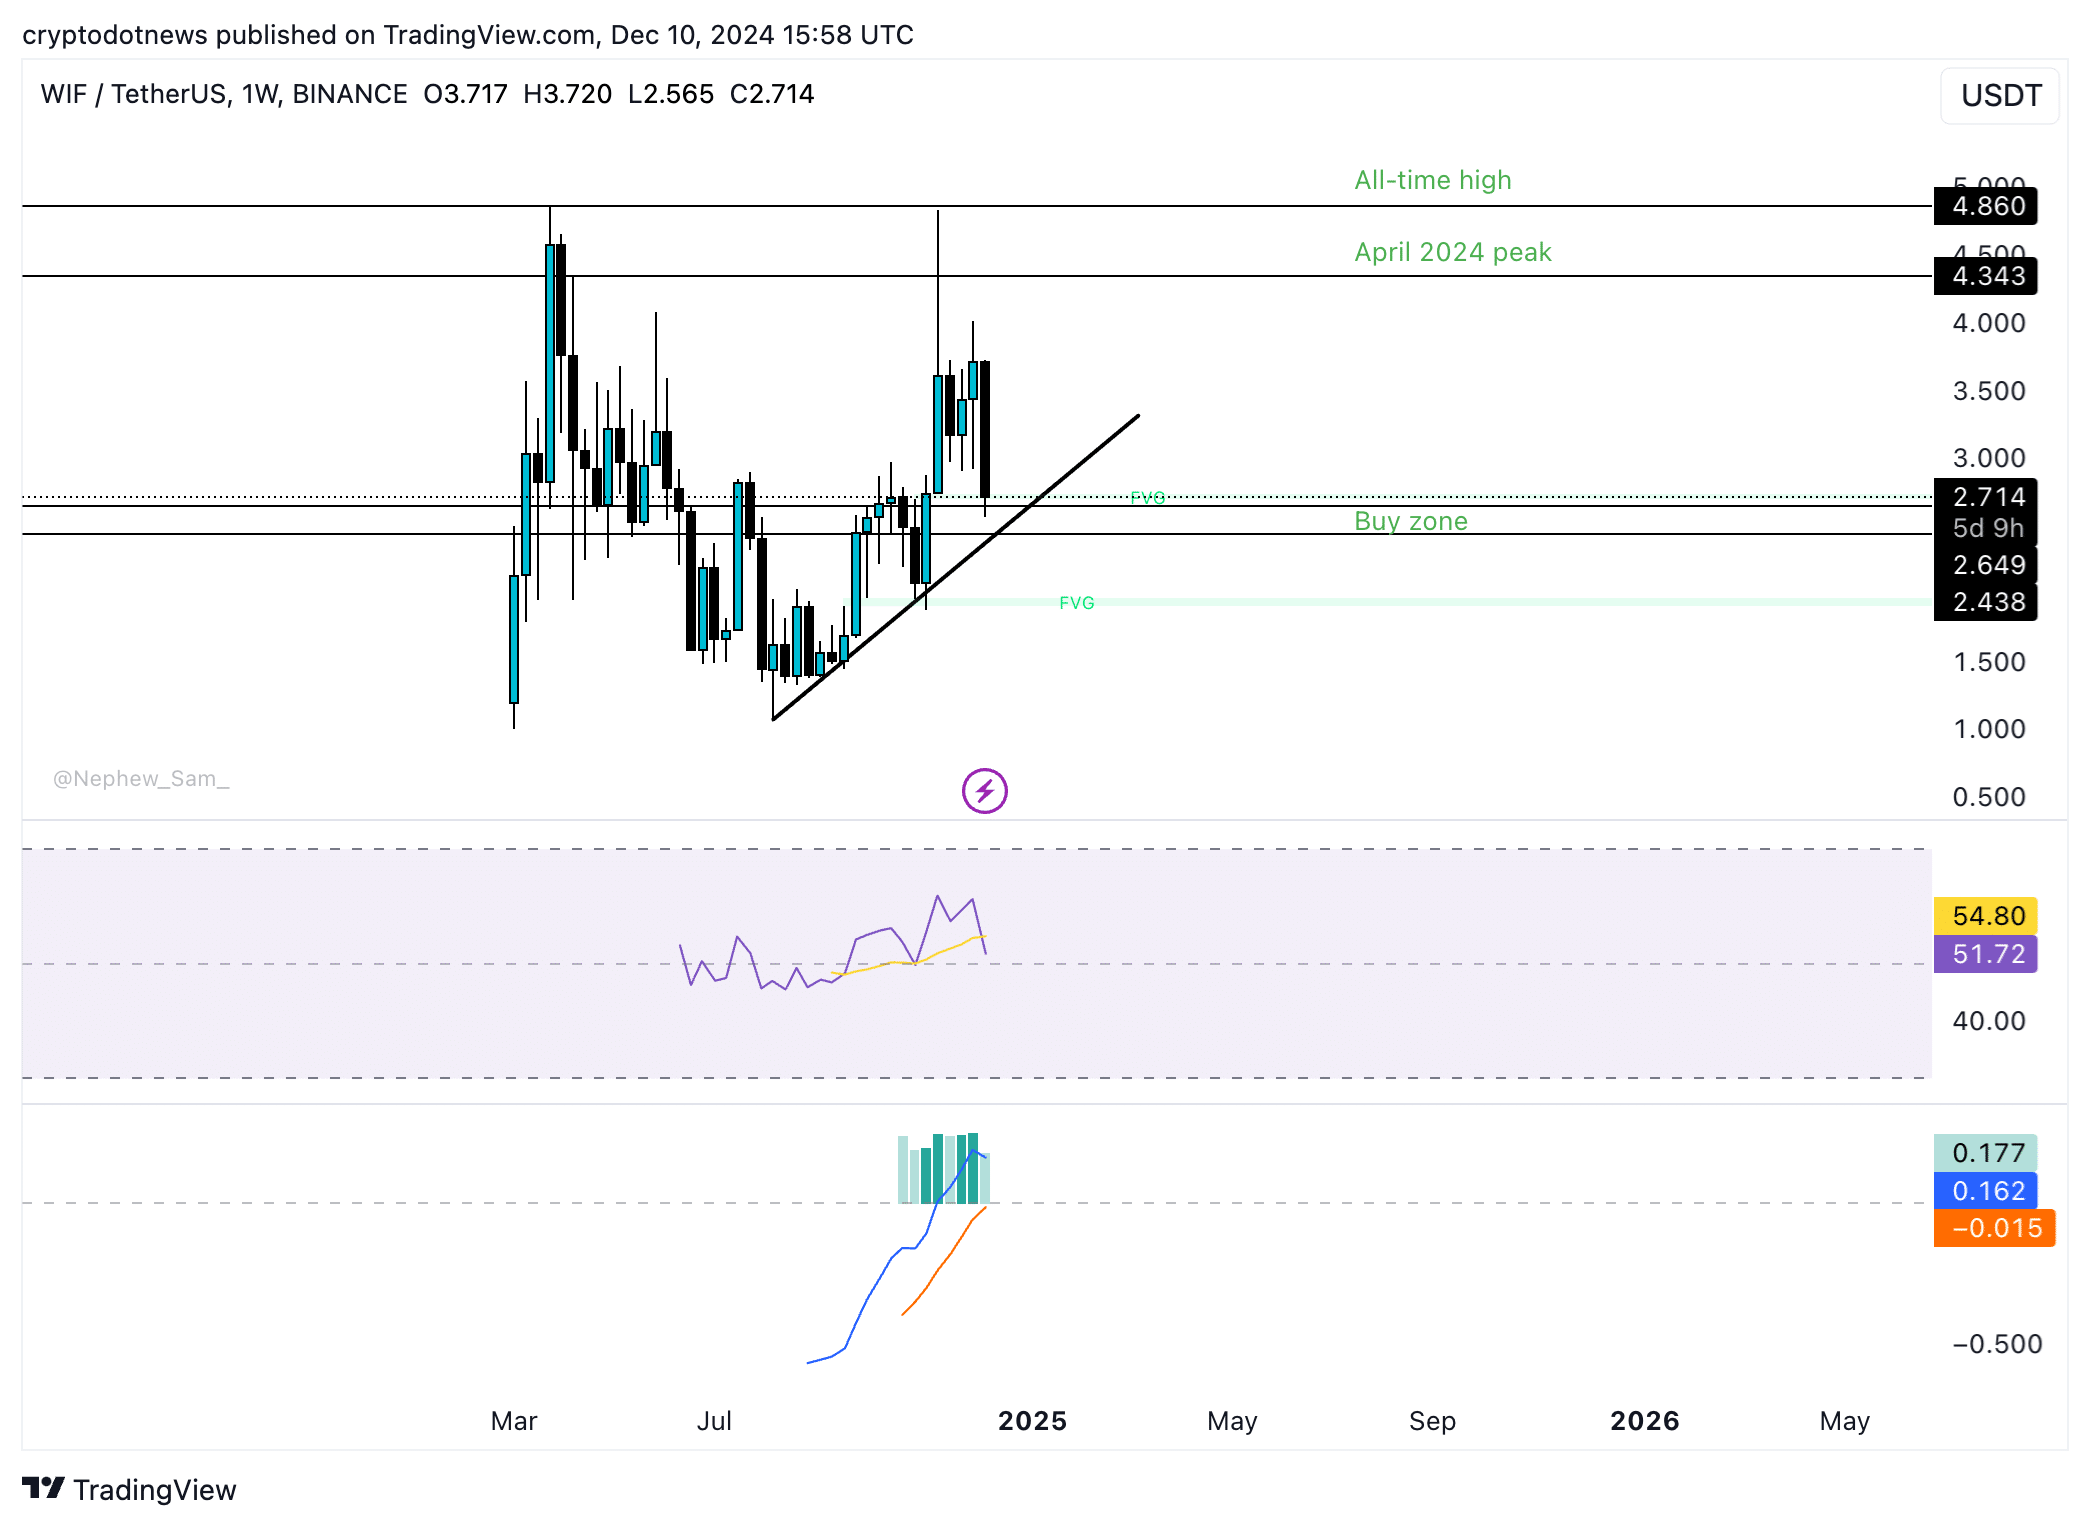
WIF’s target for the cycle is the all-time high of $4.860, the resistance is the April 2024 peak of $4.343. The buy zone for sidelined trades is between key support levels at $2.438 and $2.649.
MACD supports a thesis of further gains in WIF price this cycle, traders need to keep their eyes peeled for trend reversal as RSI is sloping downward.
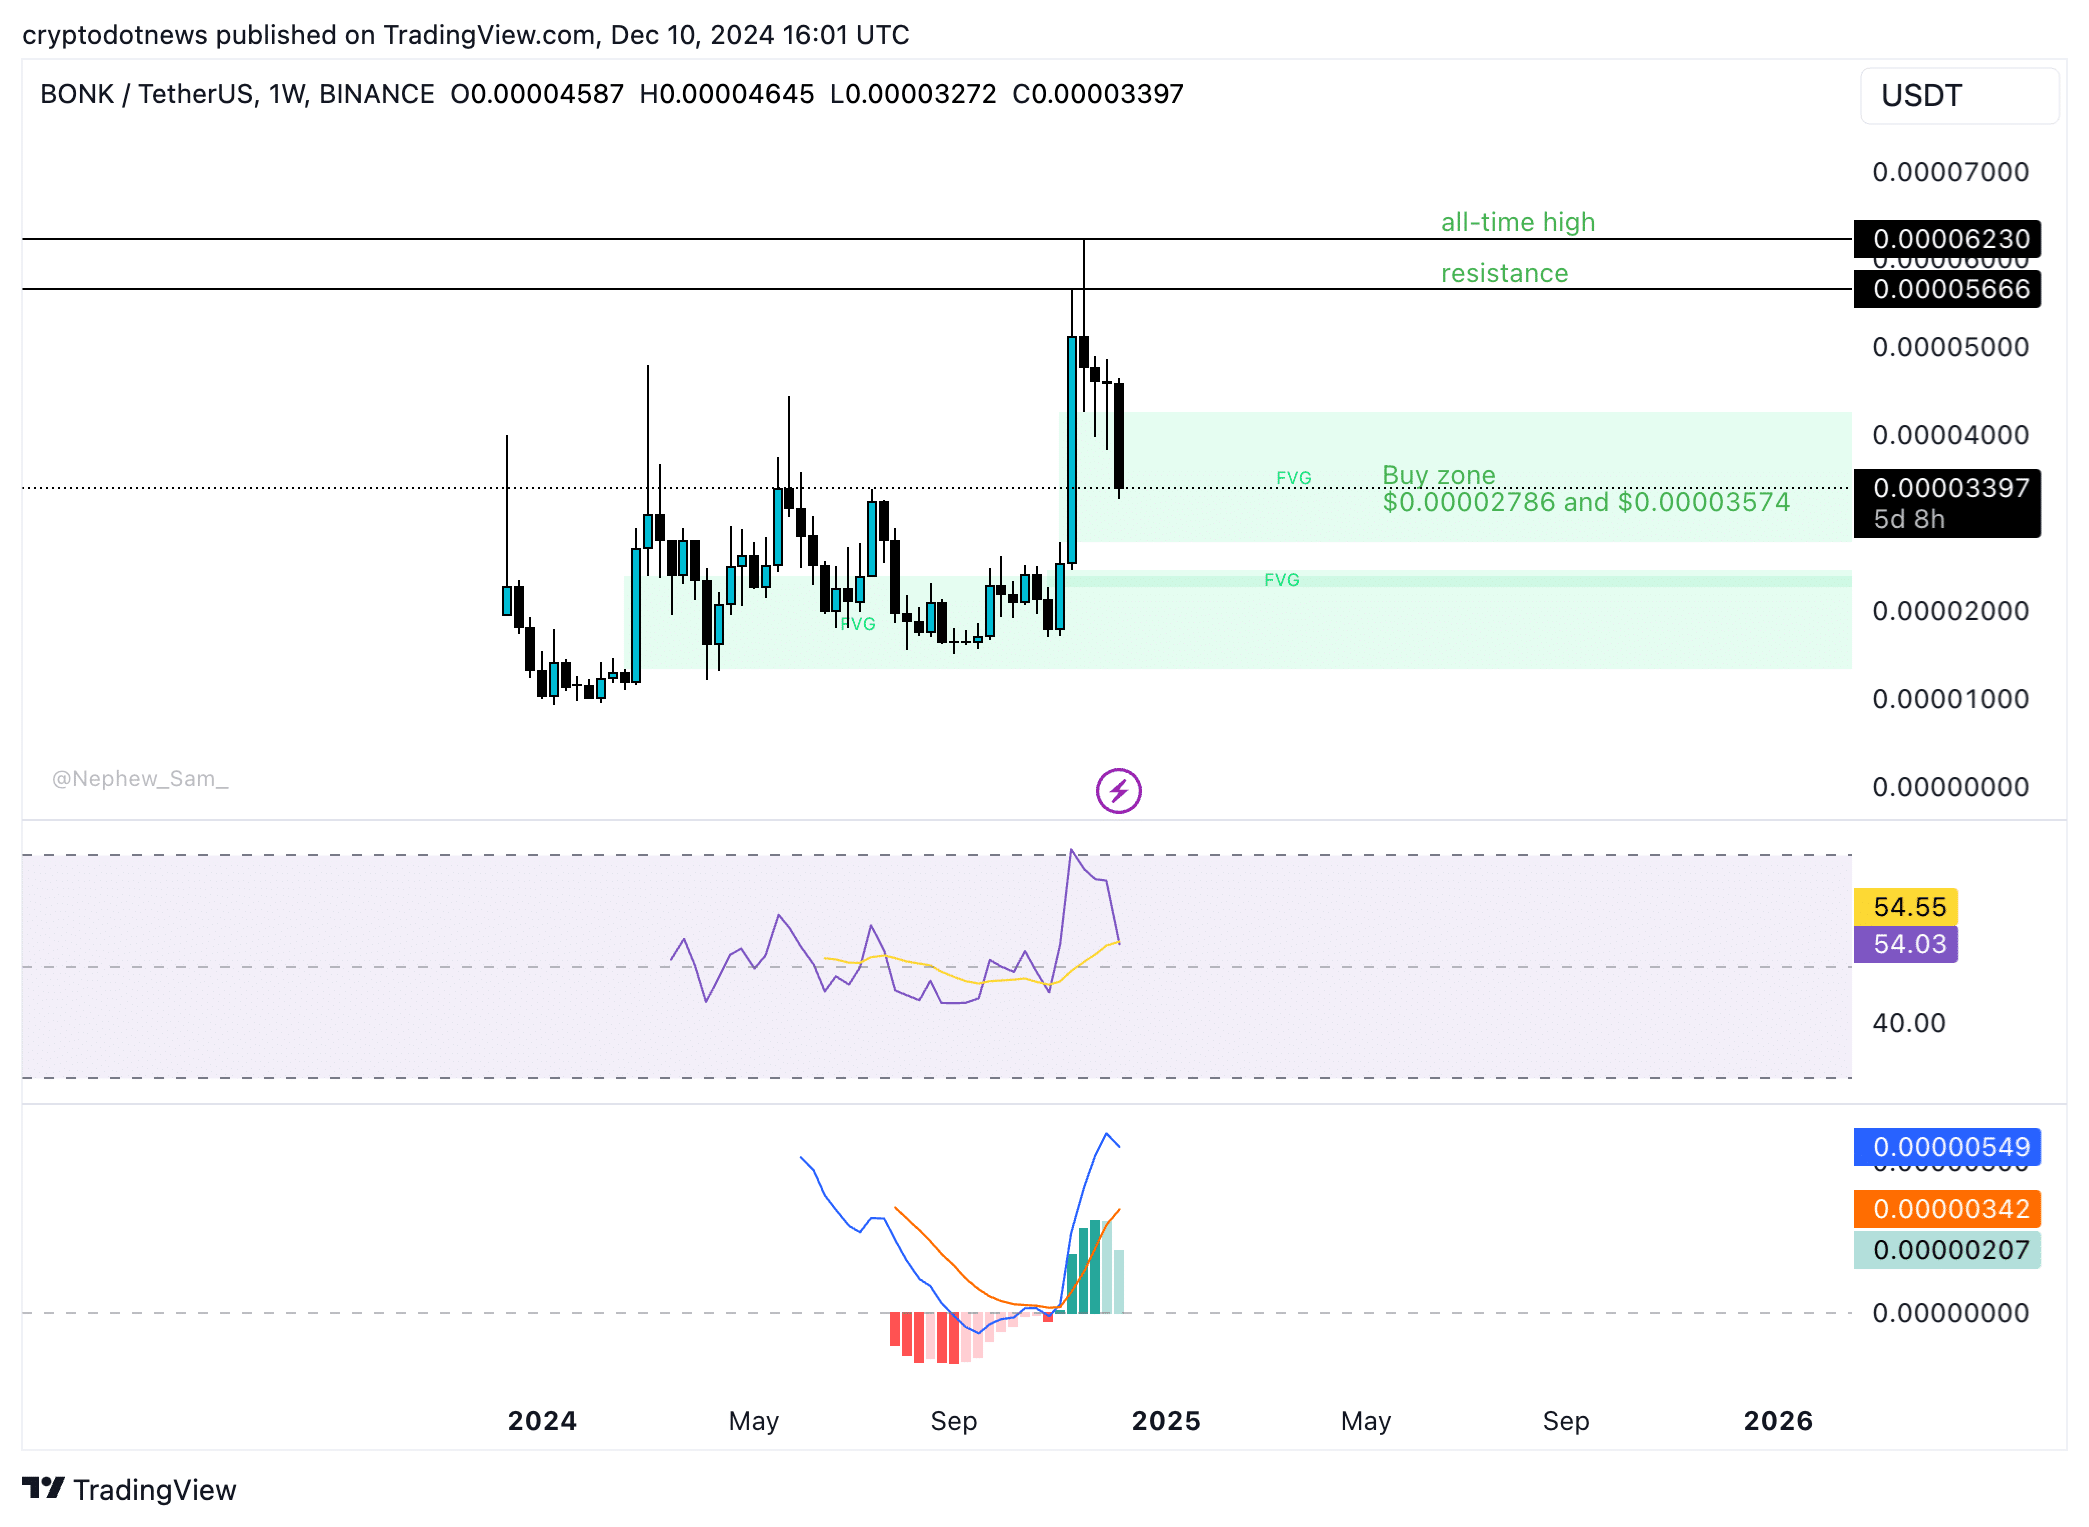
BONK is currently within its buy zone between $0.00002786 and $0.00003574. BONK’s target is at an all-time high of $0.00006230, and resistance is at $0.00005666. MACD supports a bullish thesis for BONK price.
RSI is sloping downward and reads 54, close to the neutral level. BONK could observe a short-term correction prior to its recovery and rally towards its cycle top.
Strategic consideration
Bitcoin’s steep price decline pushed the meme coin category nearly 15% lower in market capitalization. Meme tokens typically react negatively to corrections in Bitcoin price. Traders need to watch the BTC price trend closely for drops in meme coin prices this cycle.
Altcoin season has ended, and meme coins no longer lead gains among different crypto token categories. Traders need to pick meme coins with strong community, liquidity and relatively high market capitalization to protect against rug pull incidents and unprecedented losses.
Disclosure: This content is provided by a third party. crypto.news does not endorse any product mentioned on this page. Users must do their own research before taking any actions related to the company.
Source link
You may like


This Week in Crypto Games: Ubisoft’s ‘Might & Magic’, ‘Peaky Blinders’ in Development


Why Arbitrum-Nvidia Partnership Collapsed – And What It Means for Web3


Tariff Carnage Starting to Fulfill BTC’s ‘Store of Value’ Promise


The cost of innovation — Regulations are Web3’s greatest asset


Best Crypto to Buy as Derivatives Exchange CME Set to Launch XRP Futures


Metaplanet Buys Additional ¥1.92 Billion Worth Of Bitcoin
Altcoin
TAO price action shifts hints at 200% rally potential, but one key confirmation remains
Published
2 days agoon
April 25, 2025By
admin
TAO has recently shown signs of breaking free from its extended bearish market structure with a decisive impulse move. While this shift is promising, if a higher low is established at a key confluence zone, TAO could be setting up for a potential 200% rally toward the previous range high.
Over the past several weeks, Bittensor (TAO) has been locked in a steady downtrend, consistently printing lower highs and lower lows. That pattern may now be changing. The recent impulsive move broke above a significant lower high, marking the first real break in TAO’s bearish structure. Now, price is hovering around a high-probability zone for continuation—provided buyers can confirm a valid higher low.
Key technical points
- TAO Breaks Bearish Market Structure: TAO has broken the most recent lower high, signaling a potential shift in trend for the first time since the range high.
- Testing the 0.618 Fibonacci and VWAP: Price is now testing the golden Fibonacci level, which aligns with the VWAP drawn from the top of the current downtrend, forming a crucial area of technical confluence.
- Point of Control (POC) as a Pivot Zone: If TAO confirms a higher low at this zone, where POC, VWAP, and 0.618 Fib all intersect, it increases the probability of a strong bullish impulse.
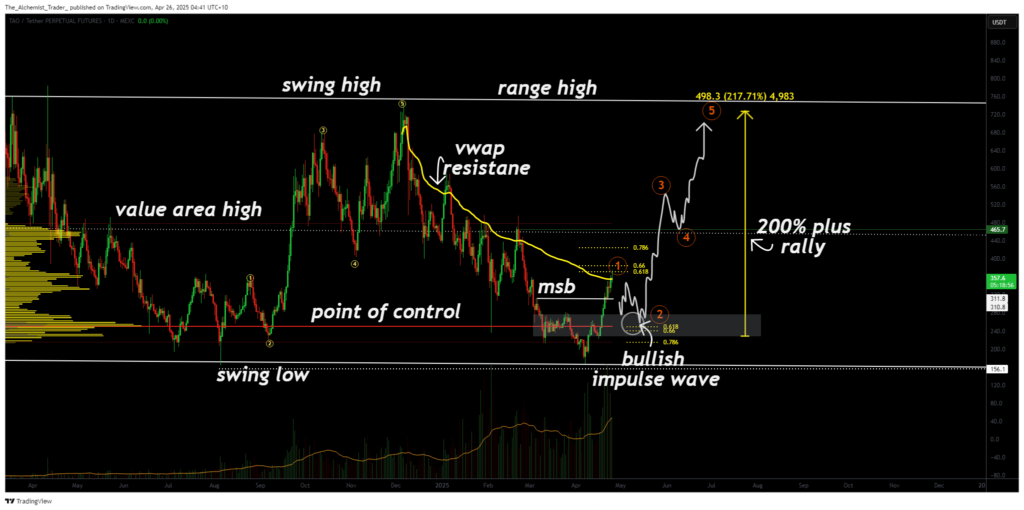
From a technical perspective, this current zone of interaction is highly significant for TAO. The confluence of key indicators, specifically the point of control, 0.618 Fibonacci level, and anchored VWAP, creates a strong area of interest. If buyers defend this level and TAO forms a higher low, the setup for a Wave 3 bullish impulse becomes far more likely. This would target the previous range high, equating to a projected 200% rally from the current zone.
Zooming out to the macro structure, TAO remains inside a large sideways range. The recent bounce from the range low shows clear signs of buyer activity, indicating demand at lower levels.
Should TAO begin consolidating above this confluence zone, form a bullish market structure, and show strong volume profile support, the odds of a full range rotation increase sharply.
What to expect in the coming price action
TAO is at a critical inflection point. If the higher low confirms at this confluence zone, the bullish case strengthens dramatically. A successful retest could spark a powerful continuation move, offering one of the clearest 200% setups in the current market structure.
Source link
Altcoin
Cointelegraph Bitcoin & Ethereum Blockchain News
Published
6 days agoon
April 21, 2025By
admin
Crypto, stocks and bonds: Are they the same?
When you dive into investing, you’ll find three frequently utilized investment options: Crypto is the risky thrill-seeker’s choice, stocks offer a middle ground with growth potential, and bonds are for those who prefer a steadier, more predictable path.
While both stocks and crypto offer growth potential, regulation makes stock market investments more structured and predictable, and crypto aims for decentralization and remains less regulated.
Crypto
Cryptocurrency is a digital currency built on blockchain technology, a decentralized, transparent and secure system that records all transactions. No entity, such as a bank, directly controls it. Crypto is known for massive swings — big gains (and losses) can happen fast, making it exciting for those who want to play the high-risk game.
Although cryptocurrency has been available for a while, its adoption has surged in recent years, gaining traction among retail investors, institutions and even some governments. Cryptocurrency is not universally regulated and can be accessed through various channels, including crypto exchanges, brokers, ATMs and fintech apps.
Stocks
Stocks represent ownership in a company — when you buy a stock, you’re purchasing a share of that business. If the company performs well and earns profits, shareholders may benefit through dividends and capital gains. On the flip side, poor performance or negative market sentiment can lead to losses.
Stocks are typically regulated by government agencies, such as the US Securities and Exchange Commission, making them generally less risky than cryptocurrencies. However, they are still influenced by factors such as company performance, market conditions, economic trends and global events — making them potentially volatile.
You can purchase stocks through traditional stock exchanges (like the NYSE or Nasdaq) or online brokerage platforms.
Bonds
Bonds are essentially loans that investors give to governments or companies. In exchange, the issuer pays regular interest over a set period and returns the full loan amount — known as the principal — when the bond reaches its maturity date, which can range from a few months to 30 years.
Bonds are often considered less volatile than stocks, making them a popular choice for conservative investors. However, they are not without risks. Rising interest rates can lower a bond’s market value, inflation can erode purchasing power, and corporate bonds carry the risk of default if the issuer experiences financial trouble.
The trade-off for this relative stability is usually lower returns, which may not appeal to those seeking high-growth investments. Bonds are regulated financial instruments and can typically be purchased through brokers or directly from government agencies.

Is crypto more profitable compared to stocks and bonds?
While crypto can offer diversification benefits, its relationship with traditional assets is complex and evolving.
For instance, in 2024, Bitcoin (BTC), the most popular cryptocurrency, demonstrated remarkable profitability, achieving a 121% return and outperforming traditional assets like the Nasdaq 100, which gained 25.6%, and the S&P 500, which rose by 25%. Gold also saw a significant increase of 26.7%, while US large-cap stocks experienced a 24.9% gain.
Bonds, on the other hand, offered a more modest return: The 10-year US Treasury bond, known for its fixed interest payments, ended the year with a yield of approximately 4.57%.
Historically, Bitcoin has exhibited a low correlation with the S&P 500, averaging 0.17 over the past decade. However, this correlation has fluctuated, reaching as high as 0.75 before declining toward zero in early 2025, indicating periods of both alignment and independence from traditional markets.

Tariff fallout: Which is more profitable now — Crypto, stocks or bonds?
The tariffs introduced by US President Donald Trump on April 2, 2025, have had an unprecedented impact on both traditional and crypto markets. But the effects have followed the above pattern consistently — stocks experienced a sharp price reduction.
According to the Guardian, the Nasdaq Composite entered a bear market by the close of trading on April 3, falling more than 20% below its most recent peak on Dec. 16, 2024. In the meantime, European indexes such as the FTSE 100 fell over 11%, and the S&P 500 dropped at least 12% since the introduction of tariffs.
Crypto had an even stronger downturn, which was once seen as a hedge against market volatility but has not been immune. Bitcoin’s price dropped by over 6% and Ether’s (ETH) by more than 12% within 24 hours of the tariff announcement, as global markets reacted with fear. The unpredictability of tariff policies contributes to market jitters, affecting all asset classes, from stocks to bonds and crypto, in unique ways.
Bonds have experienced only a small return rate increase, given that a higher return means a lower price for a bond. According to CNBC, in response to President Trump’s tariff announcements, global bond yields sharply dropped as investors sought safe havens amid stock market turmoil. For example, Germany’s 10-year bond yield fell from 2.72% to below 2.6%, and US Treasury yields also hit their lowest levels in months, signaling heightened demand for government debt, though economists warn this rally may not be sustainable if inflation concerns persist.
Trading and investing in crypto, stocks and bonds: What sets them apart?
All asset classes — crypto vs. traditional investments — involve identifying patterns, but the timeframes, dynamics and tactics differ significantly.
Crypto and stock trading share similar patterns, like sensitivity to macroeconomic trends and
technical patterns, but their market structures contrast sharply. Stock markets operate within set hours, such as the NYSE’s hours of 9:30 am–4:30 pm ET, while crypto markets run 24/7. Bonds are typically traded during regular market hours, similar to stocks, but the exact trading hours can depend on the type of bond, such as Treasurys or corporate issues.
Crypto trading involves pairs using common tokens like Bitcoin or Ether as base currencies, while stocks are typically bought with fiat, and bonds are traded in fixed denominations, often with a minimum investment threshold. Liquidity issues can affect all three: Crypto can face challenges with small-cap tokens, stocks with micro-cap companies and bonds with less-traded long-term or corporate issues.
Timeframes for market patterns highlight further distinctions. Crypto market patterns thrive on short-term volatility, demanding rapid decisions and frequent trades, while stock patterns often track longer-term trends tied to company performance and broader economic cycles. Bonds move the slowest, with price shifts driven primarily by interest rates, and offer stable, predictable patterns.
Price drivers also set them apart. Crypto values hinge on market trends, adoption and utility; stocks rely on company fundamentals, research and earnings; and bonds depend on interest rate movements and issuer creditworthiness, prioritizing stability over growth.
Entry barrier to crypto, stocks and bonds
Stock issuance is governed by company laws, blockchain protocols with hard caps control crypto supply, and bonds are issued based on creditworthiness.
To invest in stocks and bonds, you generally need to be at least 18 years old and have a brokerage account to invest in the stock and bond markets. Some stocks may require a higher income or level of experience, while most stocks only allow accredited or wealthy investors to participate.
Buying stocks and bonds means going through regulated brokers and exchanges. Crypto, on the other hand, lets you jump in with just a wallet — no intermediary, no paperwork. Centralized crypto exchanges require Know Your Customer (KYC) verification, but decentralized platforms let you trade freely with only your private keys.
Did you know? Stocks represent company equity with dividends; crypto represents digital assets with varying uses; and bonds are loans offering fixed-interest payments.
Regulatory differences between crypto, stocks and bonds
While stocks and bonds follow strict rules, crypto is still figuring things out, making buying, selling, holding and taxes a whole different experience.
In most countries, investing in stocks and bonds is legal and regulated. Still, some governments, like North Korea and Cuba, impose strict restrictions or outright bans on private investment in these assets. Crypto faces a patchwork of regulations worldwide, ranging from full bans in countries like China and Egypt to partial restrictions in places like India, where regulations limit banking support but don’t outlaw trading. Meanwhile, crypto-friendly nations like El Salvador embrace digital assets with clear legal frameworks and government support.
Holding stocks and bonds is straightforward. The shares sit safely with a brokerage, and bonds pay you interest at fixed intervals. Holding crypto, however, comes with risks. You can self-custody in a wallet, but if you lose your private keys, your funds are gone forever. If you keep crypto on an exchange, there’s always a risk of hacks or platform failures.
Taxes add another layer of complexity. Stocks and bonds typically fall under capital gains and dividend tax rules, with clear guidelines based on how long you’ve held them. Crypto tax laws vary widely by country. Some countries treat it like property, others like a commodity, and a few don’t tax it at all. Keeping track of every transaction is crucial, as even swapping one crypto for another can be taxable.
Crypto vs. stocks vs. bonds: Which one should you buy in 2025?
Choosing between crypto, stocks and bonds in 2025 depends on your personality, risk appetite and financial goals.
If you love the adrenaline and believe in the future of decentralized finance (DeFi), then a crypto-focused portfolio might be for you. For example, a high-risk, high-reward portfolio could be 70% crypto, 20% stocks and 10% bonds.
If you prefer a more structured approach but still want growth, stocks balance risk and return. A portfolio, for instance, with 60% stocks, 30% crypto and 10% bonds could give exposure to innovation while keeping things grounded.
For those who sleep better knowing their money is safe, bonds provide stability. For example, a conservative mix could contain 70% bonds, 20% stocks and just 10% crypto, ensuring steady returns with a taste of market excitement.
This article does not contain investment advice or recommendations. Every investment and trading move involves risk, and readers should conduct their own research when making a decision.
Source link
Altcoin
Solana could end crypto market limbo rally, eyes $150
Published
1 week agoon
April 19, 2025By
admin
Crypto market uncertainty results in negative year-to-date returns for altcoins in the top 10, including Solana. Amid traders’ fearful sentiment and the economic fallout from President Donald Trump’s tariff announcements, Solana bucks the market-wide decline with a steady climb in the past 10 days.
Solana (SOL) price could receive a boost from the U.S. Federal Reserve’s decision to start reducing interest rates again soon. Traders expect three to four quarter percentage point cuts in 2025.
Solana price forecast
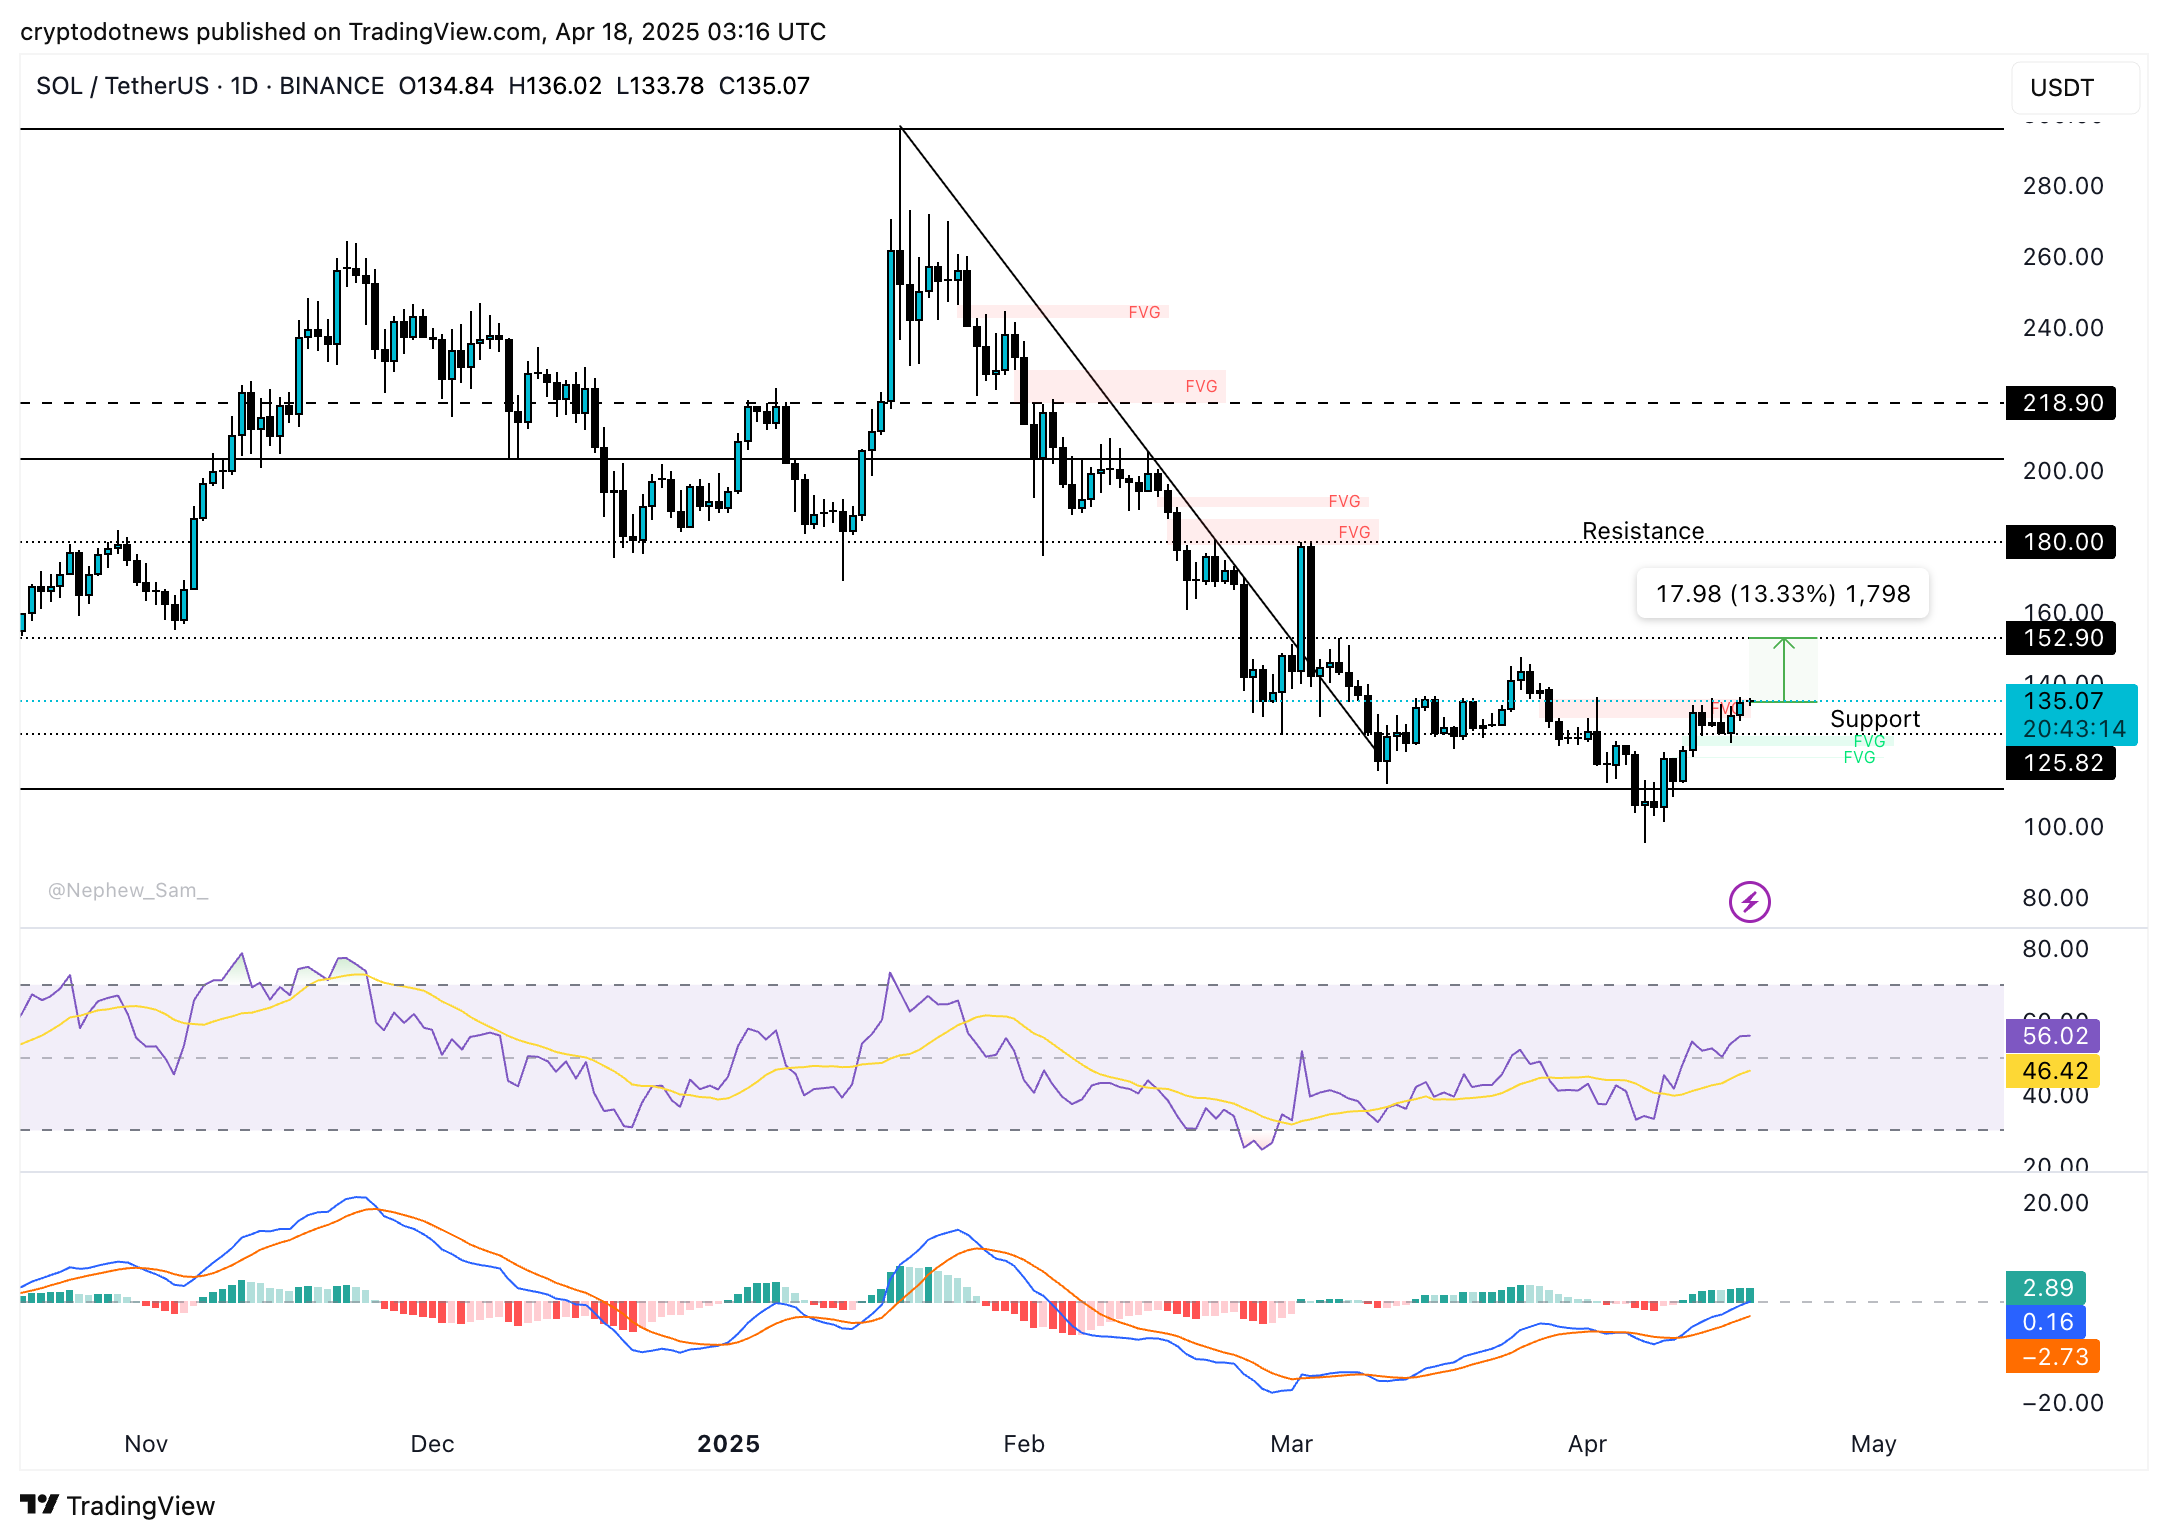
Solana ended its downward trend on March 10 and has been consolidating around $135, a key level for the Ethereum alternative token.
At the time of writing, SOL trades at $138.75.
SOL rallied nearly 20% in the past week and nearly 8% in the past month. With $125.82 being the support level for the altcoin, it coincides with the upper boundary of an imbalance zone on the SOL/USDT daily price chart.
Two key momentum indicators, RSI and MACD support a bullish thesis in Solana. The green histogram bars above the neutral line and RSI sloping upwards with a reading of 56 suggest an underlying positive momentum in SOL price uptrend.
Solana could rally 13.33% and test the $152.90 level, a key resistance and previously a key support for the altcoin. If Solana successfully flips the $152.90 level from resistance to support, a rally towards resistance at $180, a sticky resistance for the altcoin throughout March and the first two weeks of April 2025.
SOL on-chain analysis
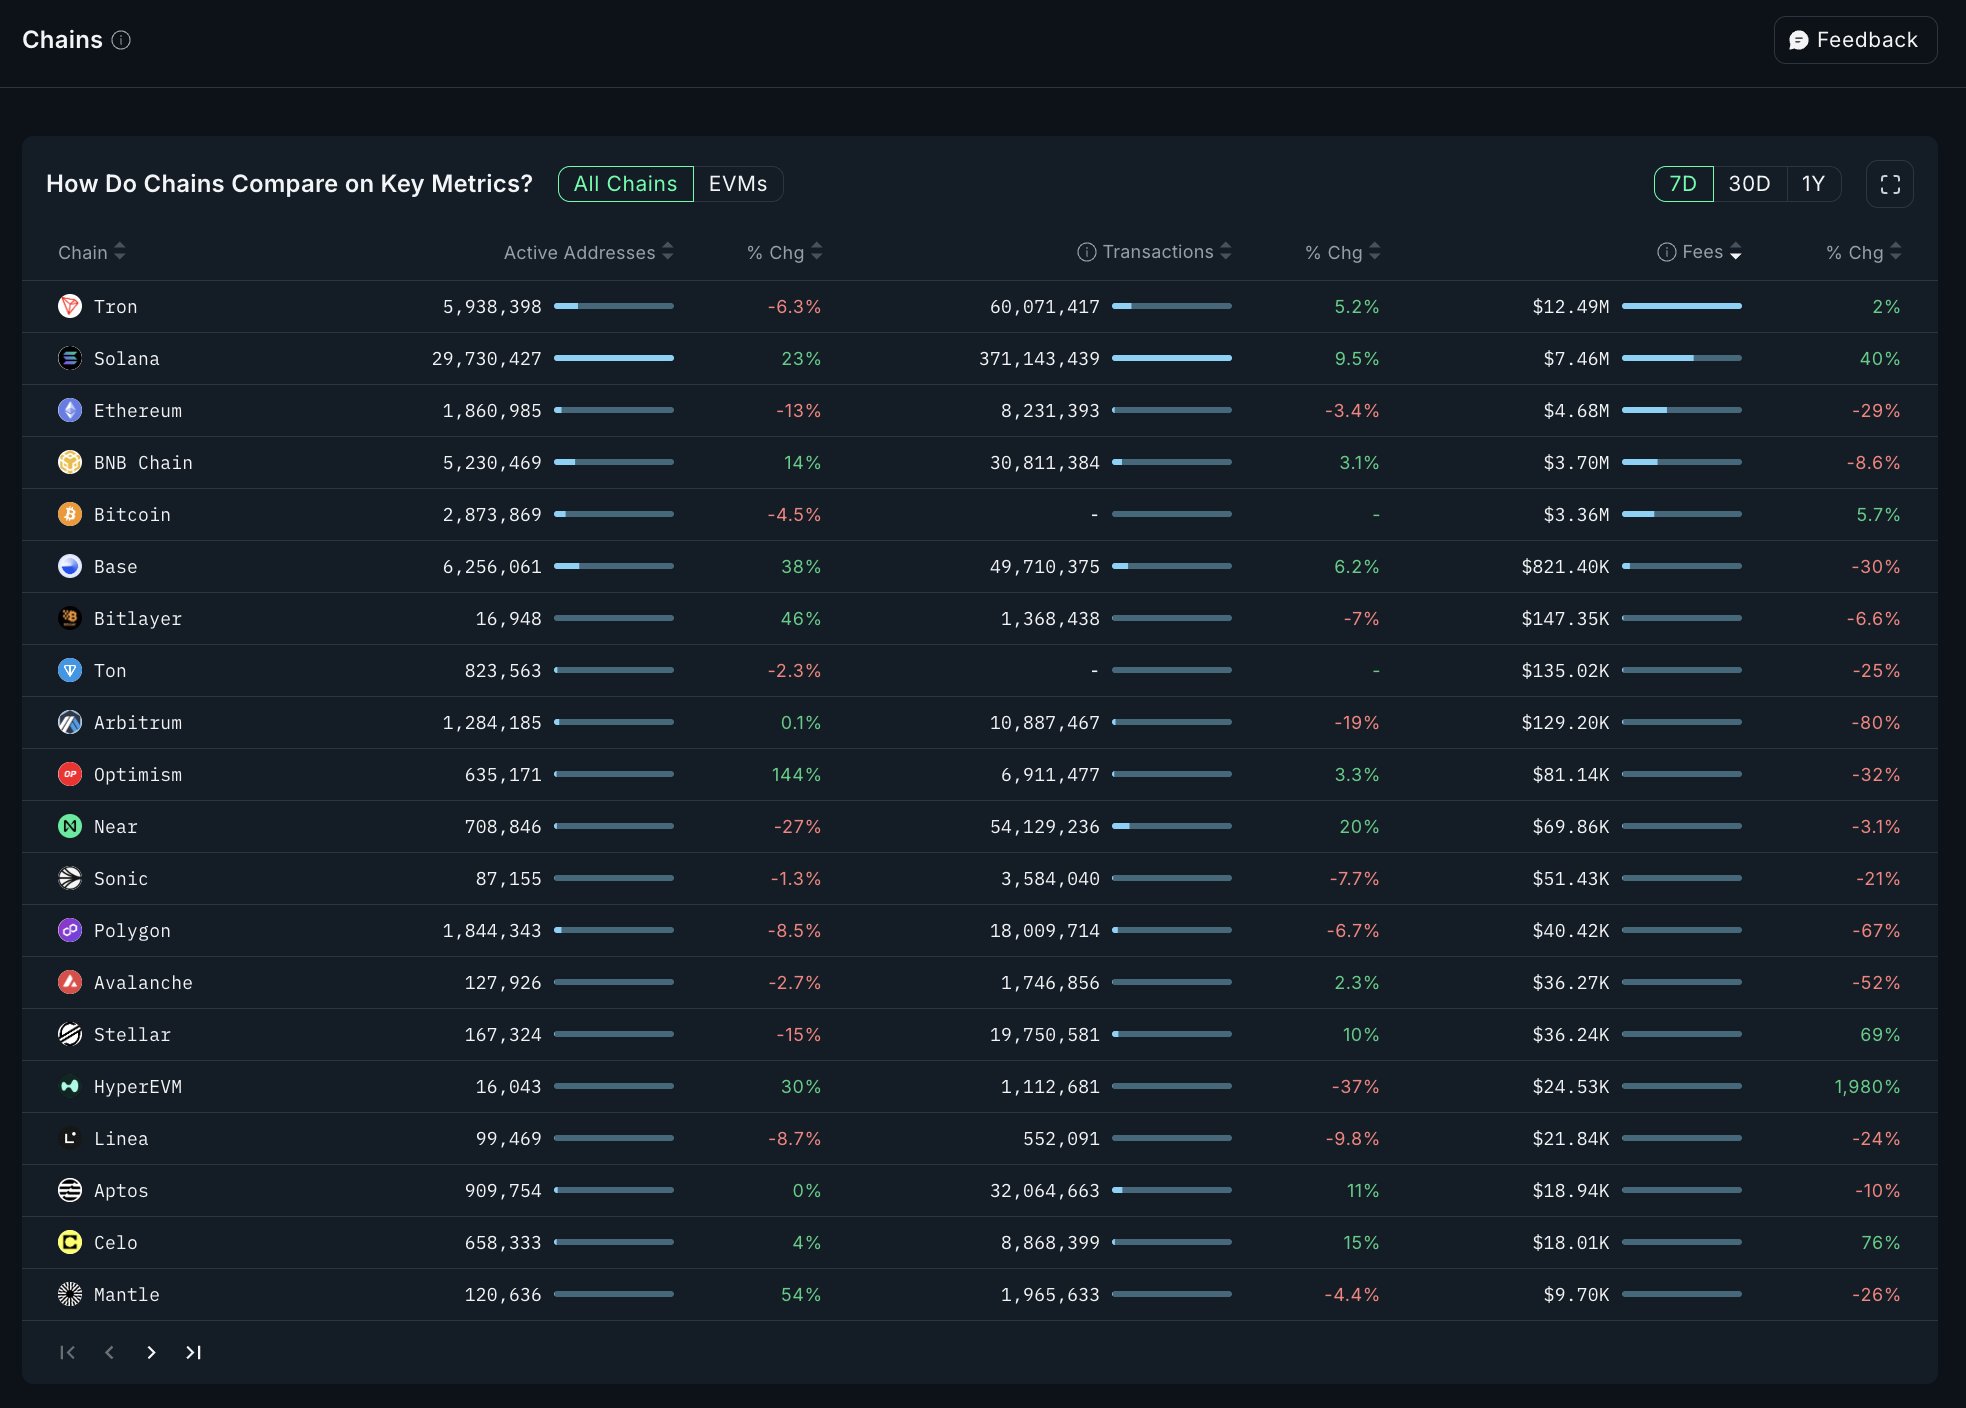
On-chain data from Nansen compares activity across Solana, Base and Ethereum. SOL leads with over 4 million active addresses in the past seven days. Base is second and Ethereum ranks lowest.
Higher count of active addresses shows the token’s relevance and demand among market participants.

Comparing DEX volume across the three chains, Solana leads with over $5.48 billion, while Ethereum ranks second at $975 million and Base follows with $465 million.

In terms of transactions, Solana leads with 52 million transactions in the past seven days, while Ethereum and Base lag behind, according to Nansen data. This is consistent with data for active addresses.

In terms of fees generated by the top 5 chains, Solana is second best with a 17% increase in active addresses, nearly 9% increase in transactions and 42% gain in fees generated in the last seven days, per Nansen data.

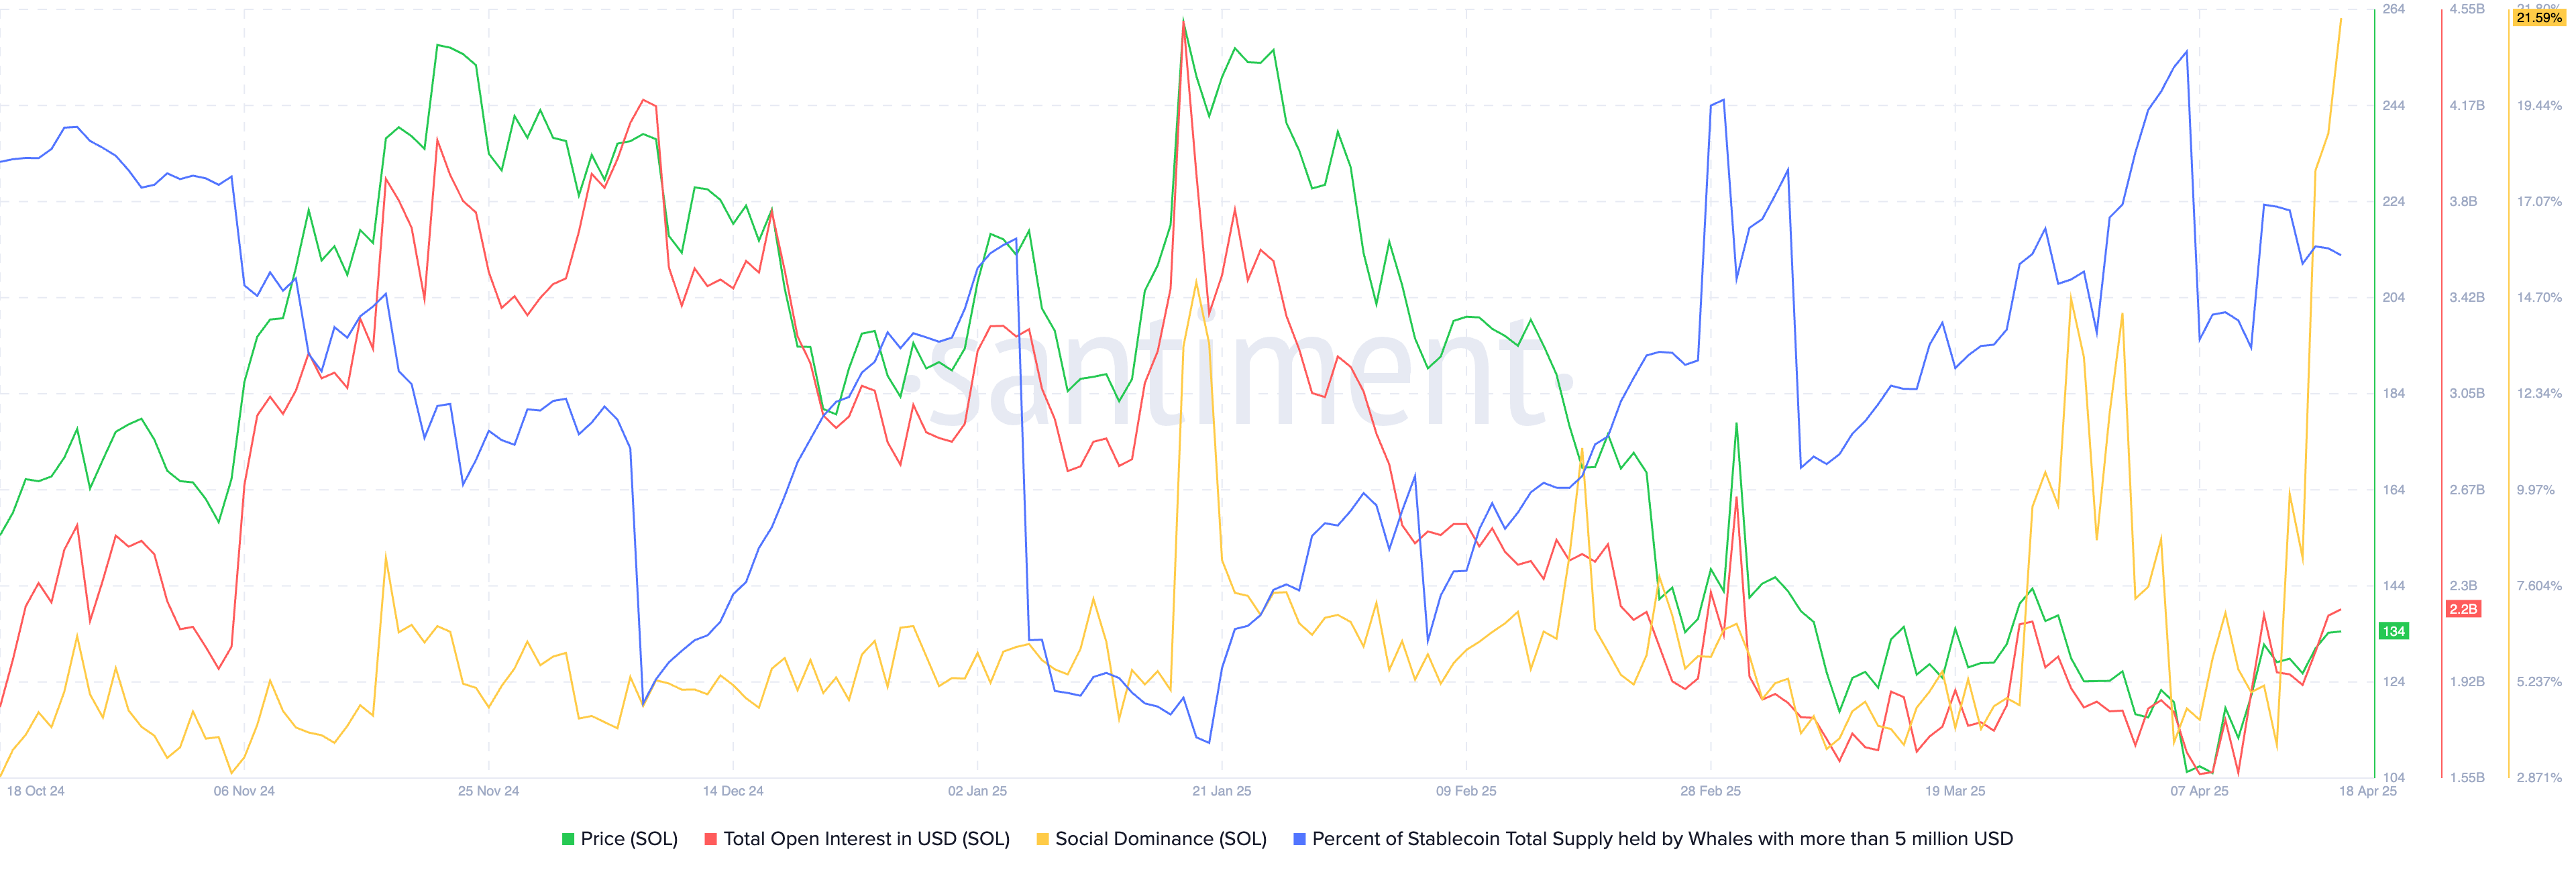
Santiment data shows a large spike in social dominance on Friday, up from 8.30% on April 15 to 21.59% on April 18. Alongside a rise in social dominance, total open interest in Solana climbed, in terms of USD.
This implies that the total value of open long and short positions in Solana has increased in the same timeframe, supporting a thesis for a rally in Solana price.
SOL weekly price performance
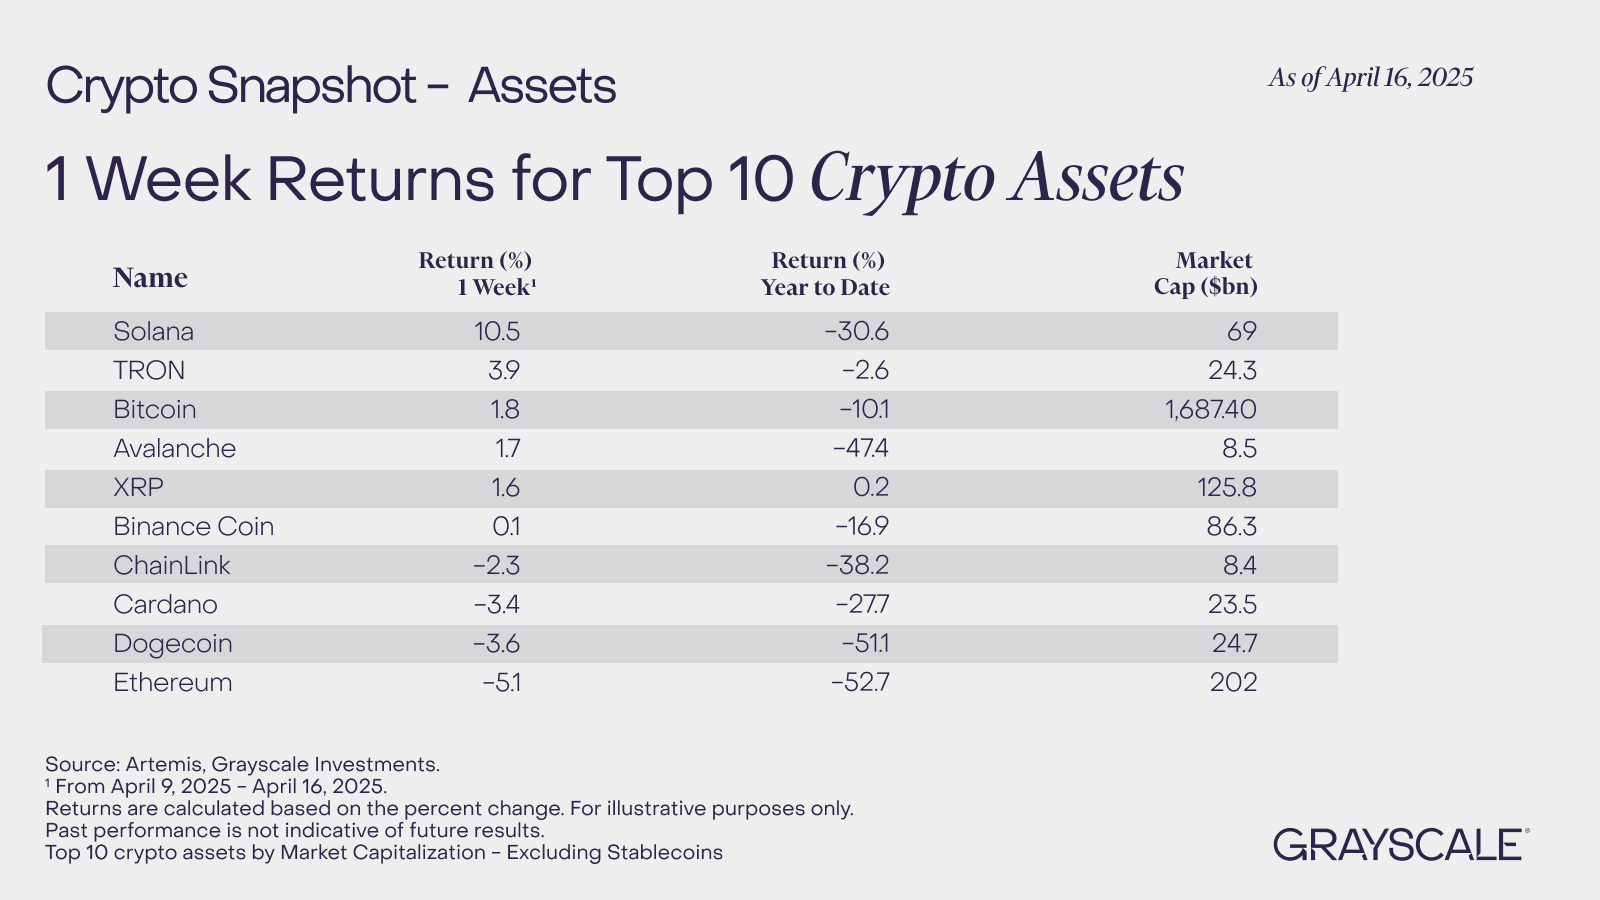
Grayscale, one of the largest alternative asset fund managers compared the returns for top 10 cryptocurrencies for a week. Data shows Solana climbed 10.5% while year-to-date returns are a negative 30.6%, at a market capitalization of $69 billion.
Solana leads the top 10 cryptocurrencies its its weekly gains, XRP leads in year-to-date returns where SOL lags. The flashcrashes in Bitcoin price and the market correction in crypto dragged down Solana price, wiping gains from 2024 and contributing to negative year-to-date returns.
Solana vs. Layer 1 and Layer 2 chains
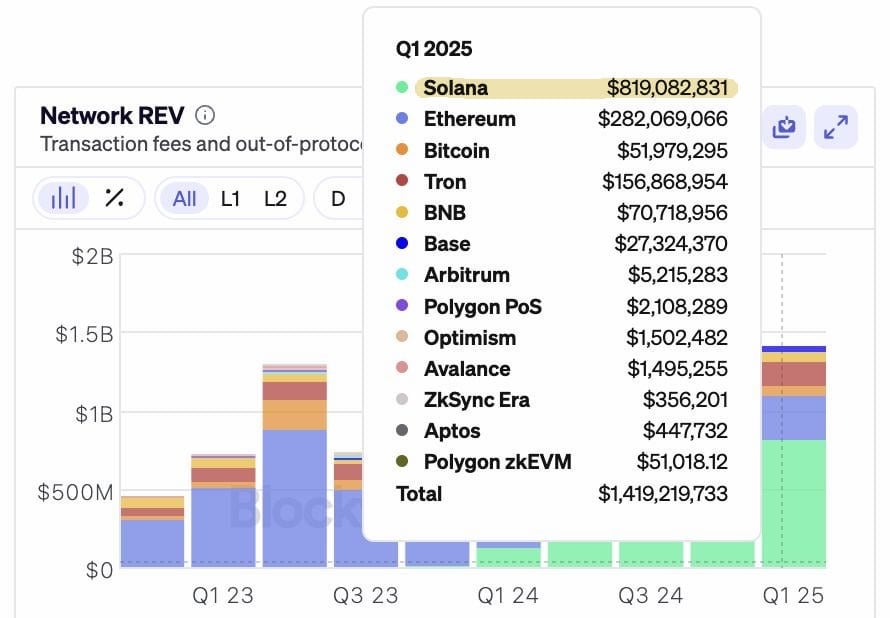
When Solana’s network revenue is compared with Layer 1 and Layer 2 chains like Ethereum (ETH), Bitcoin (BTC), TRON (TRON), it shows SOL outperformed its competitors.
SOL’s network revenue for the first quarter of 2025 is $819 million, Ethereum and TRON are the within the top three while Bitcoin lags with $51.97 million revenue in Q1.
When Solana’s revenue generated in the past seven days is compared, it shows that the Ethereum competitor continues to lead and ranks among the top 5 chains, per Nansen data.
SOL continues to dominate among competitors with the highest revenue generation. If SOL value is equated to its revenue generation, the token is likely undervalued and could yield further gains next week and in the second quarter of 2025.
Catalysts driving gains in Solana
Solana’s network developers are not alone in their efforts to scale the SOL infrastructure to make it faster, more resilient, and scalable.
Coinbase, one of the largest centralized exchanges, announced its system upgrade to process Solana transactions in a manner that boosts processing throughput, improves performance, and optimizes operational controls.
Coinbase shared the update on X and informed the community of traders of their commitment to boosting the Solana network infrastructure to increase reliability for end-users as well.
We’ve been hard at work scaling our @Solana infrastructure to be faster, more resilient, and more scalable.
We have upgraded our systems to:
→ Process transactions asynchronously, leading to a 5x improvement in block processing throughput.
→ Leverage bare metal machines for 4x… pic.twitter.com/WFINzCutNK— Coinbase Platform (@CoinbasePltfrm) April 17, 2025
The exchange unveiled plans to continue investing in the Solana network and its development in the future.
Solana ETF filings and their progress in H1 2025 are another key market mover. An approval from the U.S. SEC could catalyze a rally in Solana in the second quarter of the year.
Disclosure: This article does not represent investment advice. The content and materials featured on this page are for educational purposes only.
Source link

This Week in Crypto Games: Ubisoft’s ‘Might & Magic’, ‘Peaky Blinders’ in Development

Why Arbitrum-Nvidia Partnership Collapsed – And What It Means for Web3

Tariff Carnage Starting to Fulfill BTC’s ‘Store of Value’ Promise

The cost of innovation — Regulations are Web3’s greatest asset

Best Crypto to Buy as Derivatives Exchange CME Set to Launch XRP Futures

Metaplanet Buys Additional ¥1.92 Billion Worth Of Bitcoin

Here Are Four Signs the Stock Market Has Bottomed, According to Fundstrat’s Tom Lee

Bitcoin dips below $94,000 as ETFs record $3b weekly inflow

Bitcoin Post-Halving Price Performance Is the Worst on Record. Why?

Expert Predicts Start Date For Pi Network Price Pump

GameFi Tokens Show Signs of Life After Gala Games, White House Tie-Up

Bitcoin trades at ‘40% discount’ as spot BTC ETF buying soars to $3B in one week

Bitcoin Continues To Flow Out Of Major Exchanges — Supply Squeeze Soon?

BlackRock’s Bitcoin ETF Sees $643 Million Inflows

DePIN Altcoin Outpaces Crypto Market and Skyrockets by Nearly 44% Following High-Profile Exchange Listing

Arthur Hayes, Murad’s Prediction For Meme Coins, AI & DeFi Coins For 2025

Expert Sees Bitcoin Dipping To $50K While Bullish Signs Persist

3 Voting Polls Show Why Ripple’s XRP Price Could Hit $10 Soon

Aptos Leverages Chainlink To Enhance Scalability and Data Access

Bitcoin Could Rally to $80,000 on the Eve of US Elections

Crypto’s Big Trump Gamble Is Risky

Institutional Investors Go All In on Crypto as 57% Plan to Boost Allocations as Bull Run Heats Up, Sygnum Survey Reveals

Sonic Now ‘Golden Standard’ of Layer-2s After Scaling Transactions to 16,000+ per Second, Says Andre Cronje

The Future of Bitcoin: Scaling, Institutional Adoption, and Strategic Reserves with Rich Rines

Ripple-SEC Case Ends, But These 3 Rivals Could Jump 500x

Has The Bitcoin Price Already Peaked?

A16z-backed Espresso announces mainnet launch of core product

Xmas Altcoin Rally Insights by BNM Agent I

Blockchain groups challenge new broker reporting rule

I’m Grateful for Trump’s Embrace of Bitcoin
Trending

 24/7 Cryptocurrency News6 months ago
Arthur Hayes, Murad’s Prediction For Meme Coins, AI & DeFi Coins For 2025

 Bitcoin3 months ago
Expert Sees Bitcoin Dipping To $50K While Bullish Signs Persist
 Ripple Price1 month ago
3 Voting Polls Show Why Ripple’s XRP Price Could Hit $10 Soon

 24/7 Cryptocurrency News4 months ago
Aptos Leverages Chainlink To Enhance Scalability and Data Access

 Bitcoin6 months ago
Bitcoin Could Rally to $80,000 on the Eve of US Elections

 Opinion6 months ago
Crypto’s Big Trump Gamble Is Risky

 Bitcoin5 months ago
Institutional Investors Go All In on Crypto as 57% Plan to Boost Allocations as Bull Run Heats Up, Sygnum Survey Reveals

 Altcoins3 months ago
Sonic Now ‘Golden Standard’ of Layer-2s After Scaling Transactions to 16,000+ per Second, Says Andre Cronje


