
Bitcoin Magazine Pro
Bitcoin Hash Ribbons Indicator: Miners Show Unwavering Optimism as Hash Rate Hits New Highs

Bitcoin miners are sending a clear message: they’re more bullish than ever. As we observe new all-time highs in the Bitcoin network’s hash rate, the commitment of miners underscores their confidence in the asset’s long-term potential.
The Hash Ribbons Indicator Explained
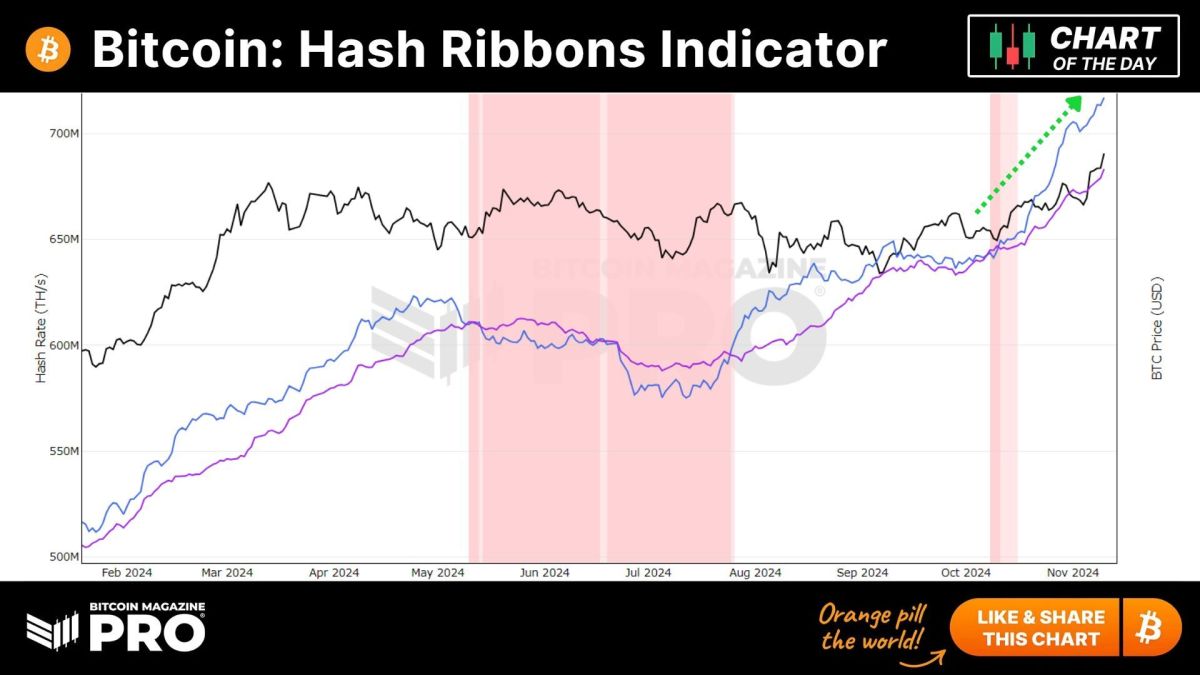
The Hash Ribbons indicator provides insight into miner activity and sentiment by analyzing the 30-day and 60-day moving averages of Bitcoin’s hash rate. When the 30-day moving average crosses above the 60-day, it suggests a positive shift, often interpreted as miner capitulation coming to an end. This shift typically signals that weaker miners have exited the market, leaving only resilient participants and setting the stage for potential price recovery.
Why All-Time Highs in Hash Rate Matter
As the Bitcoin network’s hash rate climbs to new peaks, it highlights the increasing amount of computational power devoted to securing the blockchain. This rise not only reflects strong miner confidence but also enhances the network’s resilience and security. In the current climate, these hash rate highs indicate that miners are holding their ground, undeterred by market fluctuations.
Interpreting the Current Hash Ribbon Signal
The chart above shows a recent bullish crossover in the Hash Ribbons, indicating the end of miner capitulation. Historically, these crossovers have often aligned with favorable price action in the weeks and months that follow. With hash rate reaching unprecedented levels, this crossover suggests that miners anticipate a period of sustained growth.
For an in-depth look at the Hash Ribbons Indicator and to stay updated with future movements, visit the source here: Bitcoin Magazine Pro.
Source link


Bitcoin’s price trajectory is once again capturing headlines, and this time the catalyst appears to be global liquidity trends reshaping investor sentiment. In a recent comprehensive breakdown, Matt Crosby, Lead Analyst at Bitcoin Magazine Pro, presents compelling evidence tying the digital asset’s renewed bullish momentum to the expanding global M2 money supply. His insights not only illuminate the future of Bitcoin price but also anchor its macroeconomic relevance in a broader financial context.

Bitcoin Price and Global Liquidity: A High-Impact Correlation
Crosby highlights a remarkable and consistent correlation—often exceeding 84%—between Bitcoin price and global M2 liquidity levels. As liquidity increases across the global economy, Bitcoin price typically responds with upward movement, although with a noticeable delay. Historical data supports the observation of a 56–60 day lag between monetary expansion and Bitcoin price increases.
This insight has recently proven accurate, as Bitcoin price rebounded from lows of $75,000 to above $85,000. This trend closely aligns with the forecasted recovery that Crosby and his team had outlined based on macro indicators, validating the strength and reliability of the correlation driving Bitcoin price upward.
Why the 2-Month Delay Impacts Bitcoin Price
The two-month delay in market response is a critical observation for understanding Bitcoin price movements. Crosby emphasizes that monetary policy and liquidity injections do not immediately affect speculative assets like BTC. Instead, there is an incubation period, typically around two months, during which liquidity filters through financial systems and begins to influence Bitcoin price.
Crosby has optimized this correlation through various backtests, adjusting timeframes and offsets. Their findings indicate that a 60-day delay yields the most predictive accuracy across both short-term (1-year) and extended (4-year) historical Bitcoin price action. This lag provides a strategic advantage to investors who monitor macro trends to anticipate Bitcoin price surges.
S&P 500 and Its Influence on Bitcoin Price Trends
Adding further credibility to the thesis, Crosby extends his analysis to traditional equity markets. The S&P 500 exhibits an even stronger all-time correlation of approximately 92% with global liquidity. This correlation strengthens the argument that monetary expansion is a significant driver not just for Bitcoin price, but also for broader risk-on asset classes.
By comparing liquidity trends with multiple indices, Crosby demonstrates that Bitcoin price is not an anomaly but part of a broader systemic pattern. When liquidity rises, equities and digital assets alike tend to benefit, making M2 supply an essential indicator for timing Bitcoin price movements.
Forecasting Bitcoin Price to $108,000 by June 2025
To build a forward-looking perspective, Crosby employs historical fractals from previous bull markets to project future Bitcoin price movements. When these patterns are overlaid with current macro data, the model points to a scenario where Bitcoin price could retest and potentially surpass its all-time highs, targeting $108,000 by June 2025.
This optimistic projection for Bitcoin price hinges on the assumption that global liquidity continues its upward trajectory. The Federal Reserve’s recent statements suggest that further monetary stimulus could be deployed if market stability falters—another tailwind for Bitcoin price growth.
The Rate of Expansion Affects Bitcoin Price
While rising liquidity levels are significant, Crosby stresses the importance of monitoring the rate of liquidity expansion to predict Bitcoin price trends. The year-on-year M2 growth rate offers a more nuanced view of macroeconomic momentum. Although liquidity has generally increased, the pace of expansion had slowed temporarily before resuming an upward trend in recent months.

This trend is strikingly similar to conditions observed in early 2017, just before Bitcoin price entered an exponential growth phase. The parallels reinforce Crosby’s bullish outlook on Bitcoin price and emphasize the importance of dynamic, rather than static, macro analysis.
Final Thoughts: Preparing for the Next Bitcoin Price Phase
While potential risks such as a global recession or a significant equity market correction persist, current macro indicators point toward a favorable environment for Bitcoin price. Crosby’s data-driven approach offers investors a strategic lens to interpret and navigate the market.
For those looking to make informed decisions in a volatile environment, these insights provide actionable intelligence grounded in economic fundamentals to capitalize on Bitcoin price opportunities.
For more deep-dive research, technical indicators, real-time market alerts, and access to a growing community of analysts, visit BitcoinMagazinePro.com.

Disclaimer: This article is for informational purposes only and should not be considered financial advice. Always do your own research before making any investment decisions.
Source link
With all the current bearish sentiment and macroeconomic uncertainty swirling around both Bitcoin and the broader global economy, it might come as a surprise to see miners as bullish as ever. In this article, we’ll unpack the data that suggests Bitcoin miners are not just staying the course, they’re accelerating, doubling down at a time when many are pulling back. What exactly do they know that the broader market might be missing?
For a more in-depth look into this topic, check out a recent YouTube video here:
Why Bitcoin Miners Are Doubling Down Right Now
Bitcoin Hash Rate Going Parabolic
Despite Bitcoin’s recent price underperformance, the Bitcoin Hashrate has been going absolutely vertical, breaking all-time highs with seemingly no regard for macro headwinds or sluggish price action. Typically, hash rate is tightly correlated with BTC price; when price drops sharply or remains stagnant, hash rate tends to plateau or decline due to economic pressure on miners.
Yet now, in the face of heightened global tariffs, economic slowdown, and a consolidating BTC price, hash rate is accelerating. Historically, this level of divergence between hash rate and price has been rare and often significant.

Bitcoin Miner Difficulty, a close cousin to hash rate, just saw one of its largest single adjustments upward in history. This metric, which auto-adjusts to keep Bitcoin’s block timing consistent, only increases when more computational power floods the network. A difficulty spike of this magnitude, especially when paired with poor price performance, is nearly unprecedented.
Again, this suggests that miners are investing heavily in infrastructure and resources, even when BTC price does not appear to support the decision in the short term.

Adding further intrigue, the Hash Ribbons Indicator, a blend of short and long-term hash rate moving averages, recently flashed a classic Bitcoin buy signal.
When the 30-day moving average (blue line) crosses back above the 60-day (purple line), it signals the end of miner capitulation and the beginning of renewed miner strength. Visually, the background of the chart shifts from red to white when this crossover occurs. This has often marked powerful inflection points for BTC price.

What’s striking this time around is how aggressively the 30-day moving average is surging away from the 60-day. This is not just a modest recovery, it’s a statement from miners that they are betting heavily on the future.
The Tariff Factor
So, what’s fueling this miner frenzy? One plausible explanation is that miners, especially U.S.-based ones, are trying to front-run the impact of looming tariffs. Bitmain, the dominant producer of mining equipment, is now in the crosshairs of trade policies that could see equipment prices surge by 30–50%, potentially to even over 100%!

Given that over 40% of Bitcoin’s hash rate is controlled by U.S.-based pools like Foundry USA, Mara Pool, and Luxor, any cost increase would drastically reduce profit margins. Miners may be aggressively scaling now while hardware is still (relatively) cheap and available.
Bitcoin Miners Keep Mining
Hashprice, the BTC-denominated revenue per terahash of computational power, is at historical lows. In other words, it’s never been less profitable in BTC terms to operate a Bitcoin miner on a per-terahash basis. Typically, we see hash price increase toward the tail-end of bear markets, as competition fades and weaker players exit the space.

But that’s not happening here. Despite terrible profitability, miners are not only staying online, they’re deploying more hash power. This could imply one of two things; either miners are racing against deteriorating margins to front-load BTC accumulation, or, more optimistically, they have strong conviction in Bitcoin’s future profitability and are buying the dip aggressively.
Bitcoin Miners Conclusion
So, what’s really happening? Either miners are desperately front-running hardware costs, or, more likely, they’re signaling one of the strongest collective votes of confidence in the future of Bitcoin we’ve seen in recent memory. We’ll continue tracking these metrics in future updates to see whether this miner conviction is proven right.

If you’re interested in more in-depth analysis and real-time data, consider checking out Bitcoin Magazine Pro for valuable insights into the Bitcoin market.
Disclaimer: This article is for informational purposes only and should not be considered financial advice. Always do your own research before making any investment decisions.
Source link

Bitcoin has seen an institutional capital influx on a scale previously unfathomable. Billions of dollars are flowing into Bitcoin ETFs, reshaping the liquidity landscape, inflow-outflow dynamics, and investor psychology. While many interpret this movement as smart money executing complex strategies backed by proprietary analytics, a surprising reality surfaces: outperforming the institutions might not be as difficult as it seems.
For a more in-depth look into this topic, check out a recent YouTube video here:
Outperforming Bitcoin – Invest Like Institutions
Canary In The Bitcoin Coal Mine
One of the most revealing datasets available today is daily Bitcoin ETF flow data. These flows, denoted in USD, offer direct insight into how much capital is entering or exiting the Bitcoin ETF ecosystem on any given day. This data has a startlingly consistent relationship with short to mid-term price action.
Importantly, while these flows do impact price, they are not the primary movers of a multi-trillion-dollar market. Instead, ETF activity functions more like a mirror for broad market sentiment, especially as retail traders dominate volume during trend inflections.

Surprisingly Simple
The average retail investor often feels outmatched, overwhelmed by the data, and disconnected from the tactical finesse institutions supposedly wield. But institutional strategies are often simple trend-following mechanisms that can be emulated and even surpassed with disciplined execution and proper risk framing:
Strategy Rules:
- Buy when ETF flows are positive for the day.
- Sell when ETF flows turn negative.
- Execute each trade at daily close, using 100% portfolio allocation for clarity.
- No complex TA, no trendlines, just follow the flows.
This system was tested using Bitcoin Magazine Pro’s ETF data starting from January 2024. The base assumption was a first entry on Jan 11, 2024, at ~$46,434 with subsequent trades dictated by flow changes.

Performance vs. Buy-and-Hold
Backtesting this basic ruleset yielded a return of 118.5% as of the end of March 2025. By contrast, a pure buy-and-hold position over the same period yielded 81.7%, a respectable return, but a near 40% underperformance relative to this proposed Bitcoin ETF strategy.
Importantly, this strategy limits drawdowns by reducing exposure during downtrends, days marked by institutional exits. The compounding benefit of avoiding steep losses, more than catching absolute tops or bottoms, is what drives outperformance.

Institutional Behavior
The prevailing myth is that institutional players operate on superior insight. In reality, the majority of Bitcoin ETF inflows and outflows are trend-confirming, not predictive. Institutions are risk-managed, highly regulated entities; they’re often the last to enter and the first to exit based on trend and compliance cycles.
What this means is that institutional trades tend to reinforce existing price momentum, not lead it. This reinforces the validity of using ETF flows as a proxy signal. When ETFs buy, they’re confirming a directional shift that is already unfolding, allowing the retail investor to “surf the wave” of their capital inflow.

Conclusion
The past year has proven that beating Bitcoin’s buy-and-hold strategy, one of the toughest benchmarks in financial history, is not impossible. It requires neither leverage nor complex modeling. Instead, by aligning oneself with institutional positioning, retail investors can benefit from market structure shifts without the burden of prediction.
This doesn’t mean the strategy will work forever. But as long as institutions continue to influence price through these large, visible flow mechanics, there is an edge to be gained in simply following the money.

If you’re interested in more in-depth analysis and real-time data, consider checking out Bitcoin Magazine Pro for valuable insights into the Bitcoin market.
Disclaimer: This article is for informational purposes only and should not be considered financial advice. Always do your own research before making any investment decisions.
Source link

Why Did Bitcoin Price (BTC) Fall on Wednesday Afternoon

Solana price is up 36% from its crypto market crash lows — Is $180 SOL the next stop?

Solana Retests Bearish Breakout Zone – $65 Target Still In Play?

How Expanding Global Liquidity Could Drive Bitcoin Price To New All-Time Highs

Apple Delists 14 Crypto Apps in South Korea Including KuCoin and MEXC Exchanges Amid Regulatory Crackdown

Athens Exchange Group eyes first onchain order book via Sui

Futureverse Acquires Candy Digital, Taps DC Comics and Netflix IP to Boost Metaverse Strategy
Court Grants Ripple And SEC’s Joint Motion To Suspend Appeal

AVAX Falls 2.1% as Nearly All Assets Trade Lower

What is a VTuber, and how do you become one in 2025?

Top Expert’s Update Sets $10 Target

How Academia Interacts With The Bitcoin Ecosystem

AB DAO and Bitget Launch Dual Reward Campaign, Distributing $2.6M Worth of $AB Globally

AI crypto tokens at risk as Nvidia faces restrictions on China exports

Coinbase Urges Australia to Vote for Crypto Progress in May


 24/7 Cryptocurrency News5 months ago
Arthur Hayes, Murad’s Prediction For Meme Coins, AI & DeFi Coins For 2025

 Bitcoin3 months ago
Expert Sees Bitcoin Dipping To $50K While Bullish Signs Persist

 24/7 Cryptocurrency News3 months ago
Aptos Leverages Chainlink To Enhance Scalability and Data Access

 Bitcoin5 months ago
Bitcoin Could Rally to $80,000 on the Eve of US Elections

 Opinion5 months ago
Crypto’s Big Trump Gamble Is Risky

 Bitcoin5 months ago
Institutional Investors Go All In on Crypto as 57% Plan to Boost Allocations as Bull Run Heats Up, Sygnum Survey Reveals

 Altcoins3 months ago
Sonic Now ‘Golden Standard’ of Layer-2s After Scaling Transactions to 16,000+ per Second, Says Andre Cronje

 Price analysis5 months ago
Ripple-SEC Case Ends, But These 3 Rivals Could Jump 500x
