
Bitcoin
Bitcoin Indicator Signals Equilibrium After Trump Victory – A Clear Path To New Highs?

Bitcoin is trading around $75,000 following Donald Trump’s victory in the U.S. election, stirring fresh optimism in the crypto market. Trump’s pro-crypto stance has ignited excitement among analysts and investors who anticipate favorable policies for digital assets in his administration. With Bitcoin now sitting at all-time highs, many speculate this could begin a new rally phase.
Related Reading: Ethereum Analyst Sets $3,400 Target Once ETH Breaks Key Resistance – Details
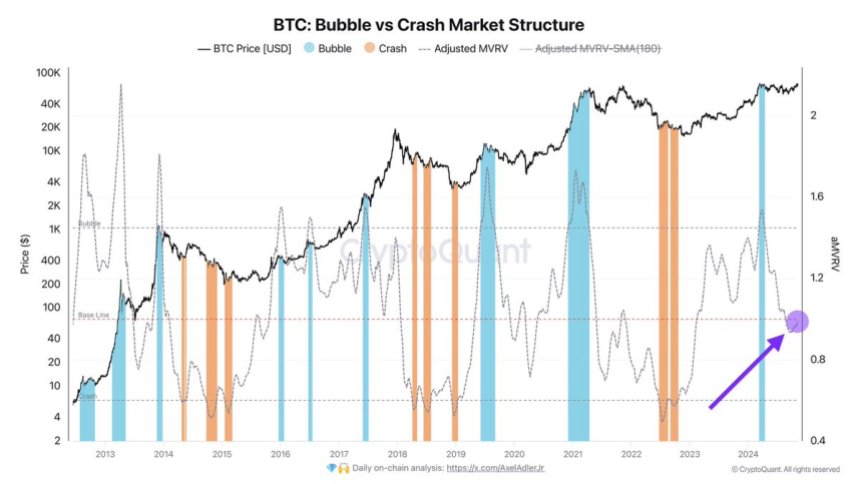
Key data from CryptoQuant indicates that Bitcoin has reached a price equilibrium, suggesting there are no strong market forces pulling the price lower. This positive equilibrium reinforces the bullish outlook and hints at a stable foundation for further growth. Analysts believe Bitcoin may be set for new highs with fewer obstacles in the coming weeks.
As investor confidence builds, some view this phase as a critical moment for Bitcoin to solidify its position in a pro-crypto policy environment. The combination of strong technical support and positive sentiment from Trump’s victory has set the stage for what many hope will be a significant upward trend, potentially driving the broader crypto market higher.
Bitcoin Enters A Bullish Phase
Bitcoin has officially entered a bullish phase after breaking past its previous all-time highs, reaching $76,500. This level has become a new area of focus as many analysts identify it as a potential resistance zone.
According to CryptoQuant analyst Axel Adler, the market is currently balanced between a “Bubble” and a “Crash” phase. Adler’s analysis, which includes key on-chain data, suggests that Bitcoin’s market structure is at an equilibrium, meaning there are no significant fundamental reasons to anticipate a drop. Instead, this setup provides a stable foundation for possibly continuing Bitcoin’s upward trend.
With the Federal Reserve’s interest rate decision set to be announced today, the next few weeks promise to be pivotal. A stable or favorable decision from the Fed could reinforce the optimism in the market, drawing in new demand and reinforcing Bitcoin’s position above $76,000.
Many investors and analysts expect heightened activity from institutional players, particularly given Bitcoin’s resilience around this milestone level. The market’s balance at this juncture is crucial. As long as Bitcoin maintains its current structure, it has the potential to continue its upward trajectory without substantial risk of retracement.
Related Reading
With fresh demand entering the market and the macroeconomic backdrop shaping up favorably, Bitcoin may soon aim for even higher levels. For now, all eyes remain on the $76,500 mark and how the market will respond in the wake of the Federal Reserve’s announcement. This period of consolidation could be the catalyst for the next leg up, solidifying Bitcoin’s bullish outlook.
BTC Key Levels To Watch
Bitcoin is trading at $75,000, holding steady above its previous all-time high of approximately $73,800. This level has become a critical support zone as BTC continues in a well-defined 4-hour uptrend. The trend began after a strong bounce from the 200 exponential moving average (EMA) at $66,800, indicating renewed bullish momentum.
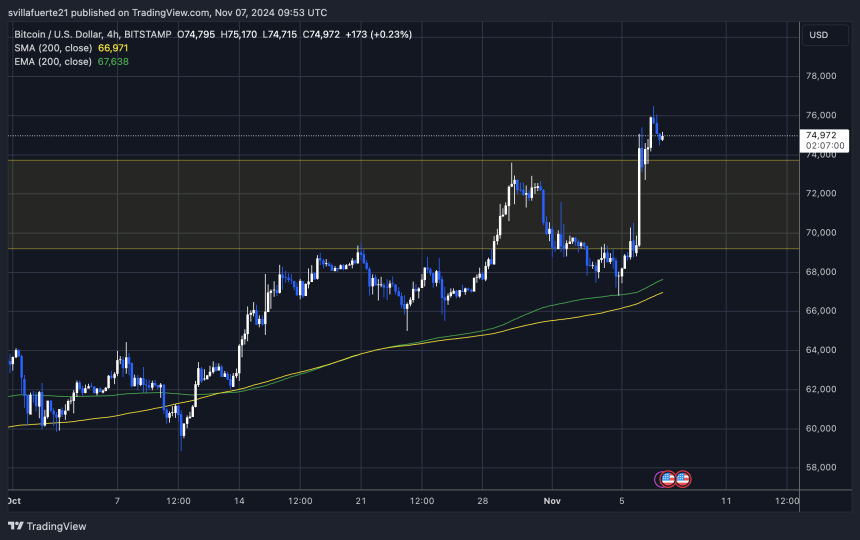
Bulls need to keep the price above the $73,000 mark to sustain this momentum, a key psychological threshold. This level boosts market confidence and provides a potential springboard for Bitcoin to reach higher targets soon. A confirmed hold above $73,000 could signal further upside, inviting additional buying pressure and potentially setting up BTC for new highs.
Related Reading
However, if BTC fails to hold this level, it could slip toward a lower demand area of around $70,500. Despite this possibility, current price action shows no significant signs of a downturn. The steady uptrend and firm support levels suggest that Bitcoin’s bullish outlook remains intact, with little indication of an imminent drop.
As long as BTC maintains its structure, the path toward continued gains remains clear, reinforcing confidence in the ongoing rally.
Featured image from Dall-E, chart from TradingView
Source link


Veteran macro investor Luke Gromen says he likes Bitcoin (BTC) due to its potential to influence demand for US Treasuries.
In a new video update, the founder of the macroeconomic research firm Forest for the Trees (FFTT) says the Trump administration is in a position to boost demand for US bonds after the president signed an executive order creating a Strategic Bitcoin Reserve.
A Bitcoin bull market typically increases demand for dollar-pegged crypto assets, and according to Gromen, could ultimately drive demand for US Treasuries.
“Note that the Trump administration is still talking about putting T-bills (Treasury bills) into stablecoins, using stablecoins as a means to drive demand for T-bills. And obviously, they’ve talked about the Strategic Bitcoin Reserve.
Left unsaid in all of that is that the higher the Bitcoin price, the more stablecoin demand, the more T-bill demand there is…
I think the underlying theme of [the] US government desperately needs balance sheet and stablecoins and therefore Bitcoin can help the US government find balance sheet. I think that is absolutely still in play.
It’s one of the reasons why we still like Bitcoin over the intermediate longer term.”
Stablecoin issuers such as Tether and Circle predominantly rely on Treasury bills to back their coins on a 1:1 basis. As of December 2024, Tether has invested over $94.47 billion in T-bills to back USDT. Meanwhile, Circle owns $22.047 billion worth of T-bills as of February of this year to back USDC.
Additionally, two stablecoin bills that are progressing through Congress, the STABLE Act of 2025 and the GENIUS Act of 2025, require issuers to invest in T-bills and other real-world assets to back their coins.
Follow us on X, Facebook and Telegram
Don’t Miss a Beat – Subscribe to get email alerts delivered directly to your inbox
Check Price Action
Surf The Daily Hodl Mix
 

Disclaimer: Opinions expressed at The Daily Hodl are not investment advice. Investors should do their due diligence before making any high-risk investments in Bitcoin, cryptocurrency or digital assets. Please be advised that your transfers and trades are at your own risk, and any losses you may incur are your responsibility. The Daily Hodl does not recommend the buying or selling of any cryptocurrencies or digital assets, nor is The Daily Hodl an investment advisor. Please note that The Daily Hodl participates in affiliate marketing.
Generated Image: Midjourney
Source link


Shaurya is the Co-Leader of the CoinDesk tokens and data team in Asia with a focus on crypto derivatives, DeFi, market microstructure, and protocol analysis.
Shaurya holds over $1,000 in BTC, ETH, SOL, AVAX, SUSHI, CRV, NEAR, YFI, YFII, SHIB, DOGE, USDT, USDC, BNB, MANA, MLN, LINK, XMR, ALGO, VET, CAKE, AAVE, COMP, ROOK, TRX, SNX, RUNE, FTM, ZIL, KSM, ENJ, CKB, JOE, GHST, PERP, BTRFLY, OHM, BANANA, ROME, BURGER, SPIRIT, and ORCA.
He provides over $1,000 to liquidity pools on Compound, Curve, SushiSwap, PancakeSwap, BurgerSwap, Orca, AnySwap, SpiritSwap, Rook Protocol, Yearn Finance, Synthetix, Harvest, Redacted Cartel, OlympusDAO, Rome, Trader Joe, and SUN.
Source link

The Ethereum-to-Bitcoin ratio has fallen to its lowest level in five years after a dismal Ethereum price performance. As investors try to wrap their heads around the grim metric, Taproot Wizards co-founder Eric Wall has explained the reason behind the steep drop.
Eric Wall Highlights Reasons For ETH/BTC Ratio Collapse
Taproot Wizards co-founder Eric Wall has identified a raft of reasons behind the decline of the ETH/BTC ratio in 2025. The cryptocurrency expert revealed the factors behind the falling ETH/BTC ratio in an X post, hinging the bulk of the blame on Ethereum’s recent price performance.
The ETH/BTC ratio slumped to a five-year low after Ethereum bucked the trend of following Bitcoin on a rally after the halving event. While Bitcoin price rose to cross the $100K mark, Ethereum price has tumbled below $2,000 to reach lows of $1,400.
For Wall, one factor affecting the ETH/BTC ratio appears to be Ethereum’s position in a competitive landscape. Since its launch, several blockchains have cropped up to snag market share from the largest altcoin, offering cheaper fees and faster processing times.
The cryptocurrency expert argues that the absence of a Saylor-like buyer for ETH is playing its role in the decline of the ETH/BTC ratio. Michael Saylor’s BTC purchases have contributed to the asset’s performance, but Wall argues that Ethereum does not have a consistent buyer.
Wall adds that Bitcoin and gold have evolved into wartime assets in the current macroeconomic climate, while ETH is considered a “peacetime asset.” Gold has surged to new highs, sparking optimism that Bitcoin will follow in the same path for a similar rally, while the Ethereum price continues its unimpressive run.
The Merge Is Not Responsible For The Ratio Decline
Eric Wall notes that Ethereum’s Merge event is not responsible for the ETH/BTC slump, contrary to popular sentiment. Ethereum migrated from Proof-of-Work to Proof-of-Stake in 2022, with the ETH/BTC ratio tanking since the Merge.
“The ETHBTC ratio did not go down because of The Merge,” said Eric Wall.
However, pseudonymous cryptocurrency analyst Beanie argues that the Merge is the primary reason for the price decline. Rebuffing the speculation, Wall opines that Ethereum’s layer 2 tokens triggered network fragmentation after botching the “asset value capture narrative,” affecting the ETH/BTC ratio.
“Ethereum also stagnated into a depressingly small number of defi primitives relative to what past expectations were,” added Wall.
Ethereum is flashing signs of brilliance after ETH trading volume spiked to $17.5 billion in less than a day. ETH prices are exchanging hands at nearly 1,800 after an impressive 12% rally that saw it outperform SOL and XRP
Aliyu Pokima
Aliyu Pokima is a seasoned cryptocurrency and emerging technologies journalist with a knack for covering needle-moving stories in the space. Aliyu delivers breaking news stories, regulatory updates, and insightful analysis with depth and precision. When he’s not poring over charts or following leads, Aliyu enjoys playing the bass guitar, lifting weights and running marathons.
Disclaimer: The presented content may include the personal opinion of the author and is subject to market condition. Do your market research before investing in cryptocurrencies. The author or the publication does not hold any responsibility for your personal financial loss.
Source link

Here’s How Bitcoin Could Boost Demand for US Treasuries, According to Macro Guru Luke Gromen

Experts Predict US Recession in 2025 if Trump-China Trade War Tariffs Stay

Monero Jumps 51% After ‘Suspicious Transfer’ of $333M in Bitcoin

ZachXBT flags suspicious $330M Bitcoin transfer triggering Monero surge

Monero’s XMR Rockets 40% as XRP Leads Crypto Majors Gains

The 5 top crypto loan platforms of 2025

XRP Price Shows Strength — Breakout Above Key Levels Possible?

Expert Reveals Why The Ethereum-To-Bitcoin Ratio Is Falling

Analyst Says Solana-Based Memecoin Going Much Higher, Sees PENGU Facing ‘True Test’ After April Surge

Nike sued for $5 million over its shutdown of NFT platform RTFKT

Biological Age vs. Chronological Age: Redefining Age in the Digital Era

TRUMP whale regrets sale, pays double to buy back meme coins

Stripe Tests New Stablecoin Project as $3.7T Market Looms

Falling Wedge Pattern Confirms $264 target
Dogecoin Confirms Daily Trend Reversal With Breakout, Retest, And New Uptrend


 24/7 Cryptocurrency News6 months ago
Arthur Hayes, Murad’s Prediction For Meme Coins, AI & DeFi Coins For 2025

 Bitcoin3 months ago
Expert Sees Bitcoin Dipping To $50K While Bullish Signs Persist

 Ripple Price1 month ago
3 Voting Polls Show Why Ripple’s XRP Price Could Hit $10 Soon

 24/7 Cryptocurrency News4 months ago
Aptos Leverages Chainlink To Enhance Scalability and Data Access

 Bitcoin6 months ago
Bitcoin Could Rally to $80,000 on the Eve of US Elections

 Opinion6 months ago
Crypto’s Big Trump Gamble Is Risky

 Bitcoin6 months ago
Institutional Investors Go All In on Crypto as 57% Plan to Boost Allocations as Bull Run Heats Up, Sygnum Survey Reveals

 Bitcoin3 months ago
The Future of Bitcoin: Scaling, Institutional Adoption, and Strategic Reserves with Rich Rines

✓ Share: