
Bitcoin
Bitcoin On Track For $275,000? Analyst Cites Cup And Handle Formation
Bitcoin (BTC) fell to $94,500 yesterday after Microsoft shareholders decisively rejected a Bitcoin treasury proposal to allocate 1% of the company’s total assets to buy BTC as an inflation hedge. However, analysts are still confident of further appreciation of the BTC price.
Bitcoin May Surge As High As $275,000
According to data from Coinglass, over $478 million worth of contracts – primarily long positions – were liquidated in the past 24 hours following the plunge in BTC and other cryptocurrencies. Interestingly, liquidation volumes were higher in altcoins compared to Bitcoin.
Related Reading
However, some analysts view this price dip as a buying opportunity. Seasoned crypto analyst Ali Martinez took to X to highlight a long cup and handle pattern forming on Bitcoin’s weekly chart.
For those unfamiliar, the cup and handle pattern is a bullish technical formation that resembles a rounded “cup” followed by a brief consolidation period or “handle.” It typically signals the potential for a continuation of an uptrend, often leading to significant price gains.
Martinez noted that the pattern suggests Bitcoin could surge as high as $275,000, based on its technical structure. However, he also urged traders to exercise caution and avoid overleveraging their positions.
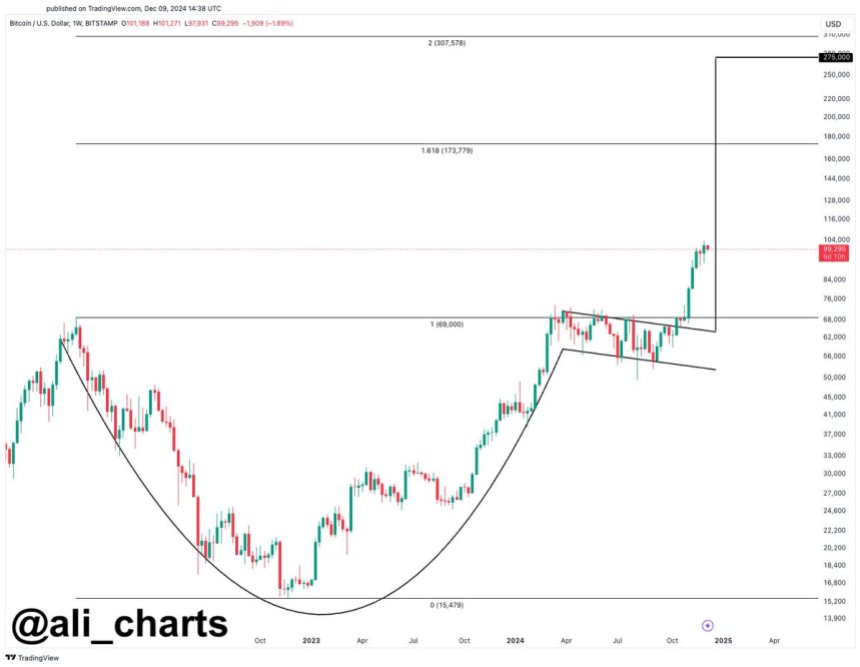
On the other hand, prominent crypto analyst @Trader_XO warned that Bitcoin must maintain its support at $90,000 to avoid further downside. Should BTC lose this critical level, it could drop as low as $85,000. Conversely, holding above $90,000 would allow the cryptocurrency to rebound and resume its uptrend.
BTC Takes Another Jab At Breaking Through $100,000
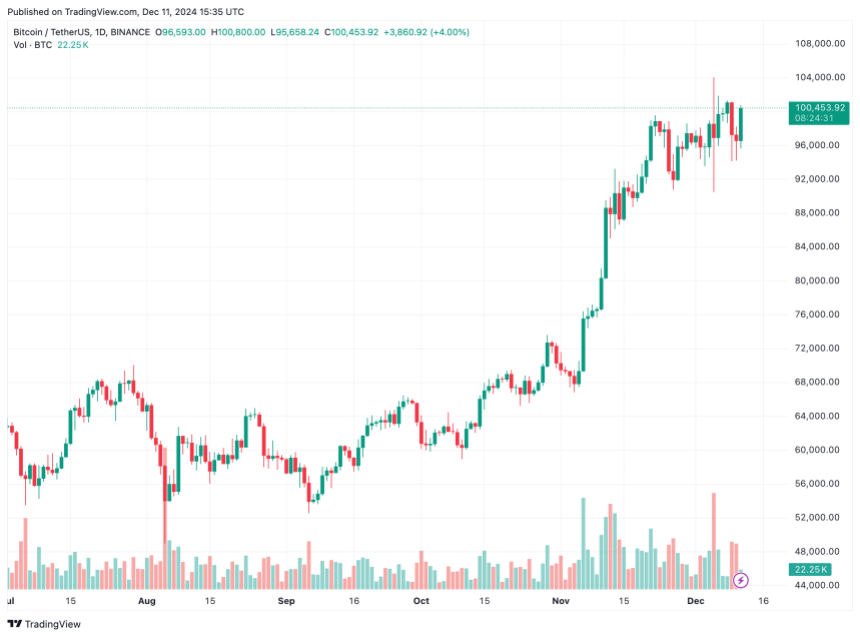
Despite yesterday’s dip, Bitcoin recovered swiftly, trading near $100,000 at the time of writing. The flagship cryptocurrency has remained in an overall uptrend, likely bolstered by today’s US inflation data for November, which largely aligned with market expectations.
Related Reading
Bitcoin recently hit a new all-time high (ATH) of $103,679, according to data from CoinGecko. However, its price has fluctuated above and below the pivotal $100,000 mark, leading to over $1.5 billion in liquidations in the past week.
Several factors could drive Bitcoin’s price to a new ATH. For instance, BTC reserves on cryptocurrency exchanges have hit multi-year lows, reflecting rising demand for the digital asset.
American financier and former investment banker Anthony Scaramucci recently predicted China might establish its own Bitcoin reserve if the US proceeds with its strategic Bitcoin reserve plans. National BTC reserves are expected to reinforce Bitcoin’s supply scarcity narrative, potentially driving prices higher.
At the same time, BTC adoption among corporations continues to rise, as Canadian video-sharing firm Rumble became the latest company to unveil a BTC treasury strategy. BTC trades at $100,453 at press time, up 4.1% in the past 24 hours.
Featured image from Unsplash, Charts from X and TradingView.com
Source link


April has been a month of extreme volatility and tumultuous times for traders.
From conflicting headlines about President Donald Trump’s tariffs against other nations to total confusion about which assets to seek shelter in, it has been one for the record books.
Amid all the confusion, when traditional “haven assets” failed to act as safe places to park money, one bright spot emerged that might have surprised some market participants: bitcoin.
“Historically, cash (the US dollar), bonds (US Treasuries), the Swiss Franc, and gold have fulfilled that role [safe haven], with bitcoin edging in on some of that territory,” said NYDIG Research in a note.

NYDIG’s data showed that while gold and Swiss Franc had been consistent safe-haven winners, since ‘Liberation Day’—when President Trump announced sweeping tariff hikes on April 2, kicking off extreme volatility in the market—bitcoin has been added to the list.
“Bitcoin has acted less like a liquid levered version of levered US equity beta and more like the non-sovereign issued store of value that it is,” NYDIG wrote.
Zooming out, it seems that as the “sell America” trade gains momentum, investors are taking notice of bitcoin and the original promise of the biggest cryptocurrency.
“Though the connection is still tentative, bitcoin appears to be fulfilling its original promise as a non-sovereign store of value, designed to thrive in times like these,” NYDIG added.
Read more: Gold and Bonds’ Safe Haven Allure May be Fading With Bitcoin Emergence
Source link

Reason to trust
![]()
Strict editorial policy that focuses on accuracy, relevance, and impartiality
Created by industry experts and meticulously reviewed
The highest standards in reporting and publishing
Strict editorial policy that focuses on accuracy, relevance, and impartiality
Morbi pretium leo et nisl aliquam mollis. Quisque arcu lorem, ultricies quis pellentesque nec, ullamcorper eu odio.
It was quite the coincidence that the cryptocurrency market jolted back to life after Easter Sunday, with Bitcoin leading the way with more than a double-digit gain. While the price of BTC continues to hold above the critical $94,000 level, the premier cryptocurrency seems to be losing some momentum.
Unsurprisingly, investors appear to be increasingly confident in the promise of this recent rally, as significant amounts of BTC continue to make their way off major centralized exchanges over the past few days. Here’s how much investors have moved in the past few days.
Over 35,000 BTC Move Out Of Coinbase And Binance
In a Quicktake post on the CryptoQuant platform, crypto analyst João Wedson revealed that Binance, the world’s largest cryptocurrency exchange by trading volume, has seen increased activity over the past few days. The exchange netflow data shows that huge amounts of Bitcoin have been withdrawn from the platform in recent days.
Related Reading
According to CryptoQuant data, a total of 27,750 BTC (worth $2.63 billion at current price) was moved out of Binance on Friday, April 25. This latest round of withdrawals represents the third-largest net outflow in the centralized exchange’s history.
The movement of significant crypto amounts from exchanges, which offer services like selling to non-custodial wallets, suggests a potential shift in investor sentiment and strategy. Large exchange outflows often signal increased confidence of holders in the long-term potential of an asset.
Wedson noted that the recent outflows do not guarantee a price rally for Bitcoin, but they do signal strong institutional activity, which is often a precursor for major volatility. Citing China’s crypto ban in 2021, the crypto analyst highlighted how massive exchange outflows didn’t prevent the dump.

At the same time, Wedson mentioned that the continuous Bitcoin outflows over several days, like during the FTX collapse, preceded a price bottom and the eventual market recovery. Ultimately, the online pundit hinted at paying close attention to the overall trend of the exchange netflow rather than a single-day activity.
Similarly, more than 7,000 BTC (worth approximately $66.5 million) have made their way out of the Coinbase exchange. According to the CryptoQuant analyst Amr Taha, this negative exchange netflow could be an indicator of increased institutional activity, as Coinbase is known as the primary crypto vendor for US-based institutions.
Taha said:
These large outflows typically suggest accumulation by institutions or large investors, potentially signaling bullish sentiment.
The analyst outlined that if the dwindling exchange reserves correlate with an increased spot demand or ETF inflows, a supply squeeze could be on the horizon, potentially pushing the price to the upside.
Bitcoin Price At A Glance
As of this writing, the price of BTC sits just beneath $95,200, reflecting an almost 2% increase in the past 24 hours.
Related Reading
Featured image from iStock, chart from TradingView
Source link

The Bitcoin market saw another rebound in the past week as prices leaped by over 12% to hit a local peak of $95,600. Amid the ongoing market euphoria, prominent blockchain analytics company Glassnode has shared some important developments in the Bitcoin derivative markets.
Bitcoin Short Bets Rise Despite Price Rally, Setting Stage For Volatility
Despite a bullish trading week, derivative traders are approaching the Bitcoin market with skepticism, as evidenced by a build-up of leveraged short positions.
In a recent X post on April 25, Glassnode reported that Open Interest (OI) in Bitcoin perpetual swaps climbed to 218,000 BTC, marking a 15.6% increase from early March. In line with market activity, this rise in Open Interest aligns with increased leverage, introducing the potential for market volatility via liquidations or stop-outs.

Generally, a rise in Open Interest amidst a price rally is expected to signal long-term market confidence. However, Glassnode’s findings have revealed an opposite scenario. Despite Bitcoin’s bullish strides in the past week, short market positions appear to be dominating the perpetual futures markets.
This concerning development is indicated by a decline in the average funding rate, which has now slipped into negative territory to sit around -0.023%. The perpetual funding rate is a periodic payment between long and short traders aimed at keeping the contract price in line with the underlying spot price.
A negative funding rate indicates short traders pay long traders as Bitcoin’s perpetual contract price is trading below the spot price. This is caused by a higher number of short positions as traders are largely bearish about Bitcoin, even despite recent gains.
Furthermore, the 7-day moving average (7DMA) of long-side funding premiums has dropped to $88,000 per hour, reinforcing this short-dominant sentiment. This downtrend indicates a waning demand for long positions, as traders exhibit a short bias.
However, Glassnode presents a bullish note stating that the present combination of rising leverage and short positions paves the way for a potential short squeeze, where an unexpected upward price move forces short-sellers to close their positions, thereby driving prices even higher.
Bitcoin Price Overview
At the time of writing, Bitcoin trades at $94,629 following a 1.01% retracement from its local peak price on April 25. Despite creeping developments in the perpetual futures market, the BTC market remains highly bullish, indicated by gains of 1.02%, 11.12%, and 8.32% in the last one, seven, and thirty days, respectively. With a market cap of $1.88 trillion, the premier cryptocurrency ranks as the largest digital asset and fifth-largest asset in the world.
Related Reading: Ethereum To Hit $5k Before Its 10th Birthday, Justin Sun Says
Source link

Biological Age vs. Chronological Age: Redefining Age in the Digital Era

TRUMP whale regrets sale, pays double to buy back meme coins

Stripe Tests New Stablecoin Project as $3.7T Market Looms

Falling Wedge Pattern Confirms $264 target
Dogecoin Confirms Daily Trend Reversal With Breakout, Retest, And New Uptrend

Ethereum community members propose new fee structure for the app layer

Crypto Investors Sue Nike, Accuse Apparel Giant of Rug Pull After Abrupt Closure of Metaverse Business: Report

Top cryptocurrencies to watch: Pi Network, XRP, Sui

This Week in Crypto Games: Ubisoft’s ‘Might & Magic’, ‘Peaky Blinders’ in Development

Why Arbitrum-Nvidia Partnership Collapsed – And What It Means for Web3

Tariff Carnage Starting to Fulfill BTC’s ‘Store of Value’ Promise

The cost of innovation — Regulations are Web3’s greatest asset

Best Crypto to Buy as Derivatives Exchange CME Set to Launch XRP Futures

Metaplanet Buys Additional ¥1.92 Billion Worth Of Bitcoin

Here Are Four Signs the Stock Market Has Bottomed, According to Fundstrat’s Tom Lee


 24/7 Cryptocurrency News6 months ago
Arthur Hayes, Murad’s Prediction For Meme Coins, AI & DeFi Coins For 2025

 Bitcoin3 months ago
Expert Sees Bitcoin Dipping To $50K While Bullish Signs Persist

 Ripple Price1 month ago
3 Voting Polls Show Why Ripple’s XRP Price Could Hit $10 Soon

 24/7 Cryptocurrency News4 months ago
Aptos Leverages Chainlink To Enhance Scalability and Data Access

 Bitcoin6 months ago
Bitcoin Could Rally to $80,000 on the Eve of US Elections

 Opinion6 months ago
Crypto’s Big Trump Gamble Is Risky

 Bitcoin5 months ago
Institutional Investors Go All In on Crypto as 57% Plan to Boost Allocations as Bull Run Heats Up, Sygnum Survey Reveals

 Altcoins3 months ago
Sonic Now ‘Golden Standard’ of Layer-2s After Scaling Transactions to 16,000+ per Second, Says Andre Cronje
