
Bitcoin price
Bitcoin Price Set To Explode as Global Liquidity Z Score Flashes Buy Signal
Bitcoin (BTC) showed strength over the weekend after a 2.45% rally to the upside. This minor rally aligns with the US stock market’s positive outlook and rising global liquidity, which promotes a risk-on behavior among investors. With the global liquidity index’s Z score flashing a buy signal, Bitcoin price could be set for explosive growth in the near future.
Bitcoin Price Today
Bitcoin price today is up 1.39%, continuing its weekend rally, slowly approaching the $90,000 psychological level. BTC saw a 4.24% gain last week, marking the second positive week after a brutal 15% sell-off in the first week of March.
Odds of BTC Rally Improves as Global Liquidity Explodes
According to data provider Alpha Edge, the traditional Global Liquidity Index is not a great tool to track. However, the Z-score of this metric shows that every time the liquidity index has fallen to -3, it was a strong buy signal. On the other hand, a +3 reading of the Z score is a sell signal. After the early March crash, the Global Liquidity Index flashed a buy signal, suggesting that an explosive uptrend is next for BTC price.
“The Divergence metric between Global Liquidity and Bitcoin has flashed a rare green buy signal. Historically, every green buy or red sell offered a good opportunity to add or sell.”

With abundant liquidity, risk-on behaviour is a must, as seen in late 2021 and 2023, which were followed by periods of exponential rally in BTC price.
Reduced Selling Pressure Points to Bullish Bitcoin Outlook
Adding credence to this outlook is the net Taker Volume indicator that has been reducing since late February 2025. A decline in this metric shows that the selling pressure is dwindling, which further hints at a potential bullish reversal in Bitcoin price trend.
Analyst Axel Adler Jr, who pointed out this outlook, says,
“In the absence of negative macroeconomic or market catalysts, the current week holds potential for moderate growth.”

In conclusion, the two positive weekly closes, coupled with increasing global liquidity and declining taker volume, hint at a bullish Bitcoin price prediction. Let’s explore key BTC levels to watch for when this scenario unfolds.
Key BTC Price Levels to Watch as $1.5B Positions At Risk of Liquidation
Liquidation map data from CoinGlass shows that $87,813 is critical; a BTC price breakout above this could liquidate $640 million worth of short positions. On the contrary, a breakdown below $85,633 will liquidate $942 million in long positions
In total, a spike in Bitcoin price below $85,633 followed by a continuation of the uptrend toward $90K could result in a liquidation event earily worth more than $1.5 billion.

Conclusion
The combination of the Global Liquidity Index’s Z score flashing a buy signal, declining net Taker Volume, and positive weekly closes suggests that Bitcoin price is set for an explosive growth in the near future.
Akash Girimath
Senior Cryptocurrency Analyst & Market Strategist
Engineer-turned-analyst Akash Girimath delivers data-driven insights on cryptocurrency markets, DeFi, and blockchain technology for platforms like AMBCrypto and FXStreet. Specializing in technical analysis, on-chain analytics, and risk management, he empowers institutional investors and retail traders to navigate market volatility and regulatory shifts.
A hands-on strategist, Akash merges active crypto portfolio management with research on Web3, NFTs, and tokenomics. At AMBCrypto, he led cross-functional teams to redesign content frameworks, achieving record-breaking traffic growth through scalable editorial strategies. His analyses dissect market sentiment, investment strategies, and price predictions, blending macroeconomic trends with real-world trading expertise.
Known for mentoring analysts and optimizing workflows for high-impact reporting, Akash’s work is cited across global crypto publications, reaching 500k+ monthly readers. Follow his insights on YouTube, X, and LinkedIn for cutting-edge perspectives on decentralized ecosystems and crypto innovation.
Disclaimer: The presented content may include the personal opinion of the author and is subject to market condition. Do your market research before investing in cryptocurrencies. The author or the publication does not hold any responsibility for your personal financial loss.
Source link


Reason to trust
![]()
Strict editorial policy that focuses on accuracy, relevance, and impartiality
Created by industry experts and meticulously reviewed
The highest standards in reporting and publishing
Strict editorial policy that focuses on accuracy, relevance, and impartiality
Morbi pretium leo et nisl aliquam mollis. Quisque arcu lorem, ultricies quis pellentesque nec, ullamcorper eu odio.
It was quite the coincidence that the cryptocurrency market jolted back to life after Easter Sunday, with Bitcoin leading the way with more than a double-digit gain. While the price of BTC continues to hold above the critical $94,000 level, the premier cryptocurrency seems to be losing some momentum.
Unsurprisingly, investors appear to be increasingly confident in the promise of this recent rally, as significant amounts of BTC continue to make their way off major centralized exchanges over the past few days. Here’s how much investors have moved in the past few days.
Over 35,000 BTC Move Out Of Coinbase And Binance
In a Quicktake post on the CryptoQuant platform, crypto analyst João Wedson revealed that Binance, the world’s largest cryptocurrency exchange by trading volume, has seen increased activity over the past few days. The exchange netflow data shows that huge amounts of Bitcoin have been withdrawn from the platform in recent days.
Related Reading
According to CryptoQuant data, a total of 27,750 BTC (worth $2.63 billion at current price) was moved out of Binance on Friday, April 25. This latest round of withdrawals represents the third-largest net outflow in the centralized exchange’s history.
The movement of significant crypto amounts from exchanges, which offer services like selling to non-custodial wallets, suggests a potential shift in investor sentiment and strategy. Large exchange outflows often signal increased confidence of holders in the long-term potential of an asset.
Wedson noted that the recent outflows do not guarantee a price rally for Bitcoin, but they do signal strong institutional activity, which is often a precursor for major volatility. Citing China’s crypto ban in 2021, the crypto analyst highlighted how massive exchange outflows didn’t prevent the dump.

At the same time, Wedson mentioned that the continuous Bitcoin outflows over several days, like during the FTX collapse, preceded a price bottom and the eventual market recovery. Ultimately, the online pundit hinted at paying close attention to the overall trend of the exchange netflow rather than a single-day activity.
Similarly, more than 7,000 BTC (worth approximately $66.5 million) have made their way out of the Coinbase exchange. According to the CryptoQuant analyst Amr Taha, this negative exchange netflow could be an indicator of increased institutional activity, as Coinbase is known as the primary crypto vendor for US-based institutions.
Taha said:
These large outflows typically suggest accumulation by institutions or large investors, potentially signaling bullish sentiment.
The analyst outlined that if the dwindling exchange reserves correlate with an increased spot demand or ETF inflows, a supply squeeze could be on the horizon, potentially pushing the price to the upside.
Bitcoin Price At A Glance
As of this writing, the price of BTC sits just beneath $95,200, reflecting an almost 2% increase in the past 24 hours.
Related Reading
Featured image from iStock, chart from TradingView
Source link

Reason to trust
![]()
Strict editorial policy that focuses on accuracy, relevance, and impartiality
Created by industry experts and meticulously reviewed
The highest standards in reporting and publishing
Strict editorial policy that focuses on accuracy, relevance, and impartiality
Morbi pretium leo et nisl aliquam mollis. Quisque arcu lorem, ultricies quis pellentesque nec, ullamcorper eu odio.
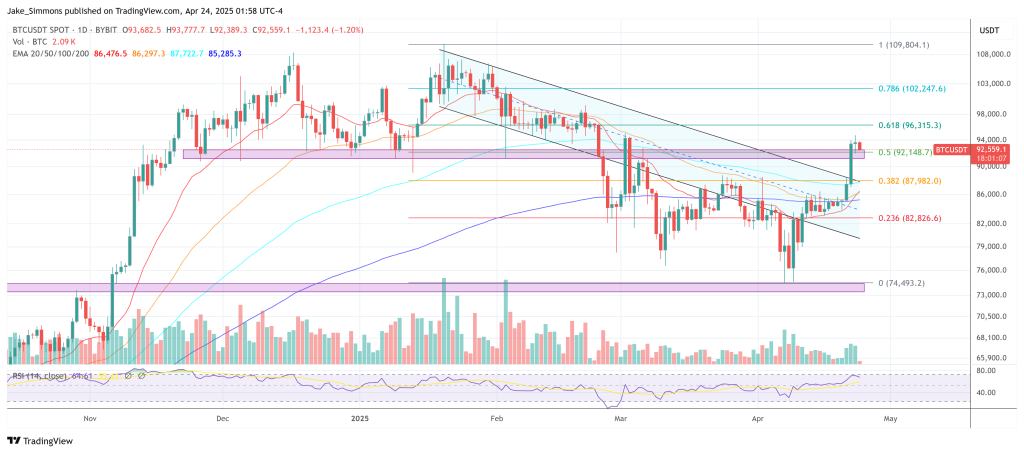
Crypto analyst Rekt Capital has revealed that the Bitcoin price recovery could be at stake if it doesn’t hold above a particular level. Failure to hold this support level could cause the leading crypto to crash and erase all gains that it has enjoyed this past week.
Bitcoin Price Needs To Hold Above $93,500 To Avoid Another Crash
In an X post, Rekt Capital indicated that the Bitcoin price needs to hold above $93,500 to avoid another crash. He remarked that the downside deviation is on the cusp of ending, but BTC now needs to stabilize above this support level of $93,500. The analyst added that ideally, the leading crypto needs a weekly close above this level and reclaim it as new support to resynchronize with the former Reaccumulation range.
Related Reading
The Bitcoin price has already rallied above $93,500 this week as the leading crypto decoupled from stocks, with investors viewing it as a safe haven amid the market uncertainty caused by Donald Trump’s tariffs. However, as Rekt Capital suggested, BTC now needs to hold above $93,500 to confirm this breakout and avoid this being another bull trap.

The Bitcoin price is likely to reclaim the $100,000 mark and even reach new highs if it can hold above this crucial support level. Rekt Capital’s accompanying chart showed that BTC could rally to as high as $110,000, marking a new all-time high (ATH) for the leading crypto.
Crypto analyst Ezy Bitcoin also predicted that the Bitcoin price could rally to as high as $166,700. He stated that the Wyckoff Re-accumulation phase is playing out beautifully. The analyst further remarked that the structure points toward continued strength with the spring confirmed and price jumping across the creek. Ezy Bitcoin outlined $131,500, $144,900, and $166,700 as the targets if this bullish momentum holds.
BTC Needs One More Leg On The LTF To Confirm Breakout
In an X post, crypto analyst CrediBULL Crypto stated that the Bitcoin price needs one more leg on the lower timeframes (LTFs) to seal the deal. If that happens, he asserted that dips are for buying until BTC reaches at least $150,000. His accompanying chart showed that the leading crypto could break above $100,000 again on this next leg up.
Related Reading
However, if the Bitcoin price doesn’t record another leg to the upside and instead corrects below $89,000 first, CrediBULL stated that BTC then ends up with a 3-legged corrective structure. He added that it would mean that market participants have to wait longer for the “real” breakout.
At the time of writing, the Bitcoin price is trading at around $92,600, down in the last 24 hours, according to data from CoinMarketCap.
Featured image from Adobe Stock, chart from Tradingview.com
Source link

Reason to trust
![]()
Strict editorial policy that focuses on accuracy, relevance, and impartiality
Created by industry experts and meticulously reviewed
The highest standards in reporting and publishing
Strict editorial policy that focuses on accuracy, relevance, and impartiality
Morbi pretium leo et nisl aliquam mollis. Quisque arcu lorem, ultricies quis pellentesque nec, ullamcorper eu odio.
Arthur Hayes, the co-founder of BitMEX who now runs the family-office-style fund Maelstrom, believes the macro cocktail that ignited Bitcoin’s six-fold advance from late 2022 into early 2025 is being mixed again. Speaking on the “Forward Guidance” podcast just minutes after a market-soothing Trump press conference, Hayes said the present environment “feels like November 2022.”
Can Bitcoin Increase Sixfold Again?
In Hayes’s telling, the fulcrum of the next impulse is not the Federal Reserve but the US Treasury. “People forgot about the other side of the equation,” he argued. “Yellen printed two-and-a-half trillion dollars just by switching issuance to bills, and now Scott Bessent is talking about Treasury buybacks—another form of stealth quantitative easing that needs no input from the Fed.” Hayes cited his own arithmetic from the previous episode: between September 2022 and early 2025, Bitcoin rose roughly 6x while the Fed’s balance sheet was ostensibly shrinking, a move he attributes almost entirely to Treasury-engineered liquidity.
Related Reading
That dynamic, he contends, has returned. The Trump administration’s initial “maximalist” tariff schedule, announced in mid-April and aimed at slashing the US current-account deficit, triggered a brief but violent sell-off in bonds and equities before Trump began “concession after concession.” The rapid policy retreat, Hayes said, confirms that “the American financial system is so highly levered it couldn’t take one week” of trade hardball. To him, that single week exposed the political impossibility of fiscal retrenchment and made additional money creation inevitable. “They can call it whatever they want—just don’t call it QE—but it has the same effect: liquidity rises and Bitcoin benefits.”
Hayes’s decoupling thesis rests on arithmetic as much as narrative. If tariffs do trim the current-account gap, the mirror-image financial-account surplus must also fall, reducing foreign demand for US mega cap stocks.
“Mathematically, if Trump is serious, foreigners have to sell stocks. Period,” he said. In that world, Bitcoin’s flows are driven not by equity beta but by a global scramble for neutral stores of value amid escalating currency and trade friction. He expects “US-tech exceptionalism” to fade just as Bitcoin’s structural bid strengthens.
Related Reading
The former BitMEX chief also sees a latent tail-risk in Japan. A stronger yen, encouraged by Washington to help weaken the dollar, could force Japanese investors to unwind enormous USD carry trades, dumping Treasuries and pushing yields toward levels that would “corner the Fed into covert curve control.”
Any volatility spike of that kind, Hayes noted, historically elicits a rapid-fire response from the Federal Reserve—even if it arrives cloaked as a new alphabet facility rather than outright bond-buying. “Every time bond-market volatility spikes, the Fed does something,” he remarked. “It might not be QE in the traditional form, but it leads to the same outcome.”
Throughout the hour-long conversation Hayes returned to November 2022 as the template. Back then, markets were reeling from the aftermath of FTX and bond yields were surging, yet Bitcoin began a relentless grind upward as the Treasury tapped the reverse-repo basin for fresh cash. Today, he sees an echo: “This feels like November 2022,” he told host Felix Jauvin. “Shit’s going up.”
While Hayes stopped short of naming a price target, the implication was clear. In 2022–25 the stealth-liquidity wave took Bitcoin from roughly $16,000 to above $100,000. With Besson’s buyback machinery “ready to go” and political appetite for austerity already exhausted, Hayes says the stage is set for a sequel.
At press time, BTC traded at $92,559.
Featured image created with DALL.E, chart from TradingView.com
Source link

Monero’s XMR Rockets 40% as XRP Leads Crypto Majors Gains

The 5 top crypto loan platforms of 2025

XRP Price Shows Strength — Breakout Above Key Levels Possible?

Expert Reveals Why The Ethereum-To-Bitcoin Ratio Is Falling

Analyst Says Solana-Based Memecoin Going Much Higher, Sees PENGU Facing ‘True Test’ After April Surge

Nike sued for $5 million over its shutdown of NFT platform RTFKT

Biological Age vs. Chronological Age: Redefining Age in the Digital Era

TRUMP whale regrets sale, pays double to buy back meme coins

Stripe Tests New Stablecoin Project as $3.7T Market Looms

Falling Wedge Pattern Confirms $264 target
Dogecoin Confirms Daily Trend Reversal With Breakout, Retest, And New Uptrend

Ethereum community members propose new fee structure for the app layer

Crypto Investors Sue Nike, Accuse Apparel Giant of Rug Pull After Abrupt Closure of Metaverse Business: Report

Top cryptocurrencies to watch: Pi Network, XRP, Sui

This Week in Crypto Games: Ubisoft’s ‘Might & Magic’, ‘Peaky Blinders’ in Development


 24/7 Cryptocurrency News6 months ago
Arthur Hayes, Murad’s Prediction For Meme Coins, AI & DeFi Coins For 2025

 Bitcoin3 months ago
Expert Sees Bitcoin Dipping To $50K While Bullish Signs Persist

 Ripple Price1 month ago
3 Voting Polls Show Why Ripple’s XRP Price Could Hit $10 Soon

 24/7 Cryptocurrency News4 months ago
Aptos Leverages Chainlink To Enhance Scalability and Data Access

 Bitcoin6 months ago
Bitcoin Could Rally to $80,000 on the Eve of US Elections

 Opinion6 months ago
Crypto’s Big Trump Gamble Is Risky

 Bitcoin5 months ago
Institutional Investors Go All In on Crypto as 57% Plan to Boost Allocations as Bull Run Heats Up, Sygnum Survey Reveals

 Bitcoin3 months ago
The Future of Bitcoin: Scaling, Institutional Adoption, and Strategic Reserves with Rich Rines

✓ Share: