Markets
Bitcoin Price Stabilizes as Analysts Flag an Accumulation Period
Published
3 months agoon
By
admin

In a nuanced shift in cryptocurrency markets, Bitcoin (BTC) appears to be entering a stabilization phase with indicators suggesting traders are moving into an accumulation period.
Analysts are noting the tepidly good news despite price fluctuations that have seen the leading cryptocurrency trading at $66,300, down 0.7%, but maintaining a 7% gain over the past two weeks.
Ethereum, meanwhile, is down 2% at $2,570, though it too has seen a rise of 5.5% over the last two weeks, according to data from CoinGecko.
Market analysts point to several key factors supporting this stabilization thesis. The $1.7 billion reduction in Circle’s USDC has been more than offset by significant liquidity indicators, including substantial stablecoin inflows totaling $38 billion this year—notably surpassing the $21 billion that has flowed into Bitcoin Spot ETFs.
According to 10x Research, the market is absorbing a number of factors before potentially resuming an upward trajectory. “Instead of turning overly pessimistic, we believe the market needs time to digest the higher bond yields before Bitcoin can resume its upward movement,” said 10x Research in a note to Decrypt.
They emphasized that while funding rates for Bitcoin and Ethereum have risen to 10%, spot prices have lagged, and retail participation remains subdued. “We’d like to see multiple indicators aligning to confirm bullish momentum, but this isn’t a significant concern. The market likely just needs a few days to absorb these factors.”
Adding to this, total stablecoin inflows have been a key driver of liquidity this year. “With $36 billion in stablecoin inflows since the Bitcoin Spot ETF launch, liquidity remains robust,” noted 10x Research, highlighting that these inflows continue to provide upward pressure on Bitcoin’s price.
Valentin Fournier, an analyst at BRN, also pointed to institutional activity as a key indicator.
“After a streak of seven consecutive days of ETF inflows totaling over $2 billion, Bitcoin’s ETF inflows have taken a temporary pause,” Fournier explained. “While this indicates a minor dip in institutional demand, we’re still seeing accumulation at the current price level, which suggests a potential uptrend once the market consolidates.”
Fournier also noted that while Bitcoin has retreated to $67,000 after being rejected at the $70,000 resistance level, this softer rejection suggests traders are accumulating in preparation for a bullish breakout. “The upcoming U.S. presidential election, potential interest rate cuts, and global stimulus efforts could drive cryptocurrencies to new highs in the weeks ahead,” he added.
However, Alex Kuptsikevich, senior market analyst at FxPro, urged caution as Bitcoin hovers near a key support level. “Bitcoin is close to a local support level at $66,800. A break below this support could open the way for a deeper correction toward $65,500,” Kuptsikevich said.
Despite the recent pullback, he emphasized Bitcoin’s dominance in the market, noting that BTC’s share of cryptocurrency market capitalization has risen to 57.3%, the highest since April 2021.
Daily Debrief Newsletter
Start every day with the top news stories right now, plus original features, a podcast, videos and more.
Source link
You may like


Why This AI Agent Crypto AIXBT is Up 55% Today?


Have Bitcoin ETFs Lived Up to the Hype?


Apostas basquete Brasil


SAFE rallies 20% on Bithumb listing


Solana, XRP, Litecoin, HBAR in 2025 With New SEC Chair?


Bitcoin Supercycle Incoming Amid Changing Market Conditions, According to Alex Krüger – But There’s a Catch

The launch of Bitcoin ETFs in January 2024 was heralded as a groundbreaking moment for the market. Many expected these products to open the floodgates for institutional capital and catapult Bitcoin prices to new heights. But now, a year later, have Bitcoin ETFs delivered on their promise?
For a more in-depth look into this topic, check out a recent YouTube video here: Have Bitcoin ETFs Lived Up to Expectations?
A Strong Start
Since their launch, Bitcoin ETFs have accumulated over 1 million BTC, equivalent to approximately $40 billion in assets under management. Even when accounting for outflows from competing products like the Grayscale Bitcoin Trust (GBTC), which saw withdrawals of over 400,000 BTC, the net inflows remain significant at about 540,000 BTC.
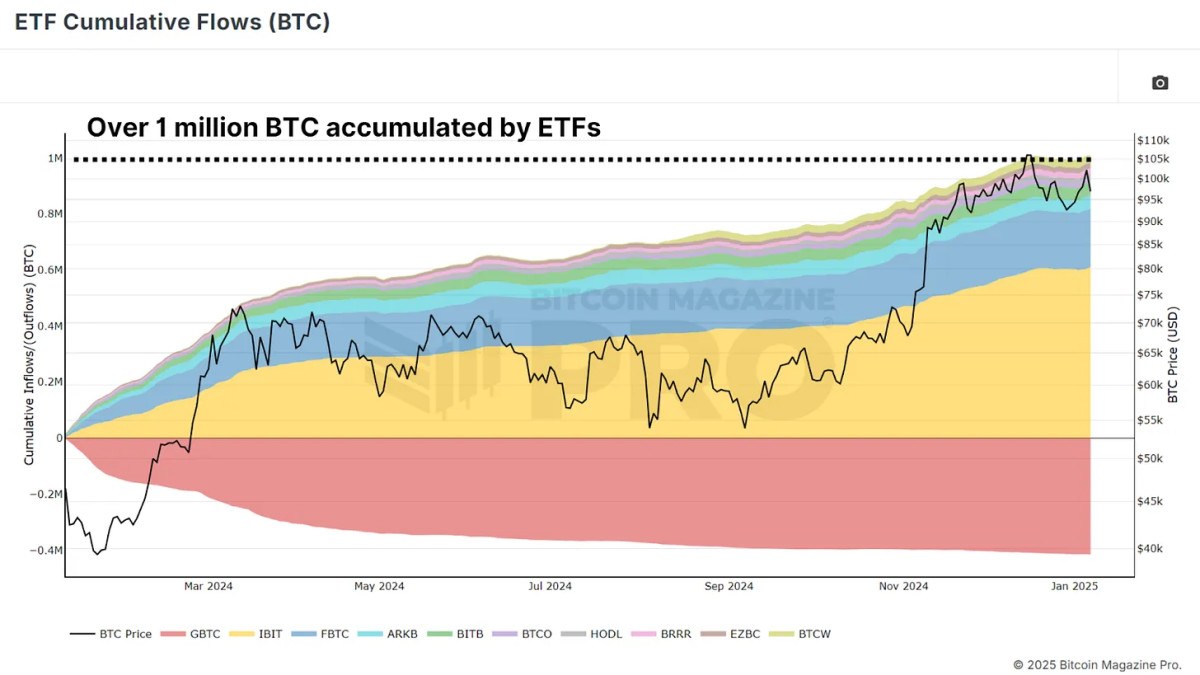
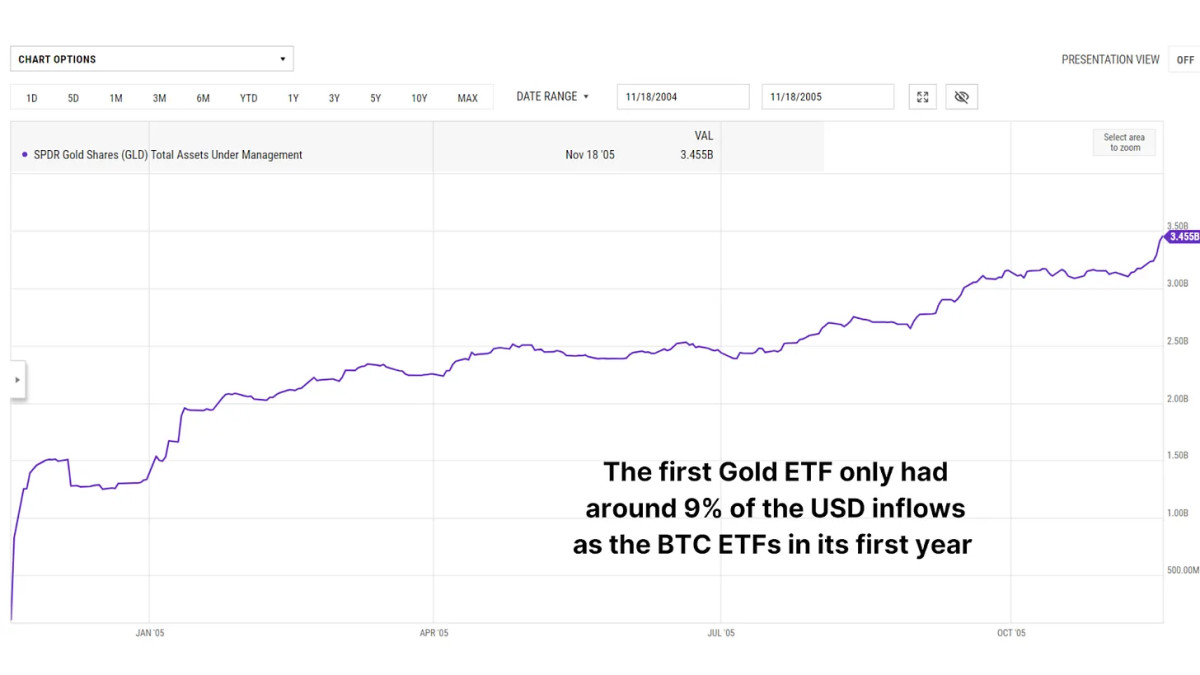
To put this into perspective, the scale of inflows far exceeds what we witnessed during the launch of the first gold ETFs in 2004. Gold ETFs garnered $3.45 billion in their first year, a fraction of Bitcoin ETFs’ $37.5 billion in inflows over the same period. This highlights the intense institutional interest in Bitcoin as a financial asset.
Bitcoin’s Year of Growth
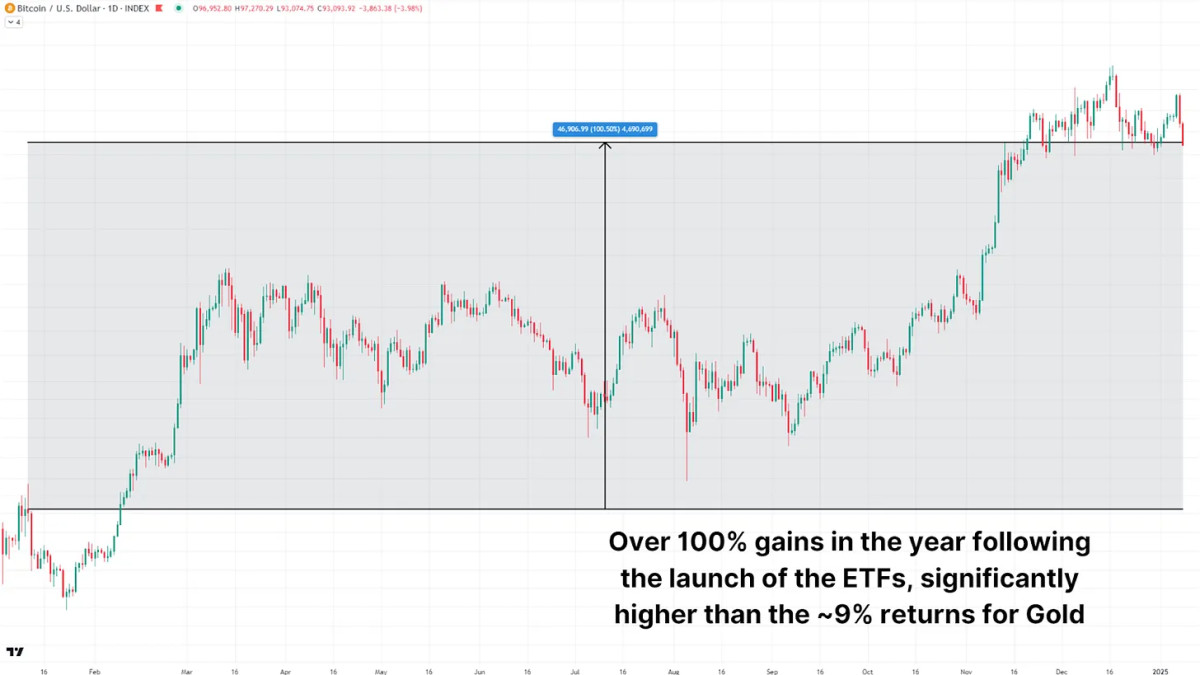
Following the launch of Bitcoin ETFs, initial price movements were underwhelming, with Bitcoin briefly declining by nearly 20% in a “buy the rumor, sell the news” scenario. However, this bearish trend quickly reversed. Over the past year, Bitcoin prices have risen by approximately 120%, reaching new heights. For comparison, the first year following the launch of gold ETFs saw a modest 9% price increase for gold.
Following the Gold Fractal
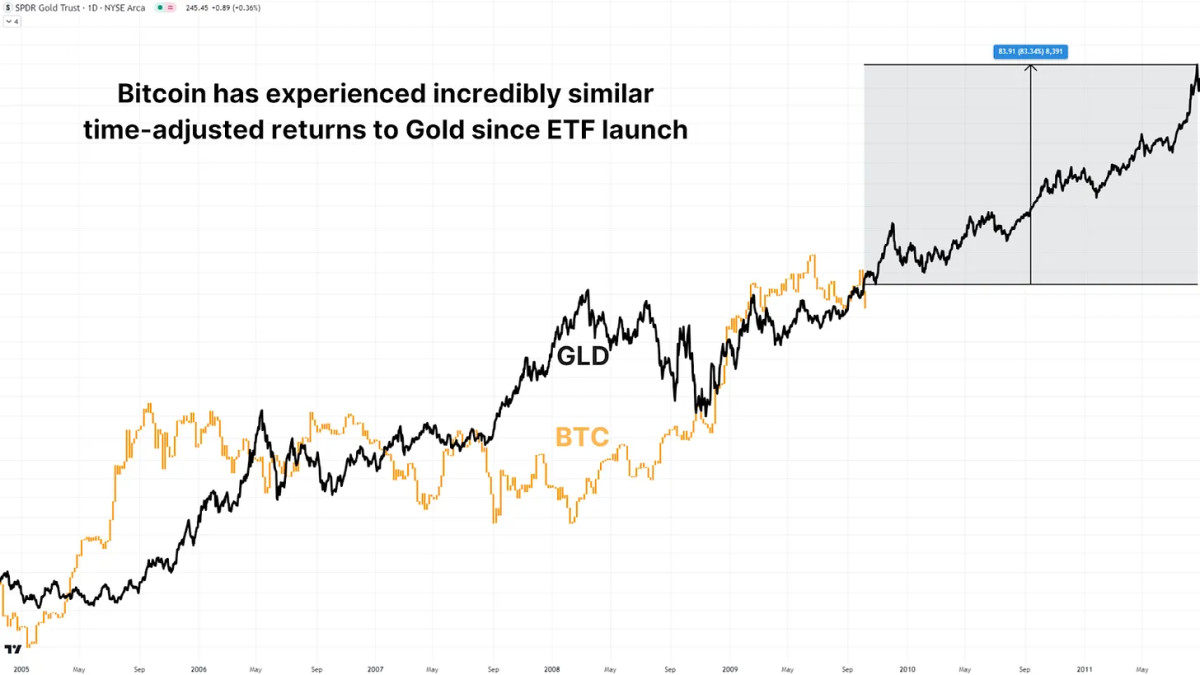
When accounting for Bitcoin’s 24/7 trading schedule, which results in roughly 5.3 times more yearly trading hours than gold, a striking similarity emerges. By overlaying Bitcoin’s first year of ETF price action with gold’s historical data (adjusted for trading hours), we can see almost the same % returns. If Bitcoin continues to follow gold’s pattern, we could see an additional 83% price increase by mid-2025, potentially pushing Bitcoin’s price to around $188,000.
Institutional Strategy
One intriguing insight from Bitcoin ETFs has been the relationship between fund inflows and price movements. A simple strategy of buying Bitcoin on days with positive ETF inflows and selling on days with outflows has consistently outperformed a traditional buy-and-hold approach. From January 2024 to today, this strategy has returned 130%, compared to ~100% for a buy-and-hold investor, an outperformance of nearly 10%.
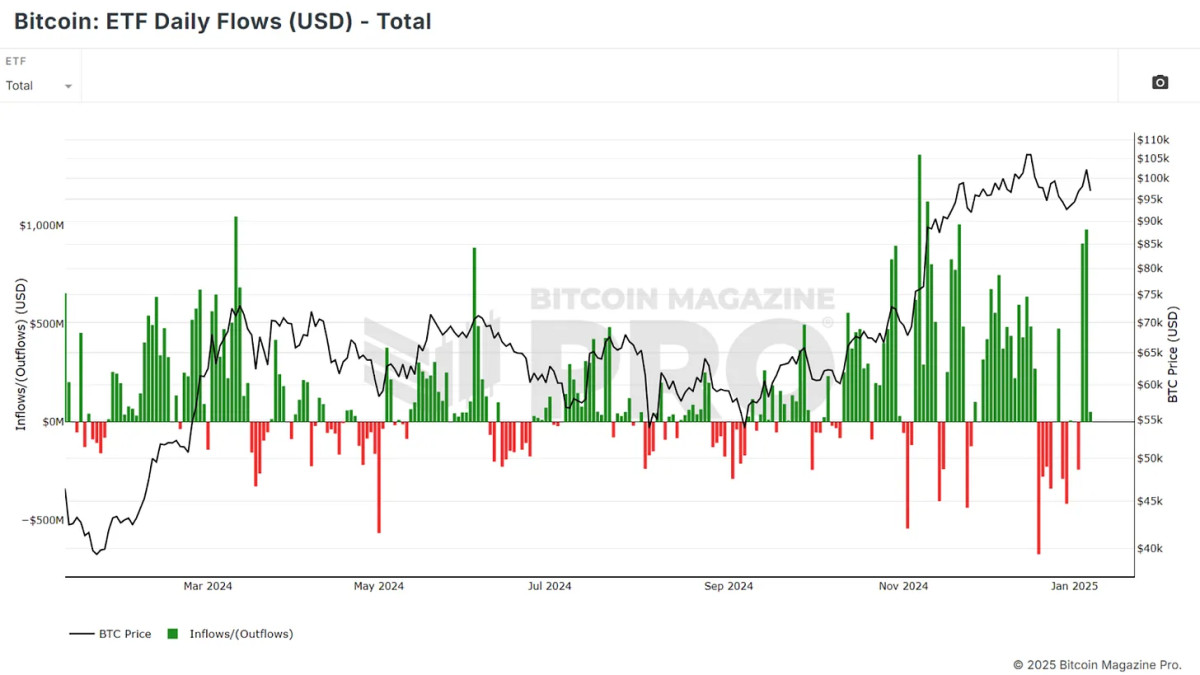
For more information on this institutional inflow strategy, watch the following video:
Using ETF Data to Outperform Bitcoin [Must Watch]
Supply and Demand Dynamics
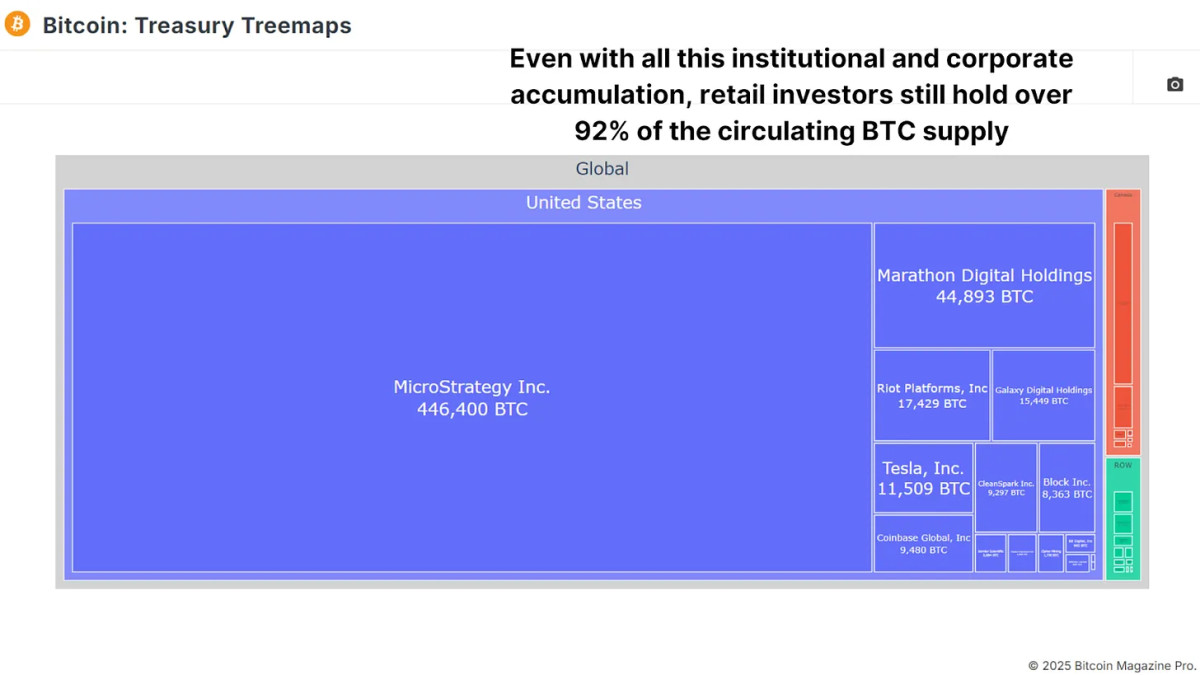
While Bitcoin ETFs have accumulated over 1 million BTC, this represents only a small fraction of Bitcoin’s total circulating supply of 19.8 million BTC. Corporations like MicroStrategy have also contributed to institutional adoption, collectively holding hundreds of thousands of BTC. Yet, the majority of Bitcoin remains in the hands of individual investors, ensuring that market dynamics are still driven by decentralized supply and demand.
Conclusion
One year in, Bitcoin ETFs have exceeded expectations. With billions in inflows, a significant impact on price appreciation, and increasing institutional adoption, they have solidified their role as a key driver of Bitcoin’s market narrative. While some early skeptics were disappointed by the lack of immediate explosive price action, the long-term outlook remains highly bullish.
The comparisons to gold ETFs provide a compelling roadmap for Bitcoin’s future. If the gold fractal holds true, we could be on the cusp of another major rally. Coupled with favorable macroeconomic conditions and growing institutional interest, Bitcoin’s future looks brighter than ever.
Explore live data, charts, indicators, and in-depth research to stay ahead of Bitcoin’s price action at Bitcoin Magazine Pro.
Disclaimer: This article is for informational purposes only and should not be considered financial advice. Always do your own research before making any investment decisions.
Source link


Is the EU’s MiCA framework forcing investors to rethink their allegiance to Tether’s USDT and explore alternatives like Circle’s USDC and Ripple’s RLUSD?
USDT under radar
For years, Tether’s USDT (USDT) has been the go-to stablecoin for traders and investors. Yet, as we step into 2025, its dominance is starting to waver, particularly in the European Union, where mounting regulatory scrutiny and growing competition are challenging its unshakable reputation.
The turning point came on December 30, 2024, with the full implementation of the European Union’s Markets in Crypto-Assets regulations.
Designed to bring order to the unpredictable crypto market, MiCA has imposed stringent compliance requirements on stablecoin issuers, including a mandate for major players like Tether to hold 60% of their reserves in EU banks.
As these regulations take effect, Tether is grappling with a wave of redemptions, new regulatory hurdles, and intensifying competition from rivals like Circle’s USDC (USDC) and Ripple’s RLUSD (RLUSD).
In the past, Tether’s CEO, Paolo Ardoino, raised concerns over the risks of “bank failures,” arguing that such requirements could expose stablecoin issuers to systemic vulnerabilities rather than reducing them.
Just to correct the statement: we’re still discussing with the regulator about our concerns that I expressed in our interview, that would pose severe risks to stablecoins regulated in EU.
Uninsured cash deposits are not a good idea.
We should learn from what happened with…
— Paolo Ardoino 🤖🍐 (@paoloardoino) April 11, 2024
But the market seems less concerned with Tether’s reasoning and more with its actions — or lack thereof.
In the days leading up to MiCA’s implementation, nearly $4 billion worth of USDT was redeemed, marking the largest outflow since the 2022 crypto winter.
Back then, scandals like the collapse of FTX and revelations of fraud across the industry sent shockwaves through crypto, shrinking USDT’s market cap from $83 billion in May to $65 billion by November — a 21% drop.
The recent decline, while smaller, carries deeper implications. As of Jan. 9, Tether’s market cap stands at $137.5 billion, down from $141 billion just two weeks earlier.
The question now is not just whether Tether can adapt but whether the market will wait for it to do so. With USDC cementing its regulatory foothold and RLUSD rapidly gaining momentum, could this be the beginning of a sharp decline for the world’s largest stablecoin? Let’s try to decode.
Competitors closing In: USDC and RLUSD’s strategic advances
Tether’s reluctance to comply with its strict reserve requirements has raised red flags among investors, while its competitors are thriving under the new framework.
Even though EU member states have up to 18 months to fully enforce MiCA, the market isn’t waiting. Investors and exchanges are already repositioning, and USDT’s grip on the market appears to be slipping.
For context, exchanges like Coinbase and OKX have already delisted USDT for European users, citing non-compliance with MiCA.
Circle’s USDC stands out as a prime beneficiary of the regulatory shift. Having secured MiCA approval in mid-2024, USDC has positioned itself as the stablecoin of choice for exchanges looking to align with EU rules.
Binance’s partnership with Circle, aimed at accelerating USDC adoption globally, is a direct response to growing demand for transparency and compliance. This move has already begun to pay off; USDC’s market cap has grown by $2 billion since securing the license.
Meanwhile, Ripple’s RLUSD, launched on December 17, 2024, is also gaining traction as a regulatory-compliant alternative.
Designed to operate seamlessly on the XRP Ledger (XRP) and Ethereum (ETH), RLUSD processed 33,953 transactions on the XRP Ledger and 1,690 on Ethereum during its testing phase alone.
Ripple’s big Moment as RLUSD gains momentum in a changing era
The year 2025 could be a turning point for Ripple, as a convergence of legal victories, strategic partnerships, and a crypto-friendly administration in the U.S. creates ideal conditions for expanding its foothold in the stablecoin market.
With Donald Trump’s presidency expected to usher in crypto-friendly policies, Ripple may finally resolve its long-standing legal battle with the Securities and Exchange Commission, lifting a major obstacle to its growth.
Already, Ripple has scored key wins in the SEC case, including reducing a potential $2 billion penalty to just $125 million. This resolution provides the company with the breathing room needed to refocus on innovation and the rollout of RLUSD.
Monica Long, Ripple’s president, has hinted at ambitious plans for RLUSD, including imminent listings on major exchanges to broaden its reach and utility.
“We are continuing to expand distribution and availability of Ripple dollars on other exchanges. So, I think you can expect to see more availability, more announcements coming soon,” Long shared in a recent Bloomberg interview.
Ripple’s well-established payments business is also a crucial driver for RLUSD’s adoption. Over the past year, Ripple’s payment solutions have doubled their transaction volume, reflecting their value in facilitating seamless cross-border transactions.
Stablecoins like RLUSD could enhance this ecosystem by offering businesses an efficient alternative to traditional banking systems.
As Ripple expands RLUSD’s availability, businesses already relying on its payment solutions could likely adopt the stablecoin, further accelerating its growth.
Beyond payments, partnership with Chainlink, a leader in blockchain oracles, could propel it into the decentralized finance space.
Chainlink’s infrastructure, which has supported over $18 trillion in transaction value, positions RLUSD to integrate effectively with DeFi ecosystems, offering new opportunities for both traditional and DeFi users.
The stablecoin market, now valued at $206.2 billion, continues to remain dominated by USDT, which holds 66% of the market share.
What to expect next?
USDT’s struggles have been years in the making, marked by its unmatched dominance but shadowed by persistent questions about transparency.
While Tether has consistently maintained its peg to the U.S. dollar, its reluctance to provide full-scale audits and ongoing accusations of under-collateralization have fueled mistrust.
Amid this, USDC has positioned itself as the “safe” alternative, building its reputation on monthly attestations and a compliance-first approach. Its recent approval under Europe’s MiCA regulations has further strengthened its foothold in the region.
Meanwhile, Ripple’s RLUSD, though a newer entrant, is also gaining traction with Ripple’s strong payment infrastructure, rapid exchange listings, and seamless integration into DeFi markets.
As MiCA sets a clear regulatory benchmark in the EU, the U.S. would soon follow suit. Signals from the Trump administration suggest an acceleration of crypto-friendly policies, likely pushing the U.S. toward an accountable regulatory framework.
With these shifts, 2025 may mark the beginning of a power transition in the stablecoin market. While USDT remains the leader, for now, the momentum of its competitors signals that change is upcoming.
Disclosure: This article does not represent investment advice. The content and materials featured on this page are for educational purposes only.
Source link
Markets
MicroStrategy Continues Weekly Bitcoin Buying Spree With Another $101 Million
Published
4 days agoon
January 6, 2025By
admin

Software company MicroStrategy is pushing forward with its Bitcoin buying spree in 2025, today snapping up more than $100 million worth of the orange coin.
An SEC filing and Monday announcement from the company’s co-founder and Bitcoin bull Michael Saylor showed that MicroStrategy spent $101 million buying 1,070 BTC at an average price of $94,004. That’s roughly half the amount of Bitcoin the company bought last week, consistent with the weekly buying trend that MicroStrategy started in November following the reelection of Donald Trump.
MicroStrategy now holds 447,470 Bitcoin in total. At today’s Bitcoin price of $101,832, that’s a stash worth over $45.5 billion. All told, the company bought their coins at an average price of $62,503, the announcement said.
MicroStrategy has acquired 1,070 BTC for ~$101 million at ~$94,004 per bitcoin and has achieved BTC Yield of 48.0% in Q4 2024 and 74.3% in FY 2024. As of 01/05/2025, we hodl 447,470 $BTC acquired for ~$27.97 billion at ~$62,503 per bitcoin. $MSTR https://t.co/CkLrLSkB5M
— Michael Saylor⚡️ (@saylor) January 6, 2025
Prediction markets last week were bullish that MicroStrategy would buy more Bitcoin today—and understandably so, given that that today’s purchase makes nine consecutively weekly buys for Saylor’s company.
On Myriad—a points-based prediction market and engagement platform developed by Dastan, parent company of an editorially independent Decrypt—users saw an 86% chance that MicroStrategy would hold at least 450,000 BTC before the end of this week. Those odds, though, have now tanked to just 20% as of this writing following the company’s announcement of a much smaller purchase relative to previous weeks.
On the Monday following Trump’s win, MicroStrategy announced it bought more than $2 billion worth of Bitcoin. It then followed up the next week with another $4.6 billion, and then again with its single largest purchase yet of $5.4 billion the week after that.
The company has continued buying more Bitcoin every week since, but the individual amounts have gradually decreased in recent weeks as the price of Bitcoin has swelled. Users on Polymarket, a prediction market co-founded by Shayne Coplan in 2020, currently see only a 2% chance that MicroSrategy holds more than 500,000 BTC by Trump’s inauguration on January 20.
MicroStrategy was previously a software company that sold data-analyzing solutions to companies. It still does that, but Saylor has since rebranded the firm as a Bitcoin development company, leading with its Bitcoin treasury.
It all started in 2020, when covid lockdowns and record low interest rates threatened to hurt the company’s shareholders, according to Saylor. He decided to buy Bitcoin and has since argued that the asset—being scarce—is the best way to preserve wealth.
Now, MicroStrategy makes most of its money by securitizing the biggest cryptocurrency by market cap: investors wanting exposure to Bitcoin can buy shares of the company that trade on the Nasdaq—an arguably safer, more regulated way of crypto investing.
It is now the biggest publicly traded holder of the cryptocurrency and issues debt to buy Bitcoin—making a killing for investors in the process: MicroStrategy stock is up over 500% year-to-date.
But concerns have been raised about how viable this is if the price of Bitcoin were to tank: the company is highly leveraged and some analysts now believe the stock price may be overvalued.
Edited by Stacy Elliott.
Daily Debrief Newsletter
Start every day with the top news stories right now, plus original features, a podcast, videos and more.
Source link
Why This AI Agent Crypto AIXBT is Up 55% Today?
Have Bitcoin ETFs Lived Up to the Hype?
Apostas basquete Brasil
SAFE rallies 20% on Bithumb listing
Solana, XRP, Litecoin, HBAR in 2025 With New SEC Chair?
Bitcoin Supercycle Incoming Amid Changing Market Conditions, According to Alex Krüger – But There’s a Catch
K-pop giant Cube Entertainment’s CEO under fire for misleading crypto investment guarantees
How a Crypto Trader Turned a 90% Loss Into a $2.5M Win?
Solana whales rapidly accumulate this viral altcoin dubbed the ‘next XRP’
Polymarket’s Customer Data Sought by U.S. CFTC Subpoena of Coinbase, Source Says
BTC, ETH, XRP & Top Altcoins Bleed Ahead Of Key Jobs Data
Vitalik Buterin warns of AI risks while highlighting new opportunities
Senate Banking Committee Advances Plans for Crypto Subcommittee Vote
Bitcoin Not Reached ‘Extreme Euphoria’ Phase Yet, Glassnode Reveals
Is USDT Losing to RLUSD and USDC?

Ethereum’s lowered yield might signal a paradigmatic shift in the ecosystem

Telegram users can send gifts to friends, TON fails to pump

Bitcoin Could Rally to $80,000 on the Eve of US Elections

Institutional Investors Go All In on Crypto as 57% Plan to Boost Allocations as Bull Run Heats Up, Sygnum Survey Reveals

Arthur Hayes, Murad’s Prediction For Meme Coins, AI & DeFi Coins For 2025

Crypto’s Big Trump Gamble Is Risky

A Kamala Presidency Could Be Just as Bullish for Bitcoin

Ripple-SEC Case Ends, But These 3 Rivals Could Jump 500x

SEC filing underway, Bitcoin rewards app Fold adopts FLD ticker

Cardano and the XRP price action lock in bulls vs bears battle as RCO Finance prepares for 3,000% surge

A16z-backed Espresso announces mainnet launch of core product

Tether CEO Paolo Ardoino Denies Rumors That Stablecoin Issuer Is Under Federal Investigation

Crypto Exchange OKX Moves To Support USDC Ecosystem by Adding Six New Trading Pairs

Trump’s Coin Is About As Revolutionary As OneCoin

Ripple Vs. SEC, Shiba Inu, US Elections Steal Spotlight
Trending

 DeFi3 months ago
Ethereum’s lowered yield might signal a paradigmatic shift in the ecosystem

 News3 months ago
Telegram users can send gifts to friends, TON fails to pump

 Bitcoin2 months ago
Bitcoin Could Rally to $80,000 on the Eve of US Elections

 Bitcoin2 months ago
Institutional Investors Go All In on Crypto as 57% Plan to Boost Allocations as Bull Run Heats Up, Sygnum Survey Reveals

 24/7 Cryptocurrency News2 months ago
Arthur Hayes, Murad’s Prediction For Meme Coins, AI & DeFi Coins For 2025

 Opinion2 months ago
Crypto’s Big Trump Gamble Is Risky

 Opinion3 months ago
A Kamala Presidency Could Be Just as Bullish for Bitcoin

 Price analysis2 months ago
Ripple-SEC Case Ends, But These 3 Rivals Could Jump 500x


