
Ali Martinez
Bitcoin Price To $140,000 Or $67,000? Analyst Weighs In On Interesting BTC Setup

After an unexpected bearish plot twist in the past week, the Bitcoin price action has been pretty quiet over the weekend, with BTC barely holding above the $94,000 level. The premier cryptocurrency briefly slipped beneath this price mark on Saturday, January 11, before traveling to as high as $94,870.
Interestingly, a top analyst on the social media platform X has put forward an interesting analysis of the Bitcoin price, suggesting that the market leader might be at a pivotal juncture. Could a bullish breakout be on the cards for the price of BTC or is a deep correction the more likely scenario?
Bitcoin’s Performance In The Next Few Weeks
In a recent post on X, popular crypto analyst Ali Martinez weighed in on the trajectory of the Bitcoin price over the next few weeks. According to the market pundit, the flagship cryptocurrency is currently set up such that it could see a move higher to $140,000 or a pullback to around $67,000.
Related Reading
These projections are based on the formation of two patterns, namely the head-and-shoulders and the bull pennant, on the BTC 12-hour price chart. The pennant pattern is marked by a price upswing (the flagpole) followed by a consolidation range with converging trend lines (the pennant), while the head-and-shoulders formation (as the name suggests) is characterized by three distinct price highs, including a higher “head” between two lower “shoulders.”
The pennant chart formation often serves as a bullish continuation pattern, suggesting the persistence of an upward price trend. The head-and-shoulders pattern, on the other hand, typically indicates a potential bearish reversal, signaling a shift from an uptrend to a downtrend.

As seen in the chart above, the Bitcoin price is yet to break beneath the neckline of the head-and-shoulders pattern, which often serves as confirmation for the trend reversal. If the premier cryptocurrency breaks the neckline situated at around $93,000, its price could plunge to as low as $67,000.
However, Martinez pointed out that the next target could be higher if the Bitcoin price holds above the neckline and breaks out of the bull pennant pattern. If this occurs, a bullish surge to around $140,000 could be on the cards for the price of the market leader. This would represent an almost 50% rally from the current price point.
Bitcoin Price At A Glance
As of this writing, the price of BTC stands at around $94,600, reflecting no significant change in the past 24 hours. According to CoinGecko data, the premier cryptocurrency is down by nearly 4% in the last seven days.
Related Reading
.Featured image from iStock, chart from TradingView
Source link


Ali Martinez
Analyst Says Dogecoin Facing ‘Most Important’ Resistance Wall, Updates Outlook on Solana, Stellar and Toncoin

A widely followed crypto analyst says that meme asset Dogecoin (DOGE) is facing a crucial turning point while updating his outlook on a handful of other altcoins.
In a new thread, crypto trader Ali Martinez tells his 138,500 followers on the social media platform X that resistance around the $0.26 level is key for the dog-themed digital asset.
The trader shares a chart suggesting that $0.26 is a price area that appears to be a trend shift level for DOGE.
“This level remains the most important resistance wall for Dogecoin.”

Dogecoin is trading for $0.22 at time of writing, a 3.3% decrease during the last 24 hours.
Moving on to smart contract platform Solana (SOL), Martinez says that a breakout past $186 could trigger an exponential rally that sends the asset shooting past a $3,000 price tag.
“A breakout here could trigger a parabolic bull run for Solana!”
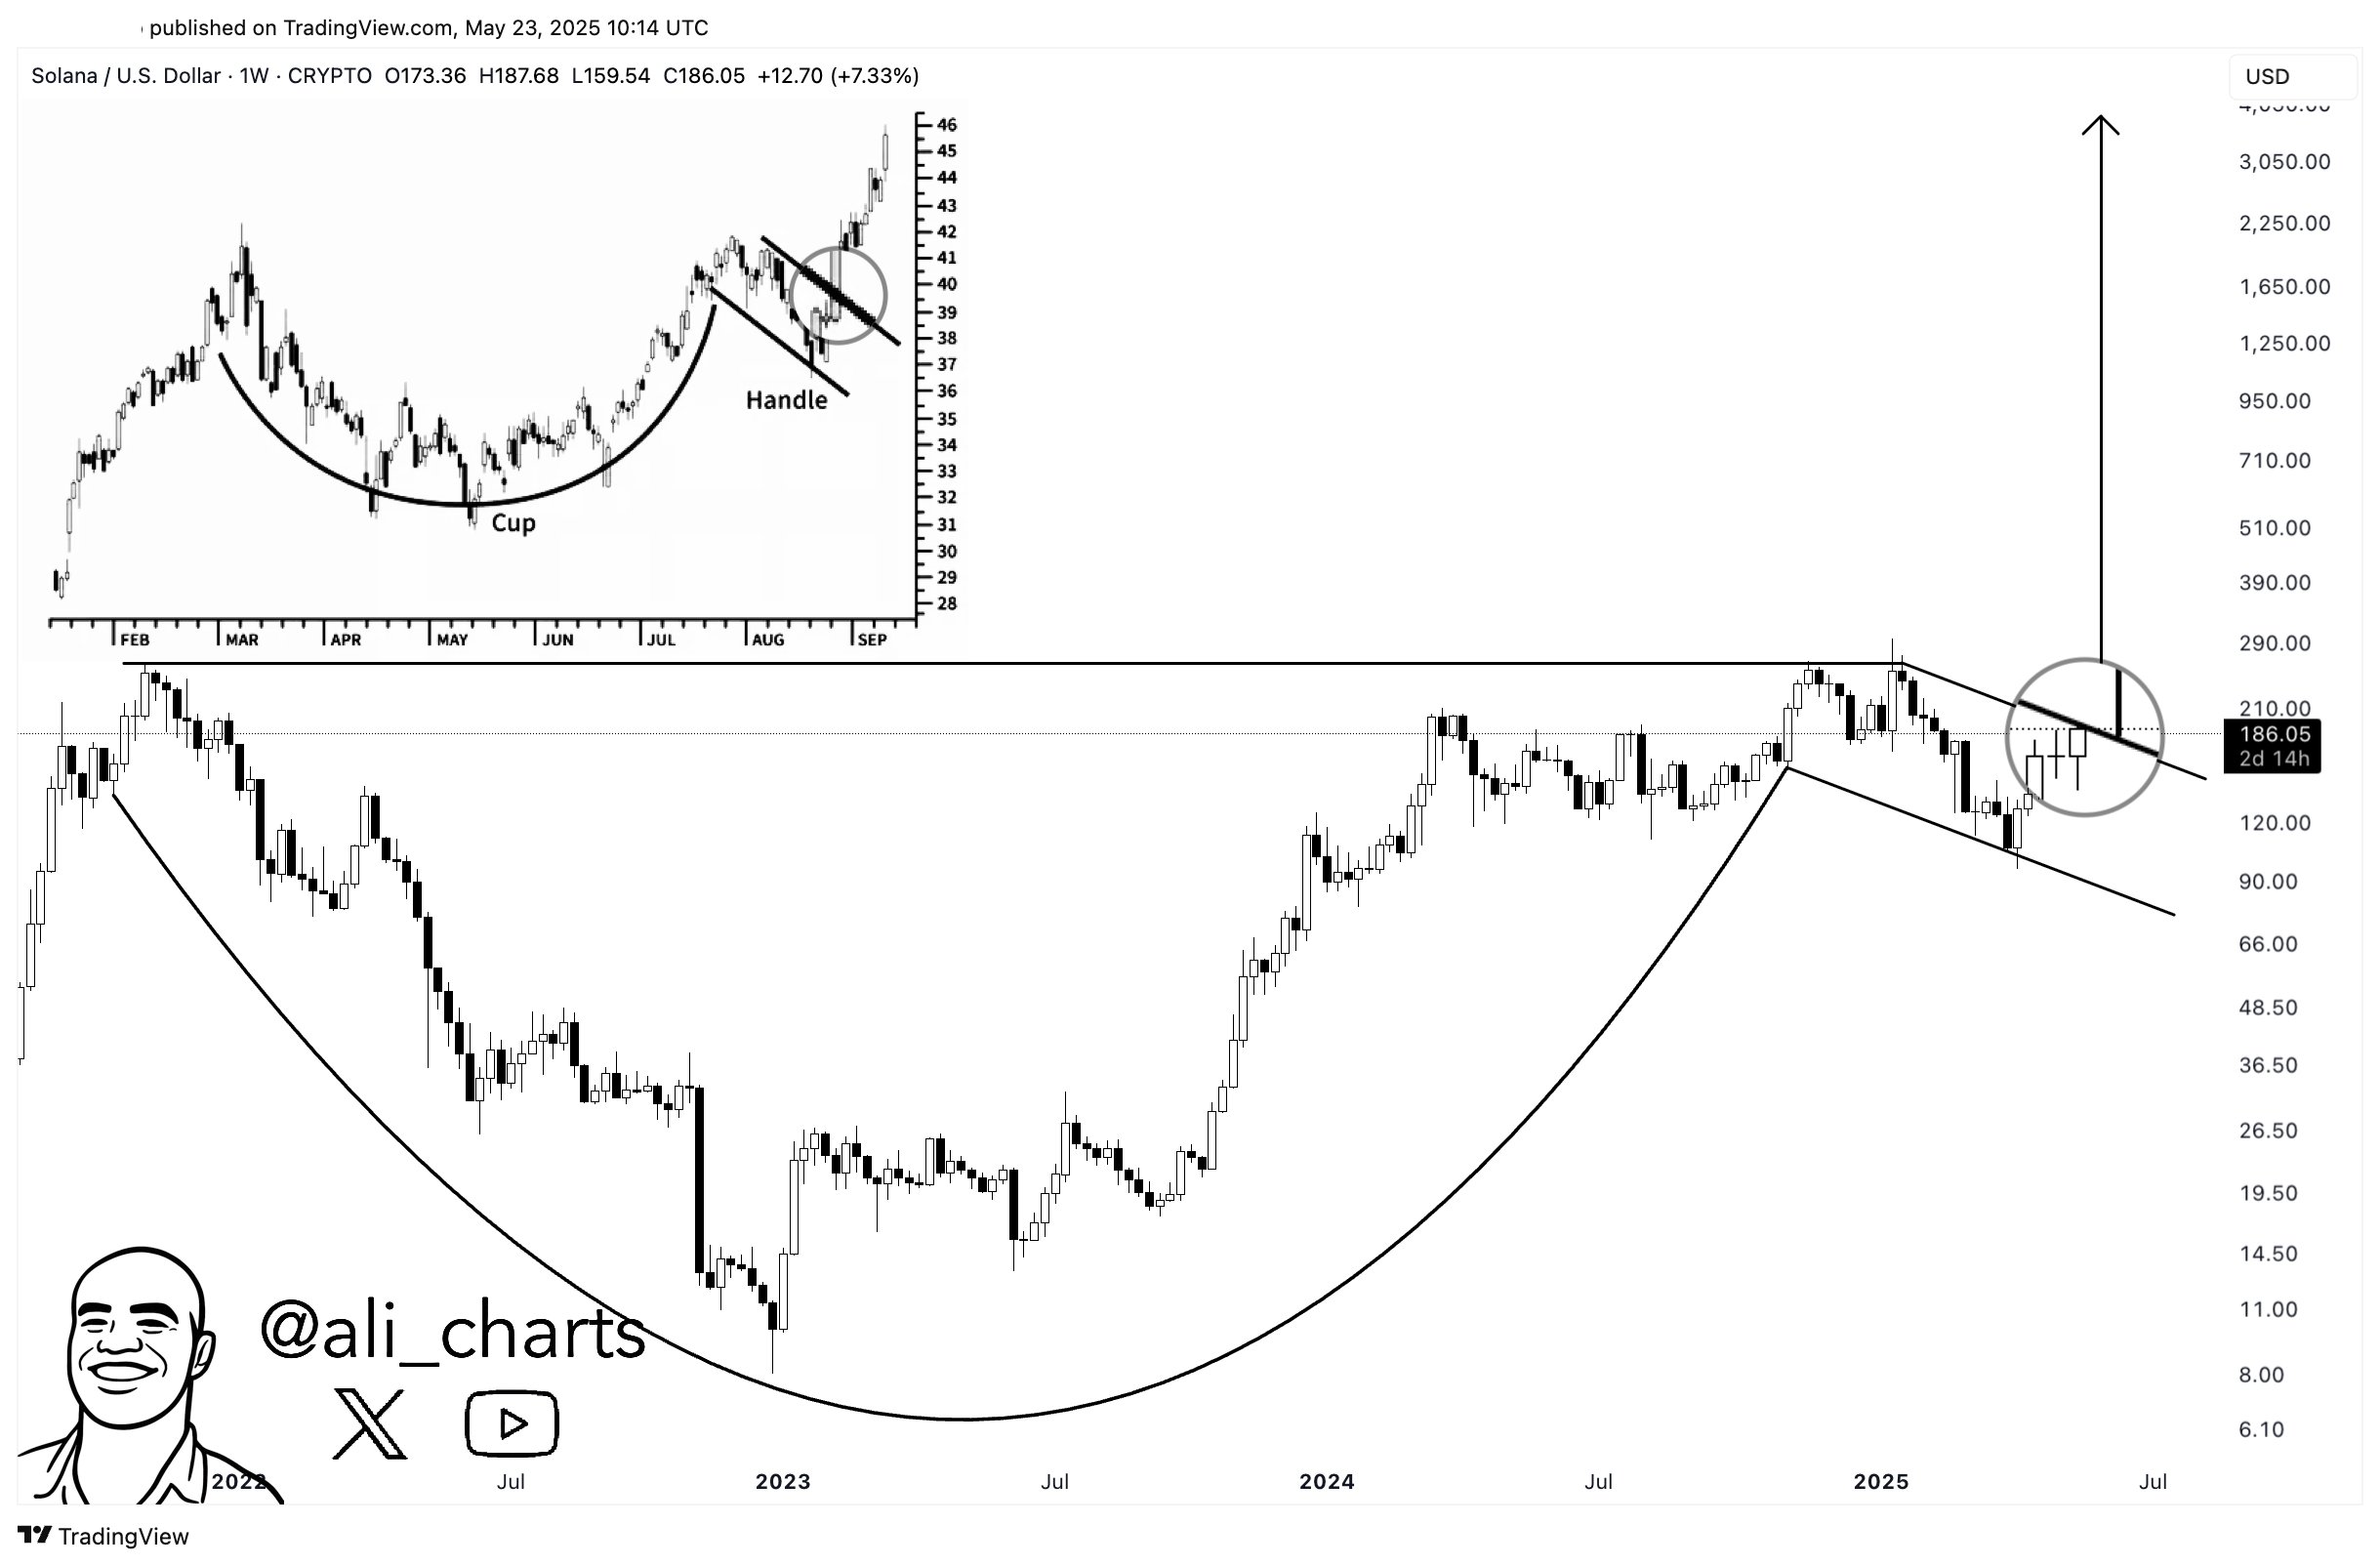
Solana is trading for $172 at time of writing, a 2.6% decrease on the day.
Turning his attention to the payments platform Stellar (XLM), Martinez says that it could witness a correction after moving below a diagonal support.
“XLM could be breaking out of an ascending channel, potentially targeting $0.26!”
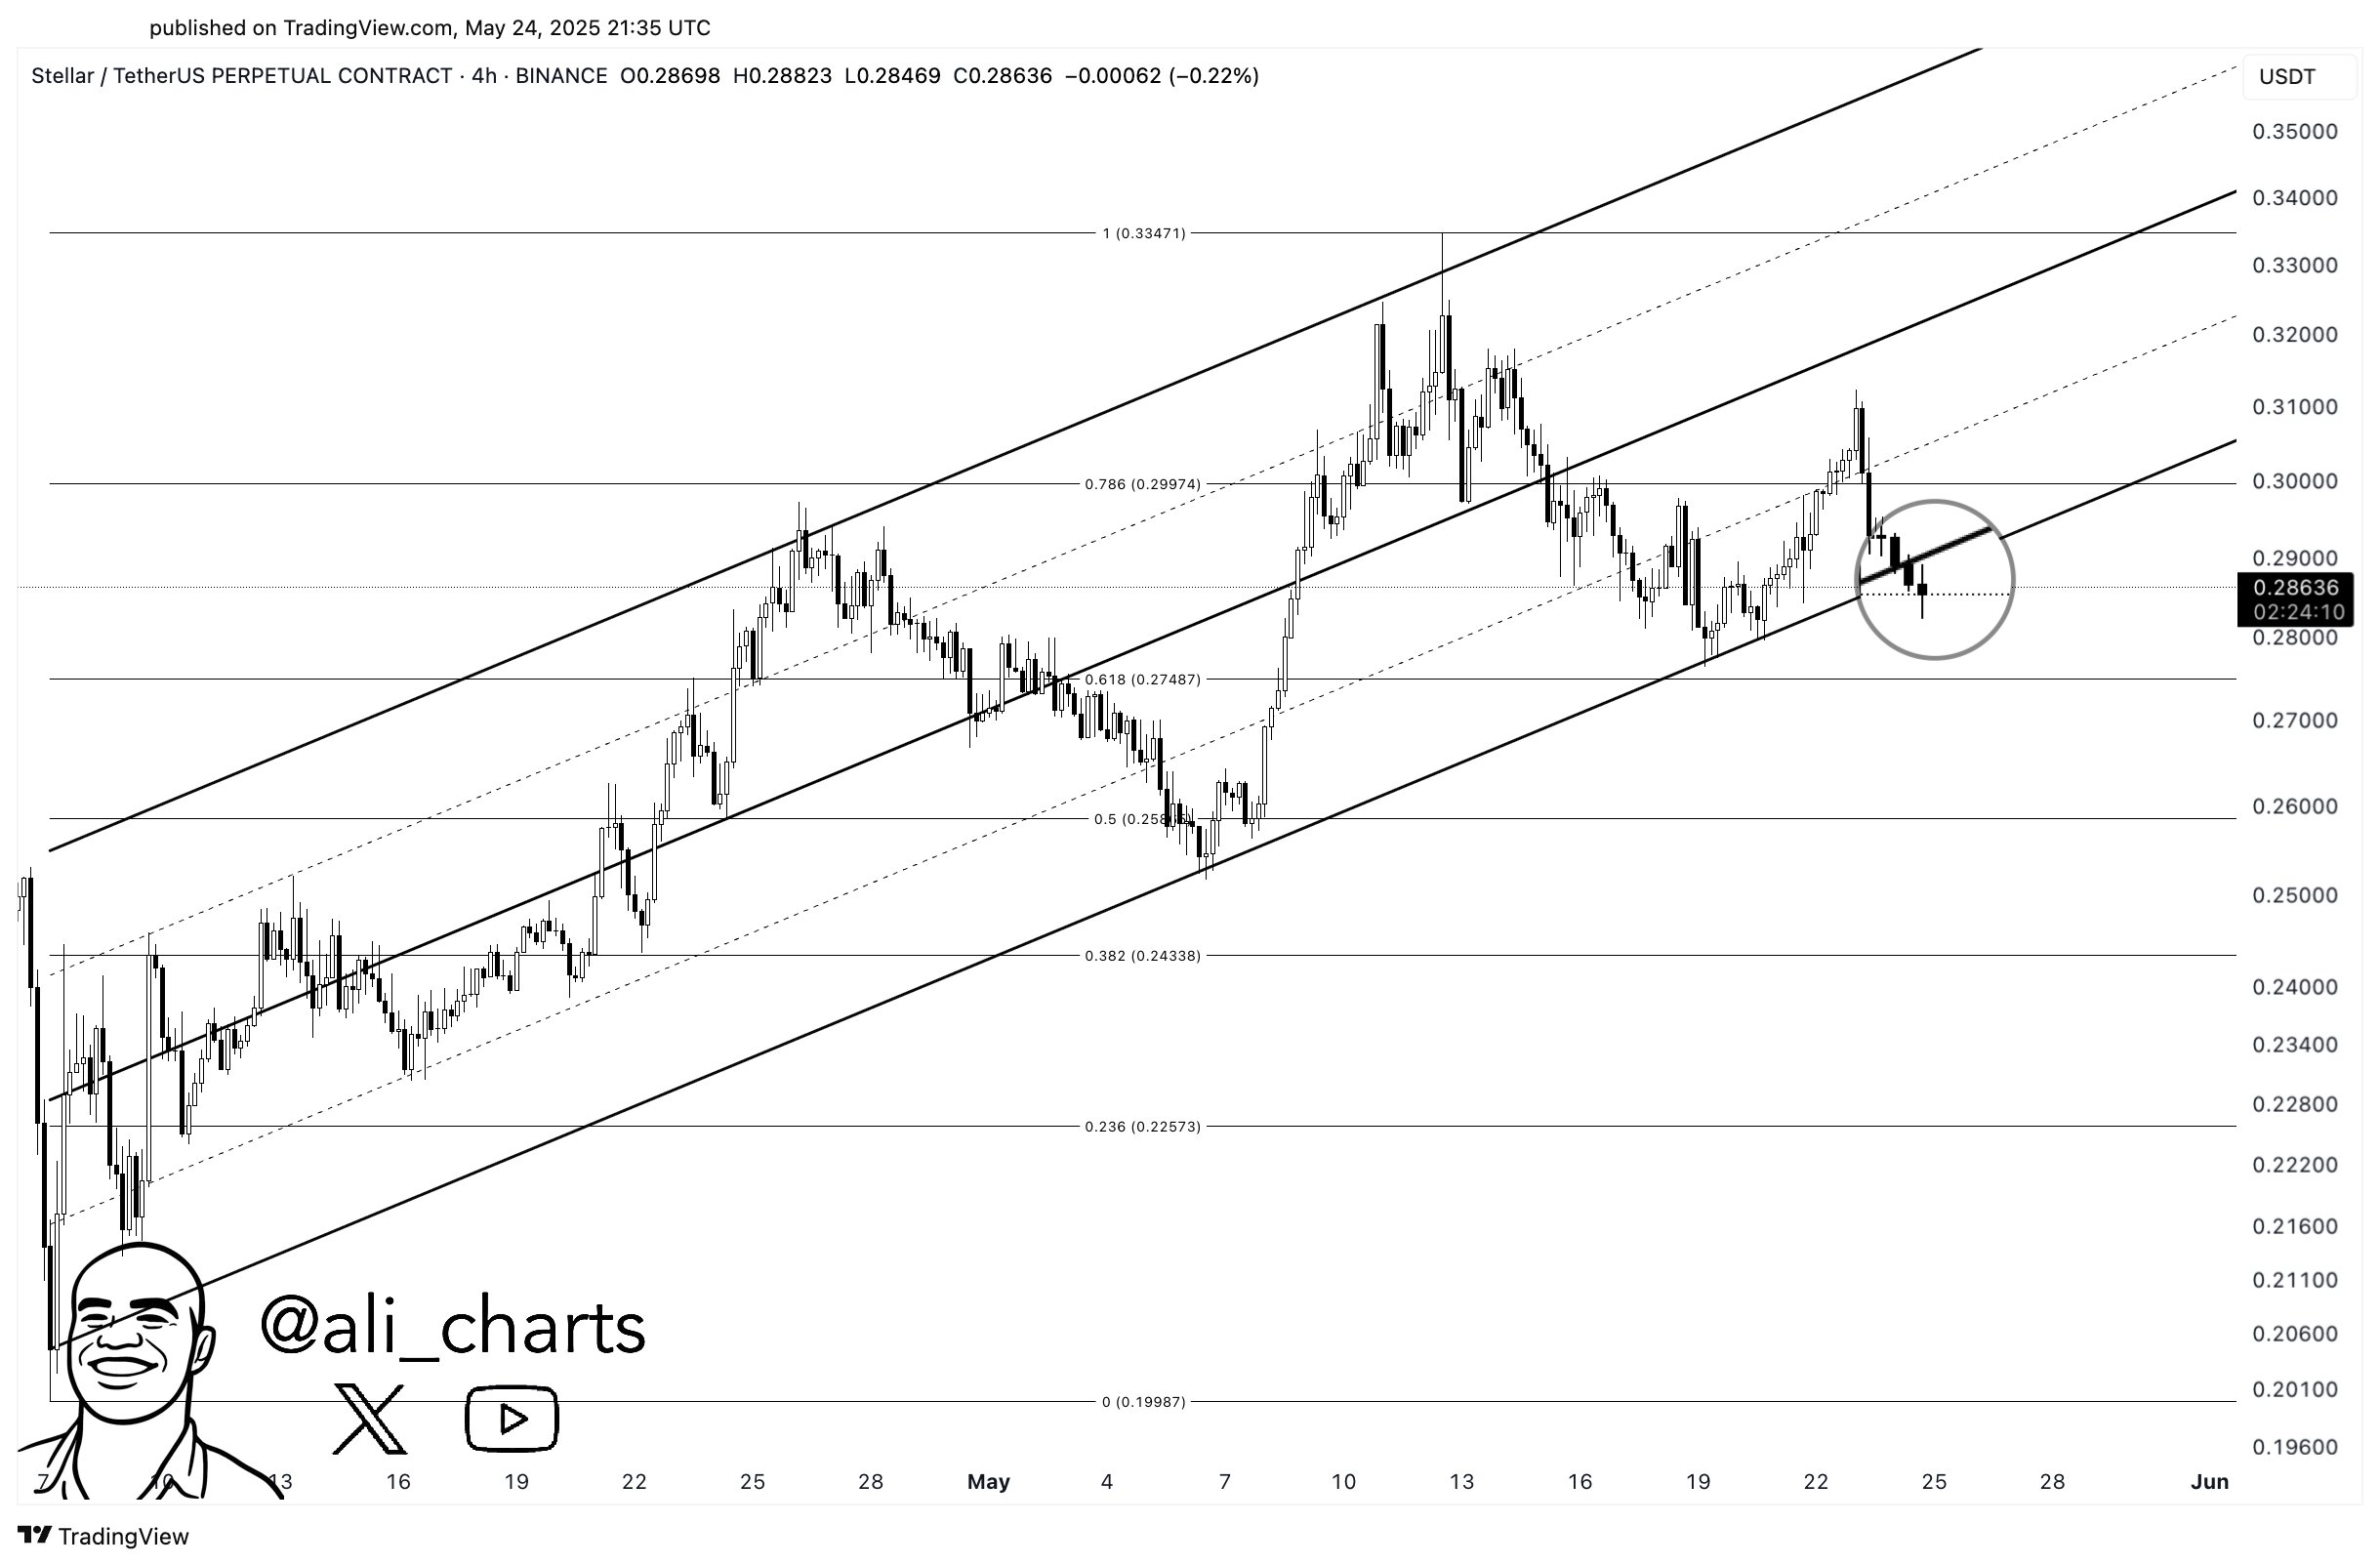
XLM is trading for $0.28 at time of writing, a 1.5% decrease on the day.
Concluding his analysis with the native asset of the layer-1 platform Toncoin (TON), the analyst notes that it too looks to be on the cusp of breaking down of a symmetrical triangle pattern.
In technical analysis, a move below the diagonal trendline of a triangle pattern suggests that an asset is primed for corrective moves.
“Watch out! Toncoin could be breaking out of a symmetrical triangle.”
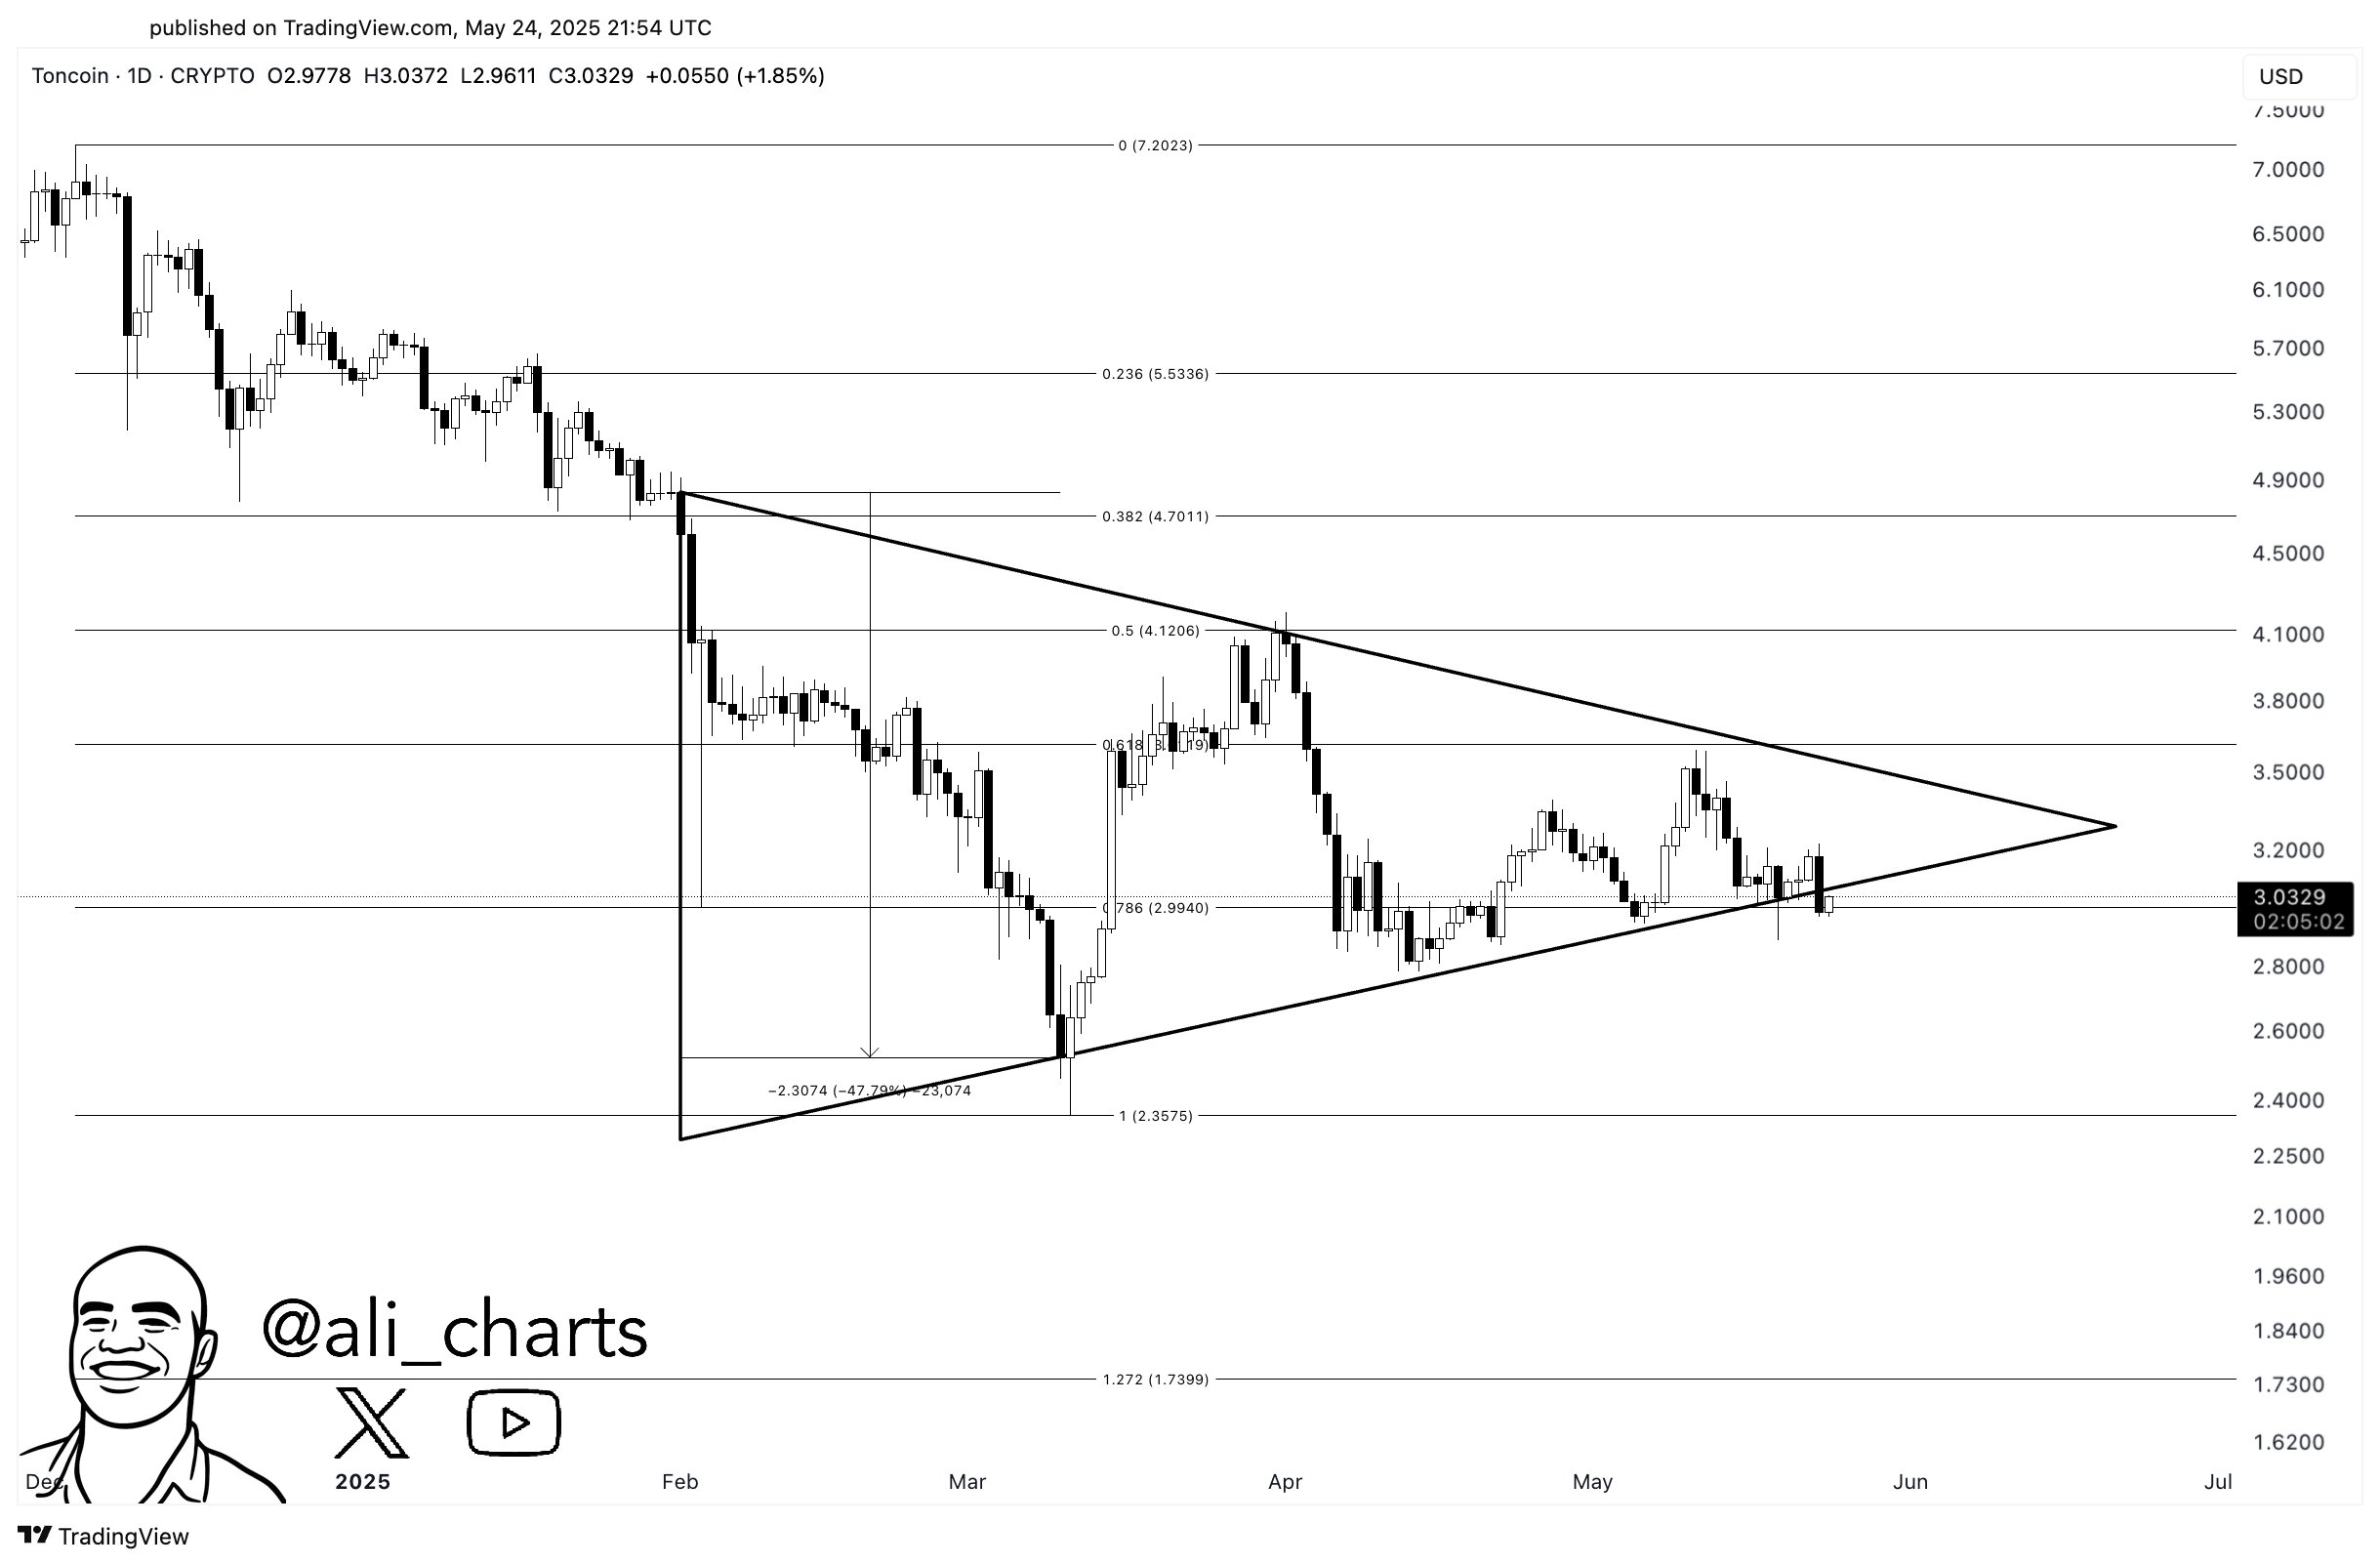
TON is trading for $3.00 at time of writing, a fractional increase on the day.
Follow us on X, Facebook and Telegram
Don’t Miss a Beat – Subscribe to get email alerts delivered directly to your inbox
Check Price Action
Surf The Daily Hodl Mix
 

Disclaimer: Opinions expressed at The Daily Hodl are not investment advice. Investors should do their due diligence before making any high-risk investments in Bitcoin, cryptocurrency or digital assets. Please be advised that your transfers and trades are at your own risk, and any losses you may incur are your responsibility. The Daily Hodl does not recommend the buying or selling of any cryptocurrencies or digital assets, nor is The Daily Hodl an investment advisor. Please note that The Daily Hodl participates in affiliate marketing.
Generated Image: Midjourney
Source link

Reason to trust
![]()
Strict editorial policy that focuses on accuracy, relevance, and impartiality
Created by industry experts and meticulously reviewed
The highest standards in reporting and publishing
Strict editorial policy that focuses on accuracy, relevance, and impartiality
Morbi pretium leo et nisl aliquam mollis. Quisque arcu lorem, ultricies quis pellentesque nec, ullamcorper eu odio.
Market sentiment around the XRP price is flipping bullish as technical indicators and recent chart movements suggest a promising upward trajectory over the next three months. With momentum building, a crypto analyst is now eyeing a potential rally that could push XRP as high as $36.
According to a new prediction posted by crypto analyst Dark Defender on X (formerly Twitter), the XRP price is gearing up for a potentially explosive surge to $36.
XRP Price Forecasted To Reach $36
Related Reading
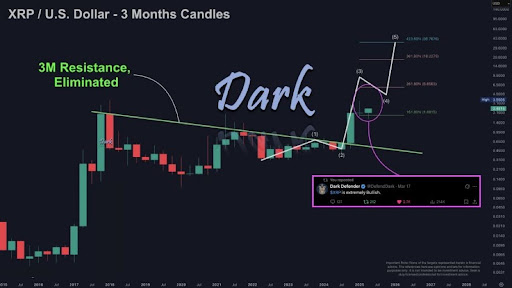
Dark Defender’s three-month candlestick chart applies the Elliott Wave Theory, mapping out a five-wave bullish structure. The analysis shows that Waves 1 and 2 have already played out, and XRP now appears to be entering Wave 3, which is typically seen as the strongest and longest wave.
If this Wave 3 pattern holds, XRP could be on the verge of its most powerful rally yet. According to Dark Defender, the upside target could reach as high as $36.76, representing a staggering 423.6% increase.
Before XRP reaches this projected price level, Dark Defender has forecasted short—to long-term bullish targets for the cryptocurrency. In the short term, XRP could reach $3.33, with a mid-term goal of $5.85.
Additional milestones along the way include key percentage gain levels that may act as interim resistance zones. A 161.8% gain points to a potential price of around $13.81, while a 261.8% surge suggests a move toward $18.96. If momentum continues, the token could push further to $26.87, aligning with a 361.8% increase.
On the downside, support levels at $2.3620 and $2.222 are expected to act as strongholds in case of any retracement before continuation. Moving forward, Dark Defender has doubled down on his bullish stance on XRP’s future outlook, referencing a tweet dated March 17 that boldly declared, “XRP is extremely bullish.”
Clear Path Ahead For The Altcoin As Resistance Thins Out
In an X post released on May 13, Ali Martinez, a prominent crypto analyst, disclosed that on-chain data from Glassnode shows a clear bullish path for XRP, with no signs of major resistance clusters ahead. The analysis based on the UTXO Realized Price Distribution (URPD) indicates that a significant portion of XRP tokens were last moved at lower price levels.
Related Reading
The chart also highlights a significant support zone at $2.38, where nearly 1.85 billion XRP, amounting to 2.92% of its supply, were last transacted. This concentration of holders could serve as a psychological and technical support level if the market pulls back. Moreover, the absence of large token holdings at higher price ranges suggests that the price could experience a smoother ascent, unburdened by major resistance from profit-takers.
Featured image from Getty Images, chart from Tradingview.com
Source link

Reason to trust
![]()
Strict editorial policy that focuses on accuracy, relevance, and impartiality
Created by industry experts and meticulously reviewed
The highest standards in reporting and publishing
Strict editorial policy that focuses on accuracy, relevance, and impartiality
Morbi pretium leo et nisl aliquam mollis. Quisque arcu lorem, ultricies quis pellentesque nec, ullamcorper eu odio.
Crypto analyst Melika Trader has warned about a bearish pattern that could be forming for the Bitcoin price. Based on this, the analyst predicts that the largest crypto by market cap could crash to as low as $78,000.
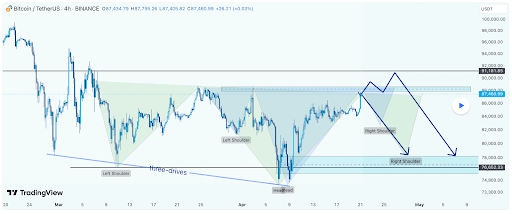
Bitcoin Price Forming Head And Shoulders Pattern
In a TradingView post, Melika Trader revealed that the Bitcoin price is forming a complex head-and-shoulders pattern. He remarked that the left shoulder and double head had already formed while the right shoulder is currently forming, with BTC at risk of suffering a massive crash once this happens.
Related Reading
As part of the expected move, Melika Trader suggested that the Bitcoin price could show a possible fake breakout above the resistance between $87,000 and $88,000. Once that happens, the analyst predicts that a strong drop will follow, with BTC dropping to as low as $78,000, which is the first support area.
The Bitcoin price has surged past the $90,000 mark on the back of the US Dollar dropping to new lows and has continued to reach new highs, leading to optimism that it could soon reclaim $100,000. There is the possibility that BTC could still rally to as high as $98,000 before any massive correction.
Crypto analyst Ali Martinez revealed that on-chain data shows that the next key area of resistance for the Bitcoin price is between $95,600 and $98,290. That range acts as a major supply wall, as 1.65 million addresses bought 1.09 million BTC around that area. Bitcoin’s next move will depend on whether these holders choose to hold or offload their coins as soon as it reclaims this range.
However, it is worth mentioning that crypto whales are actively accumulating BTC, which is bullish for the Bitcoin price. Martinez revealed that over 17,000 BTC have been withdrawn from exchanges in the past week.
BTC Eyeing Rally To A New All-Time High
Crypto analyst Titan of Crypto has predicted that the Bitcoin price could soon rally to as high as $137,000, marking a new all-time high (ATH) for the leading crypto. He stated that BTC has finally broken out of a bull pennant, with two strong consecutive daily bullish candles, confirming this move. The analyst added that the projected target is $137,000 if this bull pennant is confirmed.
Related Reading
Crypto analyst Egrag Crypto stated that a daily close above $93,000 will send a strong bullish signal, while raising the possibility of BTC rallying above $100,000. He claimed that any retracement fears will be eliminated if the leading crypto closes above $103,000.
At the time of writing, the Bitcoin price is trading at around $93,000, up over 5% in the last 24 hours, according to data from CoinMarketCap.
Featured image from Adobe Stock, chart from Tradingview.com
Source link
Ethereum Price Headed For Crash To $2,000 With Current Price Action
Tokenized funds hit $5.7B, scaling fast — Moody’s
Authorities Warn of Phony Text Messages Phishing for Sensitive Information, Telling Victims Their Bank Account Is at Risk
Tether invests in Chilean crypto exchange Orionx

MARA Hits Record-High Bitcoin Production in May
Retail investors no longer FOMO into BTC, altcoins
AVAX Rises 3.8% on Strong Volume, Breaking Key Resistance Levels

K33 begins Bitcoin buying with 10 BTC purchase for treasury strategy
Why $107,500 And $103,500 Are The Levels To Watch
Pakistan Proposes New Crypto Regulations
Japanese Bitcoin Hoarder Metplanet Adds $115,600,000 Worth of BTC As Stock Surpasses 263% Gains on the Year
Bitcoin traders anticipate decline, watch $100K
Ethereum Foundation Restructures R&D Division, Plans ‘Rethink’ on Design and Development
Here’s why Sophon crypto rallied over 40% today
BCB Strikes Deal with SocGen–FORGE to Distribute Euro-Pegged Stablecoin EURCV


 24/7 Cryptocurrency News7 months ago
Arthur Hayes, Murad’s Prediction For Meme Coins, AI & DeFi Coins For 2025

 Markets3 months ago
Pi Network coin to $10? 4 catalysts that may make it possible

 Ripple Price3 months ago
3 Voting Polls Show Why Ripple’s XRP Price Could Hit $10 Soon

 Bitcoin5 months ago
Expert Sees Bitcoin Dipping To $50K While Bullish Signs Persist

 24/7 Cryptocurrency News5 months ago
Aptos Leverages Chainlink To Enhance Scalability and Data Access

 Bitcoin7 months ago
Bitcoin Could Rally to $80,000 on the Eve of US Elections

 Opinion7 months ago
Crypto’s Big Trump Gamble Is Risky

 Bitcoin4 months ago
The Future of Bitcoin: Scaling, Institutional Adoption, and Strategic Reserves with Rich Rines
