
cryptocurrency
BONK hits new all-time high following Upbit listing

BONK has emerged as the top gainer among the leading 100 assets following a major announcement from the South Korean crypto exchange Upbit.
Bonk (BONK), the first Solana-based meme coin, surged 18% on Wednesday to hit a new all-time high of $0.000058. Its market cap soared to over $4.1 billion when writing, flipping Dogwifhat’s (WIF) $3.2 billion market cap to reclaim its position as the largest meme coin on the Solana blockchain.
Why is BONK going up?
The altcoin’s price uptick coincided with a jump in the meme coin’s futures open interest. According to data from CoinGlass, OI for BONK’s futures market rose to an all-time high of $53.5 million, more than 7 times its monthly low of $6.3 million, suggesting a growing demand from investors.
Bonk’s recent rally followed its listing on South Korea’s largest crypto exchange, Upbit. BONK’s daily trading volume shot up 95% amid the listing, hovering over $3.5 billion when writing.
Another key factor driving the altcoin’s gains is Bonk DAO’s announcement of a massive 1 trillion token burn scheduled for Christmas Day, which is set to reduce the total number of tokens in circulation, thereby increasing scarcity.
Whales have also been interested in the meme coin lately. According to data shared by Lookonchain, a whale with a history of profitable meme coin investments has spent 3.4 million USDC to buy 65.4 billion BONK tokens. Last week, another whale was seen picking up 29.32 billion BONK at $0.0000387.
Whale buying typically boosts retail investor confidence in an asset, potentially driving FOMO (fear of missing out) among those seeking quick gains.
Bullish momentum to continue
BONK’s rally hasn’t lost strength despite surging over 72% in the past week alone. On the 1-day BONK/USDT price chart, BONK’s EMA lines show a strong bullish trend, with the short-term 50-day EMA above the long-term 200-day EMA and the price staying above both lines.

Based on this setup, the bullish trend is expected to continue in the short term as the buyers remain in control. However, the Relative Strength Index showed a reading of 82, which confirms the bullish momentum but puts the meme coin at overbought levels.

Despite the overbought status, an analyst suggests that BONK is undergoing a ‘Blue Sky breakout,’ which could sustain its upward trajectory in the coming days.
This speculation is supported by strong catalysts driving the uptrend and the current hype around meme coins. Separately, Bitcoin’s recent rally to new highs has amplified market-wide sentiment, further boosting interest in the meme coin sector, which gained 2.3% over the past day.
Source link


Reason to trust
![]()
Strict editorial policy that focuses on accuracy, relevance, and impartiality
Created by industry experts and meticulously reviewed
The highest standards in reporting and publishing
Strict editorial policy that focuses on accuracy, relevance, and impartiality
Morbi pretium leo et nisl aliquam mollis. Quisque arcu lorem, ultricies quis pellentesque nec, ullamcorper eu odio.
As the XRP price climbs back above the crucial $2 mark, reflecting a 20% surge over the past week, market analysts are increasingly optimistic about the token’s recovery and potential for setting new all-time highs (ATHs).
Expert analyst Maelius recently shared insights on social media platform X (formerly Twitter), suggesting that the current market dynamics support a bullish outlook for the XRP price.
XRP Price Could Target $10 In Conservative Case
Despite the recent price surge, some market participants remain skeptical about XRP’s trajectory. Maelius addressed these concerns, stating, “In a conservative case, I think XRP looks very bullish on higher time frames (HTFs).”
Historically, XRP has shown a pattern of respecting the 50-week Exponential Moving Average (EMA) during bull markets. Recently, the asset touched this EMA and rebounded, reinforcing the belief that it is on a positive trajectory.
Related Reading
In his social media update, Maelius outlined two scenarios for XRP’s future price movements: a conservative case and a more optimistic base case. In the conservative scenario, Maelius posits that XRP has completed its Wave 3 (W3) of a larger Elliott Wave cycle and is currently finalizing Wave 4. This suggests that XRP could expand into a final Wave 5, targeting $10.
The expert assigns a 35% probability to this conservative case, highlighting that price and Relative Strength Index (RSI) behaviors indicate a potential base formation around current levels before reaching new highs later in the year.
Maelius’s more optimistic scenario suggests that the top of Wave 3 may not have been reached yet. He points out that the accumulation phase for the XRP price has been longer than in previous cycles, indicating that the market may just be taking more time to develop.
In this case, the final W5 could extend into the first or second quarter of the next year, with targets ranging from $15 to $20 or higher.
Can Dominance Translate To Price Gains?
In addition to the XRP pprice analysis, Maelius examined the token’s market dominance, which indicates the token’s share within the broader cryptocurrency market.
The expert noted that while the token’s dominance has been preparing for a final upward move, this does not necessarily correlate with the XRP price reaching new highs.
The dominance metric, seen in the image below shared by Maelious, suggests that while XRP might underperform relative to other altcoins, it still has the potential for significant price appreciation.
Related Reading
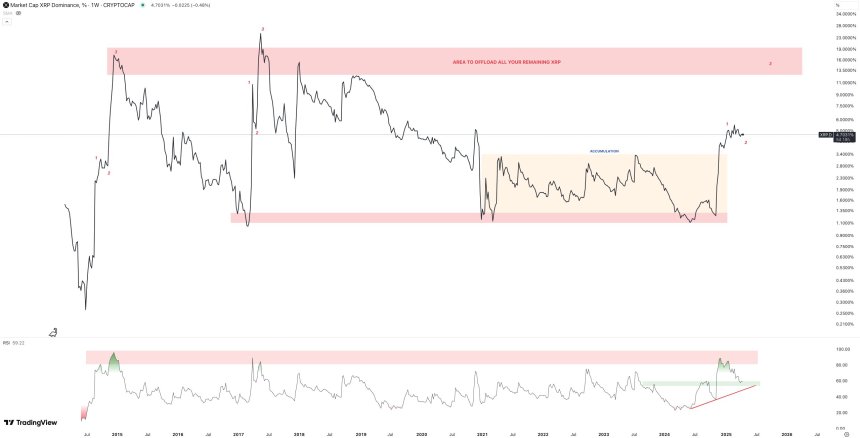
The 1-week RSI for the token’s dominance is currently in an uptrend and resting on horizontal support. If this support level fails, a diagonal support line could provide the next level of defense.
Historically, XRP’s dominance has experienced two major impulses during previous cycles, each reaching notable resistance areas. However, Maelius cautions that the growing size of the market makes it increasingly challenging for any single asset to achieve the same peaks as in prior cycles.
Featured image from DALL-E, chart from TradingView.com
Source link

AI-focused crypto tokens are seeing a dip as Nvidia, the top AI chipmaker fueling the space, could soon take a major financial hit due to new U.S. export restrictions.
In a filing on April 14, Nvidia said it expects around $5.5 billion in charges for the first quarter of fiscal year 2026 because of U.S. government rules limiting its AI chip sales to China.
On April 9, officials told Nvidia it now needs special export licenses for its popular H20 chips and others with similar capabilities. The new restrictions target China, Hong Kong, and Macau, with the government warning that the chips could end up powering Chinese supercomputers.
The H20 chip is the most advanced AI chip Nvidia is currently allowed to sell in China under the earlier rules. It’s reportedly been used by Chinese AI startup DeepSeek to train models, something that has raised concerns among U.S. lawmakers.
Even though Nvidia said it plans to spend hundreds of millions over the next four years making some AI chips in the U.S., that hasn’t stopped the stock from sliding after its latest filing and the expected hit to future revenues. NVDA dropped 6.3% in after-hours trading on April 15 to $105.10, and it’s down about 16.45% so far this year.
Nvidia’s decline mirrors a wider pullback in tech as Trump’s tariff escalation rattles investor confidence across the sector. Other prominent tech stocks were also in the red, with Apple down 0.20% from the previous close to $202.14, Microsoft off 0.56% at $385.73, Alphabet sliding 1.71% to $156.31, and Amazon dropping 1.33% to $179.59.
Adding to Nvidia’s troubles, a “death cross” has formed on the 1-day NVDA/USD chart, a bearish technical signal where its 50-day moving average drops below the 200-day one. The last time this happened was in April 2022, and Nvidia’s stock plunged nearly 50% in the following six months.

That’s got investors in AI crypto tokens on edge, as these tokens have often reacted to Nvidia-related news mostly due to the fact that Nvidia’s hardware plays a central role in powering the AI infrastructure that many of these projects rely on.
For instance, in December, reports of China launching an antitrust probe into Nvidia caused the AI crypto token market cap to drop by over 14% in a single day. In the past, a surge in the Nvidia stock price has also resulted in bullish rallies for AI tokens.
Following Nvidia’s latest filing, the total market cap of AI-related tokens has fallen 3.7% in the past 24 hours, now sitting at around $20.1 billion. Trading volume also declined, signaling weaker demand.
Near Protocol (NEAR), the biggest AI crypto by market cap, slid 5.3% over the past day. Other major tokens like Internet Computer (ICP), Render (RENDER), Sei (SEI), Virtuals Protocol (VIRTUAL), and Akash Network (AKT) also lost between 5% and 12%.
Source link
cryptocurrency
Solana liquidity grab below $90 coming first or a reclaim of point of control resistance?

Solana is currently struggling to reclaim a key point of control within its trading range, leading to a weak rejection and signs of bearish compression. As the price remains below this critical volume zone, it opens up the possibility of a move below $90, a region primed for a potential liquidity sweep and swing failure pattern that could set the stage for a significant reversal.
Solana’s (SOL) recent price action suggests an effort to build a base, but bullish momentum is being capped by its inability to reclaim the range’s point of control—where the majority of recent trading activity has occurred. This failure has turned that zone into short-term resistance, compressing price action and leaving Solana vulnerable to further downside unless reclaimed decisively.
Key points covered in this article:
- Rejection at the point of control puts pressure on Solana’s short-term trend
- $89 support remains critical for a possible SFP and reversal trigger
- Liquidity beneath current levels could fuel a bullish rotation back to $178–$252

Solana’s rejection at the volume point of control has created a precarious technical setup. This level, once acting as support, has flipped into resistance, tightening price action and amplifying the likelihood of a liquidity-driven dip. Unless Solana reclaims this volume node with conviction, the short-term outlook remains defensive for bulls.
The $89 support, just under the psychological $90 threshold, is now a key area to watch. It marks a swing low that remains untouched and sits in a high-liquidity zone. A sweep of this level followed by a clear swing failure pattern could trigger a strong reversal, with upside targets in the weekly structure zone between $178 and $252.
It’s essential to understand that markets hunt liquidity, and the region below $90 is likely loaded with stop orders from traders holding positions between $130 and $100. A move into this liquidity pocket would be consistent with typical market structure, especially in a consolidating asset. However, if Solana manages to reclaim the point of control before that happens, this bearish scenario becomes invalidated, and a more bullish outlook resumes, favoring continuation toward higher resistance levels.
How to trade this setup:
Wait for a sweep of the $89 low, and look for signs of a swing failure pattern as a trigger for long entries. If confirmed, position for a potential rally targeting $178–$252. If price reclaims the point of control, consider adjusting the bias to favor bullish continuation. It is important to use price action upon discretion and management according to your trading system
Source link

AVAX Falls 2.1% as Nearly All Assets Trade Lower

What is a VTuber, and how do you become one in 2025?

Top Expert’s Update Sets $10 Target

How Academia Interacts With The Bitcoin Ecosystem

AB DAO and Bitget Launch Dual Reward Campaign, Distributing $2.6M Worth of $AB Globally

AI crypto tokens at risk as Nvidia faces restrictions on China exports

Coinbase Urges Australia to Vote for Crypto Progress in May

How High Would Pi Network Price Go If Pi Coin Adopts Transparency to Avoid Mantra Pitfalls

XRP’s ‘Rising Wedge’ Breakdown Puts Focus on $1.6 Price Support

China selling seized crypto to top up coffers as economy slows: Report

Ethereum Price Dips Again—Time to Panic or Opportunity to Buy?

The Inverse Of Clown World”

Bitcoin Indicator Flashing Bullish for First Time in 18 Weeks, Says Analyst Who Called May 2021 Crypto Collapse

3iQ and Figment to launch North America’s first Solana staking ETF

Bitcoin Miners Are Selling More BTC to Make Ends Meet: CryptoQuant


 24/7 Cryptocurrency News5 months ago
Arthur Hayes, Murad’s Prediction For Meme Coins, AI & DeFi Coins For 2025

 Bitcoin3 months ago
Expert Sees Bitcoin Dipping To $50K While Bullish Signs Persist

 24/7 Cryptocurrency News3 months ago
Aptos Leverages Chainlink To Enhance Scalability and Data Access

 Bitcoin5 months ago
Bitcoin Could Rally to $80,000 on the Eve of US Elections

 Opinion5 months ago
Crypto’s Big Trump Gamble Is Risky

 Altcoins3 months ago
Sonic Now ‘Golden Standard’ of Layer-2s After Scaling Transactions to 16,000+ per Second, Says Andre Cronje

 Bitcoin5 months ago
Institutional Investors Go All In on Crypto as 57% Plan to Boost Allocations as Bull Run Heats Up, Sygnum Survey Reveals

 Price analysis5 months ago
Ripple-SEC Case Ends, But These 3 Rivals Could Jump 500x
