
Bitcoin
California Is Working Towards Embracing Bitcoin


According to a press release sent to Bitcoin Magazine, an Office of California Assembly Member, Republican Phillip Chen, has appointed Proof of Workforce, a Santa Monica-based non-profit helping workers, unions, pensions, and municipalities with education-based Bitcoin adoption, to work on a variety of Bitcoin related initiatives and help with drafting an official bill for an upcoming legislative session.
“As to where and how Bitcoin and digital assets get into the trajectory of California, much is undetermined,” said Chen. “What is certain is that this industry is growing in adoption everyday, with Bitcoin serving as a global network and asset, representing 2 trillion dollars in value. Therefore, it’s important we take a meaningful look into its role in our great state of California.”
Proof of Workforce, led by its founder Dom Bei, will be advising Chen’s policy team, working on education and community engagement, and researching how Bitcoin can support and rebuild California’s infrastructure and communities.
“Bitcoin’s Genesis story has deep roots in California,” commented Bei. “A huge part of that Genesis Story is an innovative network, designed to protect the time, energy, and value of everyday, working people. Bitcoin isn’t partisan, it’s uniquely Californian.”
This isn’t Proof of Workforce’s first time helping onboard governments in California to Bitcoin. Last summer, Proof of Workforce partnered with the City of Santa Monica to open an official Bitcoin office. Since opening, the office has seen “an overwhelming amount of interest”, according to the city’s Mayor Lana Negrete. Santa Monica’s City Manager has also stated that other cities have reached out to learn more about their Bitcoin endeavors.
JUST IN:
Santa Monica City Manager says "several other cities have reached out to learn more" about their official #Bitcoin Office
"The Bitcoin Office has seen significant interest from the public"
pic.twitter.com/ortfFTCx1S
— Bitcoin Magazine (@BitcoinMagazine) October 9, 2024

Mass adoption starts with initiatives like this. Bitcoin adoption within California’s government is beginning and with the United States embracing Bitcoin under President Trump, it is very likely that the adoption of this asset within the state government will continue over the coming years.
Over the years I’ve watched Dom Bei and Proof of Workforce onboard Careers in Government, firefighter unions in America, El Salvador, and Africa, workers, and more to Bitcoin. They’re doing it right by helping these organizations buy and hold their own bitcoin keys, making sure they’re all properly educated on not just bitcoin the asset but Bitcoin the network as well. One by one, Proof of Workforce is making real change that impacts people’s daily lives.
If you are not following Bei and Proof of Workforce on X, you should be. After talking with Dom personally, they are working on a lot of exciting initiatives that you’ll want to hear about — stay tuned.
This article is a Take. Opinions expressed are entirely the author’s and do not necessarily reflect those of BTC Inc or Bitcoin Magazine.
Source link


ADA
Analyst Says Crypto Whales Loading Up on Ethereum, Accumulating $815,514,345 in ETH in Just Five Days

A crypto analyst says deep-pocketed investors are snapping up the top layer-1 platform Ethereum (ETH) amid the marketwide digital asset correction.
Trader Ali Martinez tells his 132,900 followers on the social media platform X that whales gobbled up more than $815.514 million worth of ETH in less than a week.
“Whales have bought more than 420,000 Ethereum ETH in [five days]!”

Martinez is also keeping a close watch on Ethereum’s In/Out of the Money Around Price (IOMAP) metric – which classifies crypto addresses as either profiting, breaking even, or losing money – to determine support and resistance levels for ETH.
According to Martinez, ETH is currently trading in a narrow range between stiff support and resistance zones.
“Ethereum ETH key levels to watch! On-chain data reveals $1,870 as the strongest support and $2,050 as its toughest resistance!”

At time of writing, ETH is trading for $1,941.
Turning to Bitcoin (BTC), the trader believes that the crypto king is poised to witness tactical rallies after breaching the horizontal resistance of an ascending triangle pattern.
“Bitcoin BTC is breaking out! The target is $90,000 as long as the $84,000 support holds.”
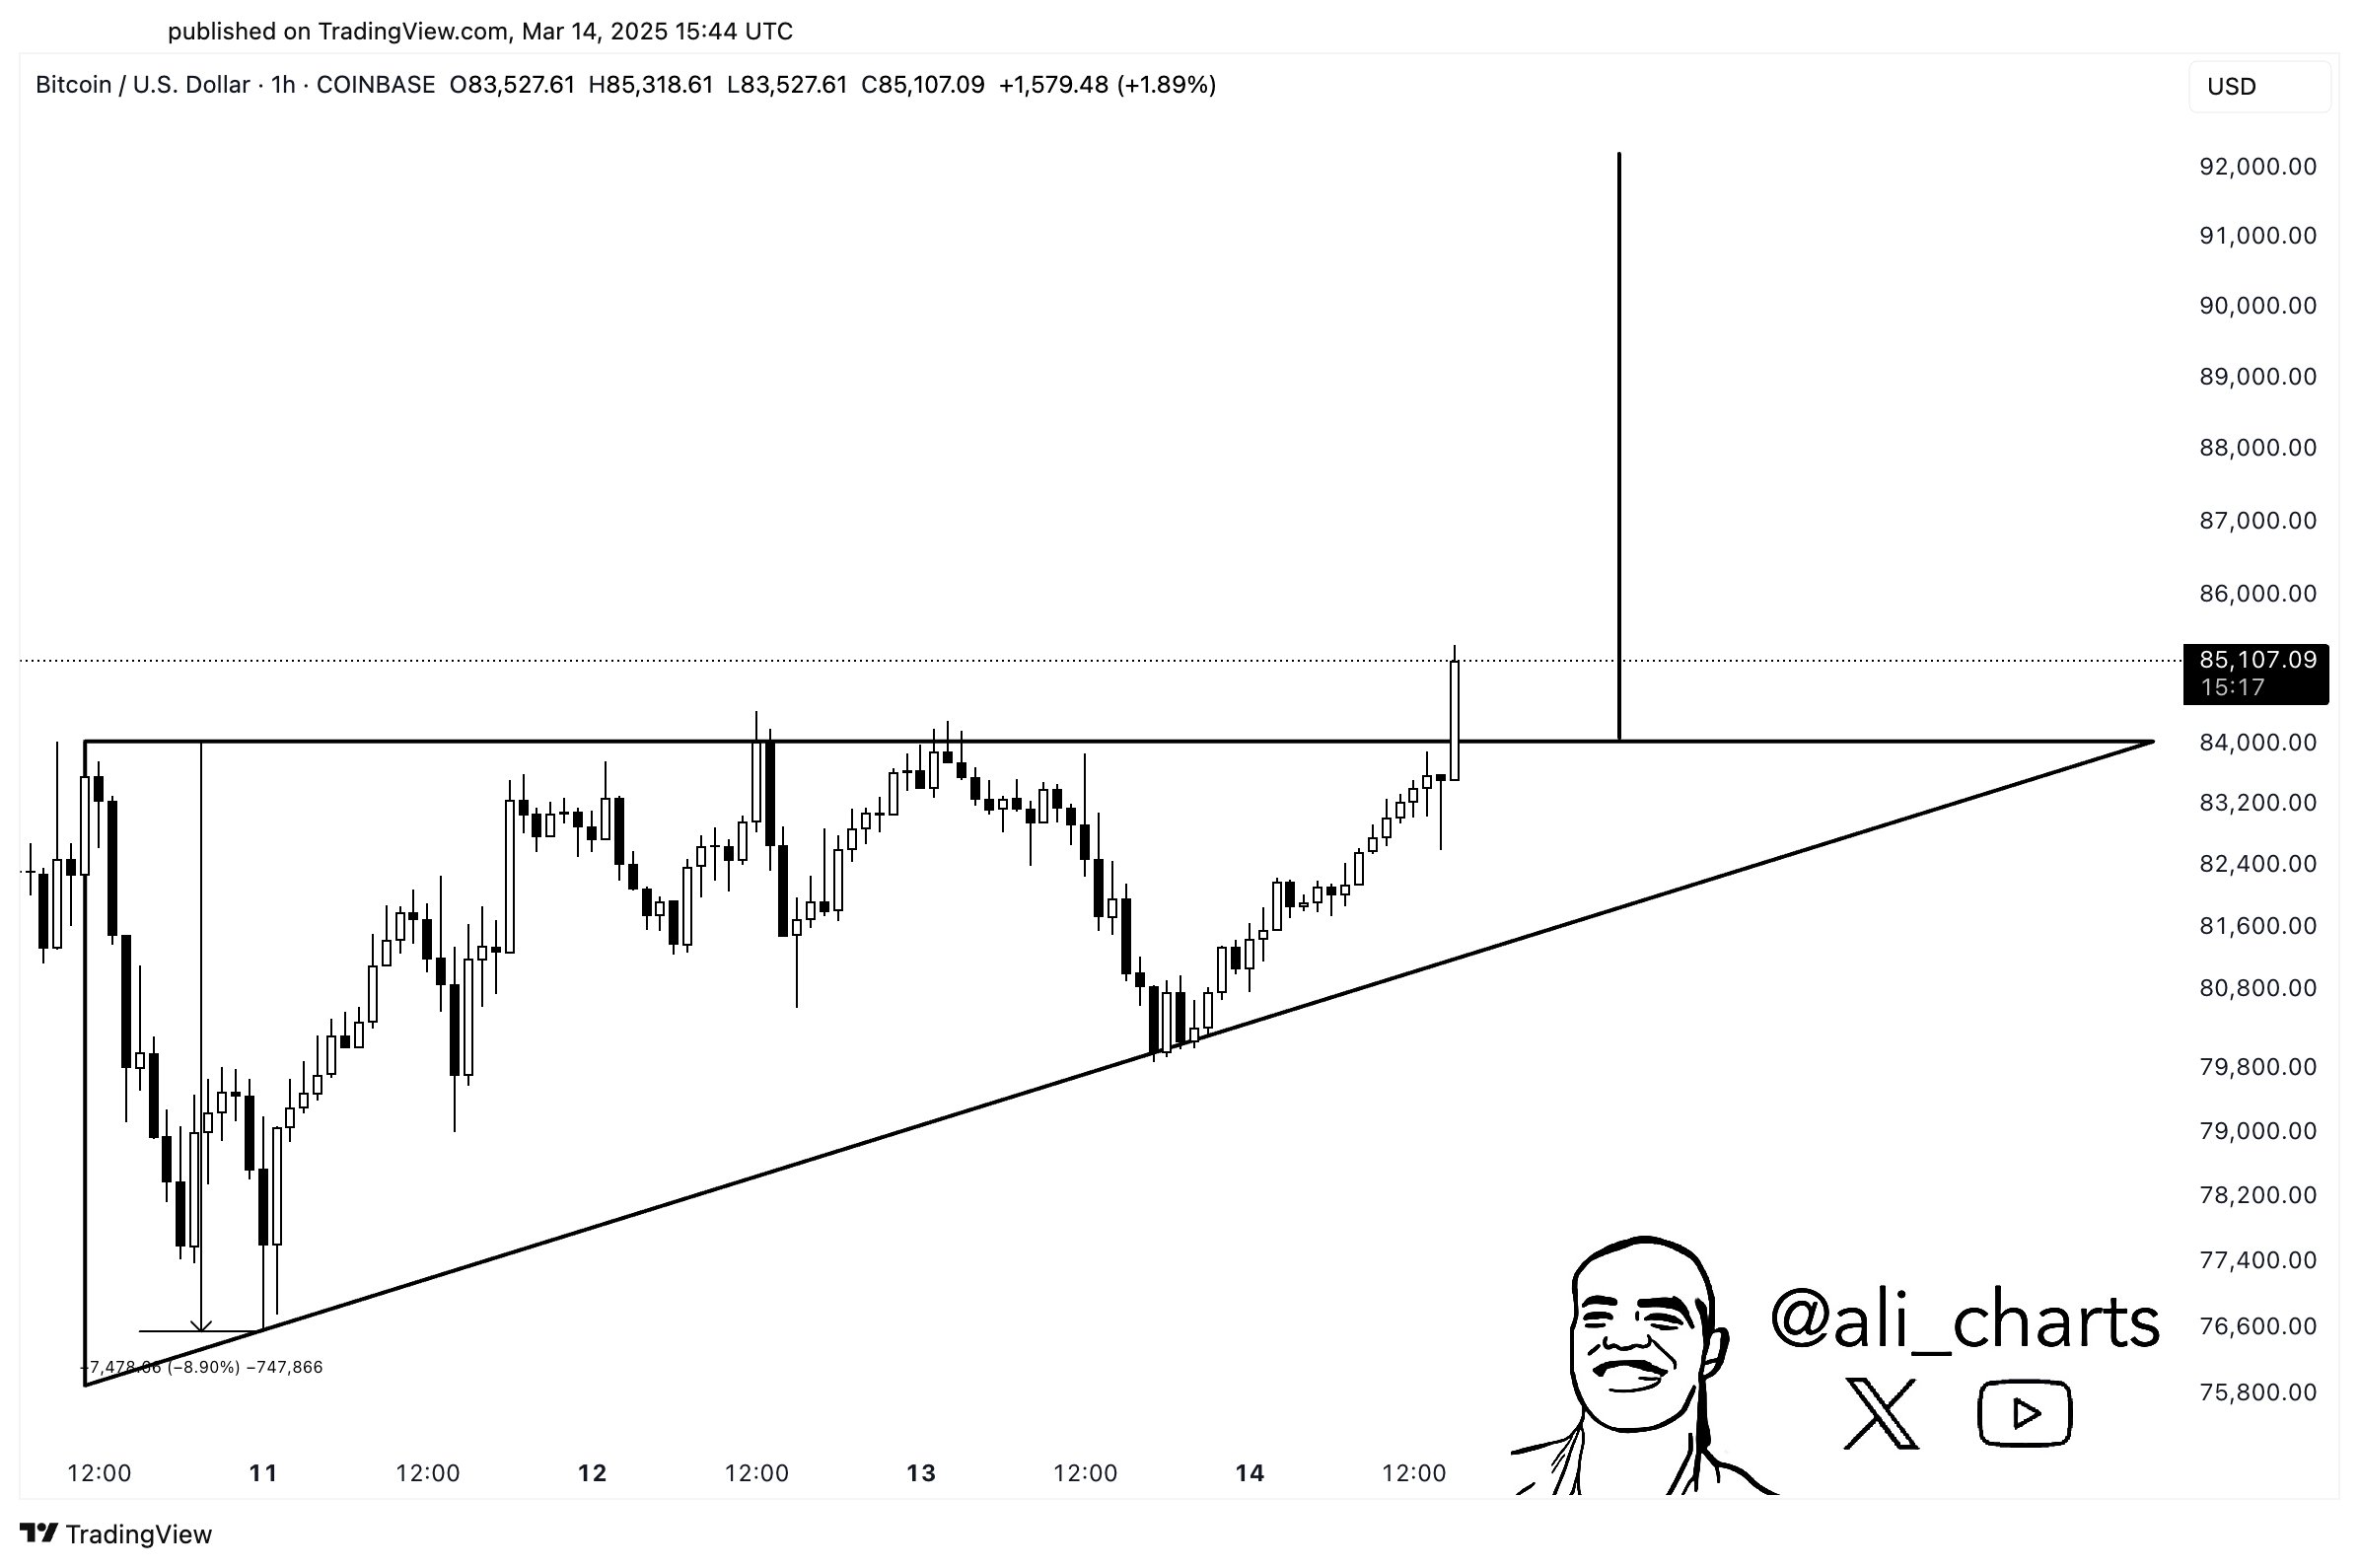
An ascending triangle pattern may be considered a bullish reversal structure if the asset soars above its horizontal resistance.
At time of writing, Bitcoin is trading for $84,288.
Turning to Ethereum rival Cardano, the analyst predicts rallies for ADA if the altcoin takes out the diagonal resistance of a triangle pattern at around $0.75.
“Cardano ADA is about to break free! Busting out of this triangle will trigger a 15% price move.”
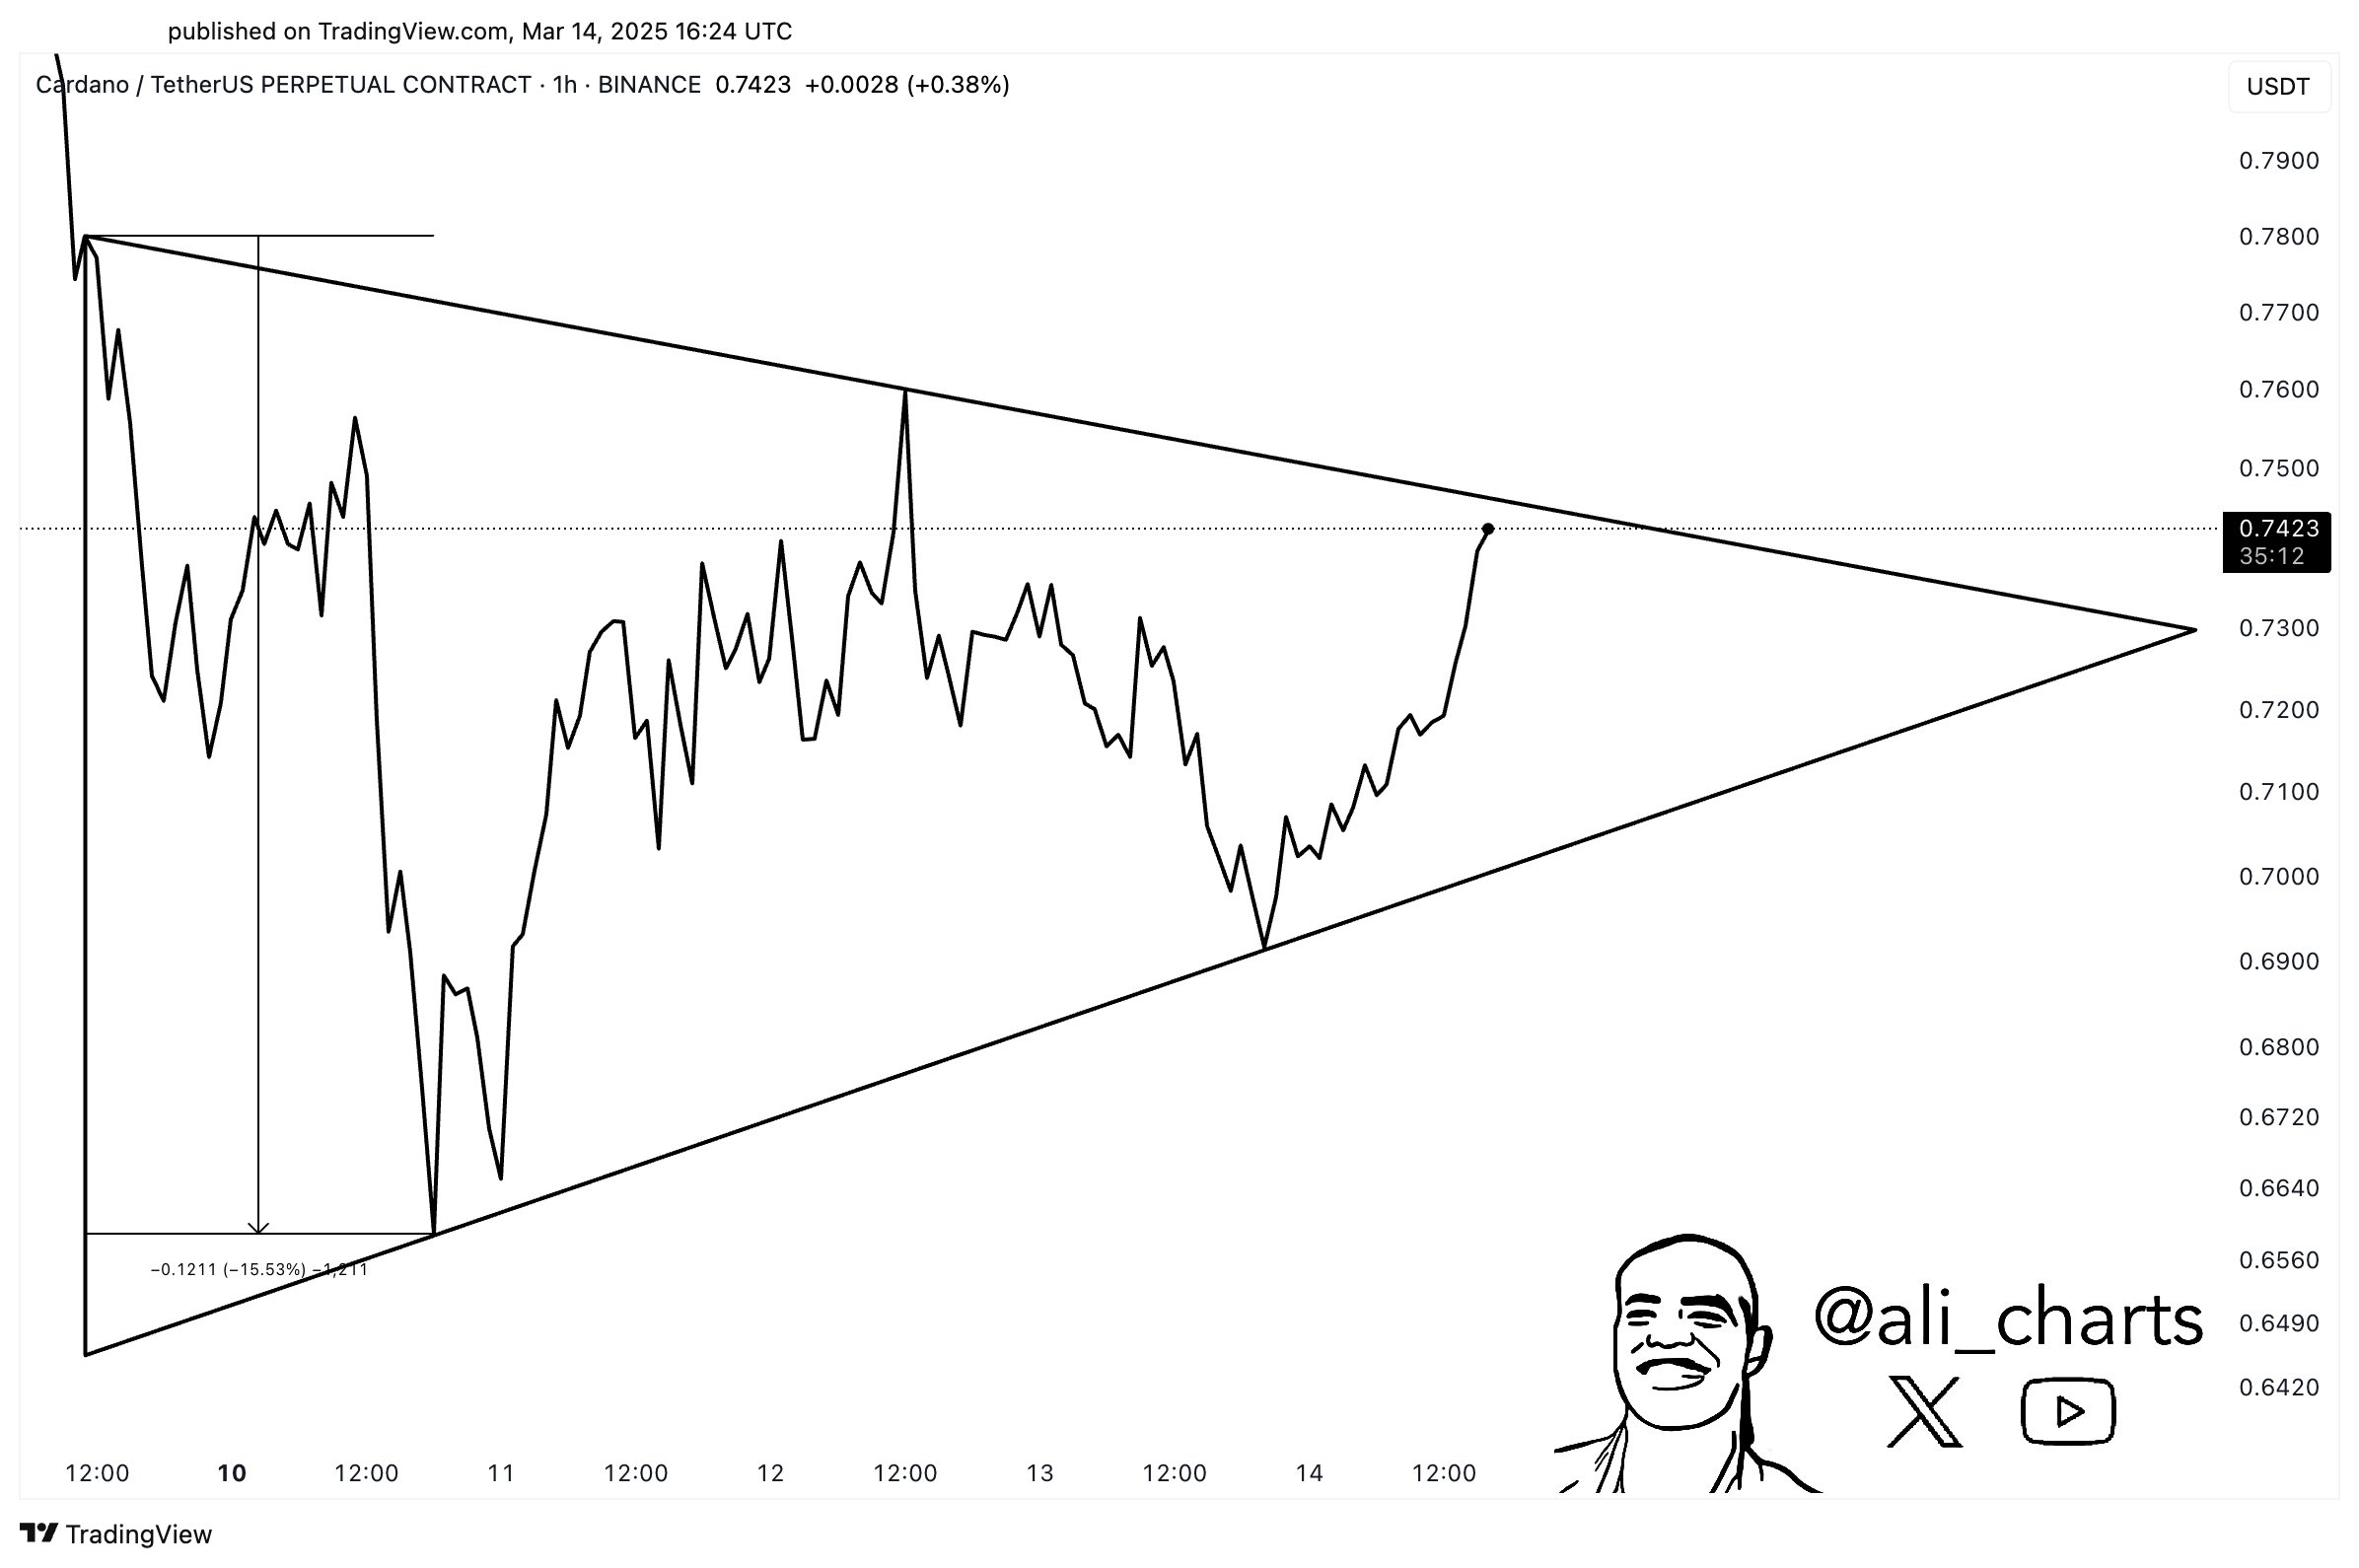
A triangle is typically viewed as a consolidation pattern as it signals a potential breakout in either direction. The asset is considered bullish if the price moves above the diagonal resistance and bearish if it tumbles below the diagonal trend line.
At time of writing, ADA is worth $0.744.
Follow us on X, Facebook and Telegram
Don’t Miss a Beat – Subscribe to get email alerts delivered directly to your inbox
Check Price Action
Surf The Daily Hodl Mix
 

Disclaimer: Opinions expressed at The Daily Hodl are not investment advice. Investors should do their due diligence before making any high-risk investments in Bitcoin, cryptocurrency or digital assets. Please be advised that your transfers and trades are at your own risk, and any losses you may incur are your responsibility. The Daily Hodl does not recommend the buying or selling of any cryptocurrencies or digital assets, nor is The Daily Hodl an investment advisor. Please note that The Daily Hodl participates in affiliate marketing.
Generated Image: Midjourney
Source link

Bitcoin’s price briefly crossed the $85,000 mark on Sunday, March 16, marking an 11% rebound from last week’s bottom of $76,000. Bullish traders have been deploying significant leverage positions on BTC ahead of the upcoming US Federal Reserve rate decision slated for March 19.
Bitcoin (BTC) Attempts $85,000 Recovery as Sellers Continue to Hold
After reaching an all-time high of $109,071 in January, Trump’s inauguration ushered in a pullback phase witch Bitcoin (BTC) experiencing a sharp decline of nearly 30%, hitting a low of $76,000 last week.
This downturn has been attributed to various factors, including geopolitical tensions following President Trump’s intervention in early March and recent US trade tariff announcements.

However, positive indicators from the US Consumer Price Index (CPI) and Producer Price Index (PPI) reports published last week have spurred a recovery. On March 16, BTC price briefly crossed the $85,000 mark, reflecting an 11.1% gain from the previous week’s low of $76,000 recorded on Tuesday, March 12.
This suggests that investor sentiment has improved significantly since the CPI data release on Wednesday, March 13, with many opting to hold their positions in anticipation of upcoming macroeconomic announcements.
What Fed Rate Outcomes Could Drive BTC to $100K?
The upcoming Federal Reserve decision on interest rates is a critical event for Bitcoin investors.
Historically, lower interest rates have led to increased liquidity in financial markets, often benefiting risk assets ranging from stocks to cryptocurrencies.
The next Federal Open Market Committee (FOMC) decision expected by Wednesday, March 19.
If the Fed signals a rate pause or hints at imminent cuts, it could boost investor confidence, potentially driving Bitcoin’s price toward the $100,000 mark.

Conversely, a hawkish stance with rate hikes could tighten liquidity, posing challenges for Bitcoin’s upward momentum.
However, based on recent data from CME Group, a majority of market watchers have priced in a 99% chance of a rate pause.
If this scenario plays out as expected, BTC price could see some upside in the aftermath of the official rate announcement, as often historically seen after less hawkish Fed decisions.
Bulls Established $1.9 Billion Dominance in Bitcoin Derivative Market
Having digested inflation-easing signals in the US CPI and PPI reports, with market watchers nearly ruling out the chances of a rate cut as previously feared, the majority of Bitcoin traders have priced in the rate pause decision and positioned trades accordingly.

In the derivatives market, bullish sentiment is evident. Over the last 7 days, bull traders have mounted long leverage positions amounting to $4.9 billion, while short leverage positions stand at $3.8 billion, giving bulls a net dominance of $1.1 billion.
BTC Outlook for the Week Ahead
This substantial long positioning indicates strong market confidence in Bitcoin’s future appreciation. However, it’s essential to monitor these leveraged positions closely, as sudden market shifts could lead to liquidations, amplifying price movements.
Given the 11% BTC price rebound over the past week, the anticipated Fed rate pause may have already been priced in, and many traders could capitalize on the announcement to execute a sell-the-news strategy.
In this scenario, BTC could see another downturn below the $80,000 mark, especially with long traders currently holding over-leveraged positions.
Bitcoin Price Forecast: Recovery in Play, but $100K Remains a Tough Target
Bitcoin price forecast chart below is showing signs of more upside potential after rebounding 11% from the recent $76,000 low, to reach $83,175 at press time. The bullish case for BTC price action new week is supported by a number of technical indicators, but the path to $100,000 remains uncertain as key resistance levels and market sentiment present challenges.
First, the Elliott Wave count suggests Bitcoin has completed a corrective leg down, aligning with the 1.618 Fibonacci extension at $76,555.

A bounce from this level indicates potential for a relief rally, with immediate targets at the 0.382 Fibonacci retracement level of $89,085, followed by $92,956 (0.5 retracement) and a stronger resistance near $96,827 at the 0.618 level.
Additionally, the Parabolic SAR indicator, currently at $97,068, further reinforces this zone as a pivotal area where bullish momentum could face major resistance.
However, bearish risks remain prominent. The volume profile shows declining buy-side momentum, suggesting a lack of strong conviction among bulls.
More so, the BBP (Bear/Bull Power) indicator remains deeply negative at -10,559, signaling that downward pressure is still in play. If Bitcoin fails to reclaim $89,000 convincingly, it could trigger another sell-off toward the $76,000 support level, potentially exposing the market to further downside.
For the week ahead, Bitcoin’s price action hinges on reclaiming $89,000. A decisive close above this level could fuel a rally toward $97,000, but failure to break above could see BTC revisiting $80,000 or lower.
Frequently Asked Questions (FAQs)
If the Fed signals a rate pause or future cuts, Bitcoin could rally. However, strong resistance levels and profit-taking may slow momentum.
BTC must reclaim $89,000 to sustain an uptrend. Resistance sits at $92,956 and $96,827, while support remains at $80,000 and $76,000.
Bulls hold a $1.1 billion net dominance in derivatives, but over-leverage increases liquidation risks, potentially leading to sharp price swings.
ibrahim
Crypto analyst covering derivatives markets, macro trends, technical analysis, and DeFi. His works feature in-depth market insights, price forecasts, and institutional-grade research on digital assets.
Disclaimer: The presented content may include the personal opinion of the author and is subject to market condition. Do your market research before investing in cryptocurrencies. The author or the publication does not hold any responsibility for your personal financial loss.
Source link
Reason to trust
![]()
Strict editorial policy that focuses on accuracy, relevance, and impartiality
Created by industry experts and meticulously reviewed
The highest standards in reporting and publishing
Strict editorial policy that focuses on accuracy, relevance, and impartiality
Morbi pretium leo et nisl aliquam mollis. Quisque arcu lorem, ultricies quis pellentesque nec, ullamcorper eu odio.
After dropping to less than $2 last March 11th, Ripple’s XRP springs back to life and it’s currently trading between $2.30 and $2.40. And with the US Securities and Exchange Commission vs Ripple case nearing its resolution, the market can expect more price volatility for this digital asset.
Related Reading
Within this context, market analyst Ali Martinez boldly claims that Ripple’s native coin still have the legs to hit a two-digit figure this cycle, using an extensive symmetrical triangle formation as a solid basis.
Martinez’s view runs opposite the bearish statements from other commentators. XRP has been on a slide lately, affected by the broader crypto fall, dipping by around 25% from its $3.40 high achieved mid-January.
XRP Gradually Builds Its Symmetrical Triangle
Like most cryptos, XRP continues to have a highly volatile market performance. The token attempted a recovery early this month but met resistance, leading to a steep decline on March 11th. Interestingly, a few commentators remain bullish on the altcoin, including Martinez, who sees the token on track to reach $15.
This is why $XRP can still reach $15! pic.twitter.com/vkIiR0rnpU
— Ali (@ali_charts) March 14, 2025
In his latest commentary, shared via a Twitter/X posting, Martinez highlighted the seven-year symmetrical triangle formed by this asset, which dates back to January 2018, when it dropped from its $3.80 high.
Even before Martinez shared this observation, several commentators reported the triangle’s formation, suggesting that a breakout could lead to a price run.
The Ascending Trendline
According to Martinez, XRP formed its lower highs in January 2018, extending the descending trendline on top. As the crypto witnessed higher lows during this time frame, it extended its ascending trendline below, creating a symmetrical triangle.
Interestingly, XRP exited the symmetrical triangle structure following the November US elections. Ripple’s native token surged by 280% for the month, marking the biggest 30-day increase for the asset in seven years.

Along with surprising traders, this breakout inspired fresh hope among XRP enthusiasts. While some experts noted that past breakouts do not automatically ensure continuous rallies, many saw this spike as evidence of possible long-term strength.
Still, the dramatic price fluctuation sparked conversations on XRP’s future, particularly in light of further government changes and more general market movements.
Ripple’s XRP is currently trading at $2.37, which is 2% up in the last seven days.
Related Reading
XRP Currently Retesting A Breakout
After two months of upside, Ripple’s XRP is on a downturn, reflecting the broader crypto market sentiment. According to Martinez, XRP’s price is currently retesting the triangle chart breakout. He also suggested that even if XRP slips below $2, it’s still on track for a breakout, as long as it stays above $1. Armed with the charts, Martinez believes that XRP hitting $15 is not a far-out idea.
Featured image from StormGain, chart from TradingView
Source link

SEC Commissioner Hester Peirce on the New Crypto Task Force
Solana Hits 400B Transactions, Nearly $1T in 5 Years

640,000 Chainlink (LINK) Withdrawn From Exchanges In 24 Hours – Bullish Accumulation?

Traders eye $2.80 Rally As Ripple Files New Trademark

Analyst Says Crypto Whales Loading Up on Ethereum, Accumulating $815,514,345 in ETH in Just Five Days

Bitcoin landfill man loses appeal, says he has one ‘last legal option’

Filmmakers Bet on Web3 to Fix Hollywood Film Financing

Mr. Wonderful says the crypto cowboy era is over. Really?

TON Token Surges 20% as Telegram Founder Recovers Passport From French Authorities

Can Bitcoin Reach $100K After the Upcoming US Fed Decision?

XRP Must Close Above This Level For Bullish Breakout: Analyst

Bitcoin reclaims $80K zone as BNB, TON, GT, ATOM hint at altcoin season

Stock Market To Witness Rallies in Next One to Two Weeks, Predicts Wall Street’s Cantor Fitzgerald – Here’s Why

Cryptocurrencies to watch this week: Binance Coin, Cronos, ZetaChain

What is Milady? The Edgy Ethereum NFT Community With Vitalik Buterin’s Support


 24/7 Cryptocurrency News4 months ago
Arthur Hayes, Murad’s Prediction For Meme Coins, AI & DeFi Coins For 2025

 Bitcoin2 months ago
Expert Sees Bitcoin Dipping To $50K While Bullish Signs Persist

 24/7 Cryptocurrency News2 months ago
Aptos Leverages Chainlink To Enhance Scalability and Data Access

 Bitcoin4 months ago
Bitcoin Could Rally to $80,000 on the Eve of US Elections

 Altcoins2 months ago
Sonic Now ‘Golden Standard’ of Layer-2s After Scaling Transactions to 16,000+ per Second, Says Andre Cronje

 Bitcoin4 months ago
Institutional Investors Go All In on Crypto as 57% Plan to Boost Allocations as Bull Run Heats Up, Sygnum Survey Reveals

 Opinion4 months ago
Crypto’s Big Trump Gamble Is Risky

 Price analysis4 months ago
Ripple-SEC Case Ends, But These 3 Rivals Could Jump 500x

✓ Share: