Price analysis
Can Stellar Price Hit $1 before XRP Tags ATH?
Published
5 months agoon
By
admin
Stellar price has erased some of the gains made last month. This decline has mirrored that of Ripple, which has also moved into a short-term retracement as traders take profits. So, can the XLM price jump to $1 before XRP jumps to an all-time high?
Stellar Price Analysis: Technicals Point To a Strong Rebound
The XLM price has dropped by about 32% from its highest level this year, mirroring that of most altcoins. Still, there are rising odds that the coin will bounce back in the next few days.
The daily chart shows that the Stellar price has found support at the 50% Fibonacci Retracement level. It has also remained above the 50-day moving average, a sign that bulls are still in control.
Stellar has formed a hammer candlestick pattern, which is characterized by a small body and a long lower shadow. In most periods, this is one of the most bullish candlestick patterns in the market.
There are also signs that the recent Stellar price retreat is part of the formation of the correction wave of Elliot Wave. This pattern usually ends with a strong bullish breakout, which will likely happen.
So, will the XLM price jump to $1? Odds are that the coin will ultimately jump to $1 in this bullish cycle. For this to happen, Stellar price needs to first rebound and move to the year-to-date high of $0.6385. A move above that point will send a signal that there are still more buyers available in the market, keen to push it to $1.
A move to $1 implies a 130% increase from the current level. This is achievable since the coin rallied by almost 500% in November.


A drop below the support at $0.3642, the 50% retracement point, will invalidate the bullish view. It will be a confirmation that the coin has moved to the markdown phase of the Wyckoff Method.
XRP Rally to Fuel XLM Price
A likely catalyst for the XLM price will be the performance of Ripple price. Historically, these two cryptocurrencies have a close correlation because they are both in the cross-border payments industry. Jed McCaleb, Stellar’s founder, is one of Ripple’s co-founders.
Analysts believe that the Ripple price, which crossed the key resistance at $1 recently, could jump to as high as 5 in this cycle and $18 in the long term. A key catalyst for this rally will be the upcoming RLUSD launch.
If these forecasts are accurate, then there are chances that Ripple will jump, and then XLM will do much better. For example, XLM price outperformed Ripple during their recent bull run.
Frequently Asked Questions (FAQs)
Yes, the coin needs to rally by 133% from the current level to hit $1. Such a price action is possible if the crypto rally intensifies.
The potential catalyst for Stellar lumens will be developments surrounding Ripple. If the XRP price resumes the uptrend, there is a likelihood that the XLM will follow and do better.
This rally is mostly because of the ongoing crypto bull run and its ecosystem growth. For example, the total value locked in its DeFi ecosystem has jumped to a record high.
crispus
Disclaimer: The presented content may include the personal opinion of the author and is subject to market condition. Do your market research before investing in cryptocurrencies. The author or the publication does not hold any responsibility for your personal financial loss.
Source link
You may like


From Booze to Barbells: Exercise May Offset Risks of College Partying


Ethereum Foundation shuffles leadership, splits board and management


Bitcoin Price (BTC) Retakes $95K Level After Early U.S. Decline


A New Risk For The Industry?


Justin Sun Bets Big On JUST Token, Sees 100x Potential


Worldcoin price prediction | What’s next for WLD price?
Price analysis
Falling Wedge Pattern Confirms $264 target
Published
1 day agoon
April 27, 2025By
admin
Solana price action remains firm near $150, backed by increasing institutional interest and strategic investments positioning SOL for a major breakout.
Solana (SOL) Holds $150 Support as Bulls Eye More Upside
Solana entered the final weekend of April trading in a tight range but managed to maintain its critical $150 support level.
As of Sunday, April 27, SOL traded between $145.97 and $150.04, before settling at $149.98, at press time with a mild 0.6% daily gain.


According to Coingecko, SOL price currently posts 9.9% gain over the last seven days and a 14% rally over the past month, outperforming both Bitcoin and Ethereum on the weekly timeframe.
Market capitalization currently stands near $68 billion, securing Solana’s position as the sixth-largest cryptocurrency by total market value.
Trading volumes have remained steady above $2.2 billion, suggesting steady demand despite cautious market sentiment at the weekend.
Solana’s year-to-date gain sits at 15.8%, bolstered by a combination of faster network adoption, positive SOL ETF speculation, and the rapid expansion of decentralized finance (DeFi) projects on its blockchain.
The sustained defense of the $150 level signals that bulls are preparing for another leg higher. A clean breakout above $155 could open the door toward new peaks above $250 as Q2 2025 unflods.
DeFi Development Company Files $1 Billion Shelf Offering to Fuel Solana Investments
Even as Solana struggles to firmly clear the $150 resistance zone, fundamental news flow continues to paint a highly bullish picture.
On Friday, the DeFi Development Company (formerly Janover), trading under the ticker JNVR, filed a $1 billion shelf offering with the U.S. Securities and Exchange Commission.
The move allows the company to issue equity, debt, or other instruments over time to fund strategic investments, notably including Solana asset accumulation and validator expansion.
Shelf offerings allow companies to register large amounts of securities upfront without selling them all immediately, giving DeFi Development Company flexibility to scale its Solana exposure when market conditions are favorable.
“We may sell any combination of these securities in one or more offerings, at prices and on terms to be determined prior to the time of the offering, with an aggregate offering price of up to $1,000,000,000,”
- DeFi Development Company (formerly Janover)
DeFi Development Company’s (DDC) transition toward a Solana-focused investment vehicle mirrors Michael Saylor’s Bitcoin strategy but with important differences.
Beyond simply acquiring SOL, DDC and peers like Canada-based Sol Strategies and Upexi are also spinning up validators, actively staking their holdings, and turning Solana into a yield-generating treasury asset.
This move could significantly tighten SOL supply available to be traded on exchanges and amplifying price rallies during periods of high market demand.
As of April 27, the DDC already holds around $34.4 million worth of SOL and intends to expand its position aggressively once SEC approval is granted. Shares of Janover (JNVR) were up nearly 5% on the news, signaling positive market reception to the plan.
As more public companies embrace Solana’s staking protocol, SOL’s price outlook for Q2 2025 appears increasingly skewed positive.
Solana Price Forecast: Falling Wedge Pattern Confirms $264 target
Solana price appears poised for further gains after breaking out of a falling wedge formation. Following 12% gains last week, Solana’s the technical indicator highlight a major upside target near $264.
After consolidating below the $150 for the better part of the last 48 hours, Solana price forecast today shows growing bullish momentum.


As seen in the chart below, SOL is holding steady above its 50-day simple moving average (SMA) at $129.89 and closing in on the 100-day SMA at $161.94. The resilience above $145 suggests a supportive base is forming even as market volumes decline.
The BBP oscillator, printing at 10.58, reflects ongoing bullish energy, although the recent moderation hints at a brief pause before further advances.
Should buyers overcome the $161 resistance, the falling wedge pattern confirms that a potential rally toward the $264 territory. On the downside, failure to defend the $140 support, could invite a retest of prior support near $130.
Frequently Asked Questions (FAQs)
Solana’s $150 support is backed by strong institutional demand, ETF speculation, and growing DeFi adoption on its network.
A clean breakout above $155 resistance, combined with strategic investments and staking, could open a path toward $250 and beyond.
DeFi Development Company are buying SOL, spinning up validators, and turning Solana into a yield-generating treasury asset.
ibrahim
Crypto analyst covering derivatives markets, macro trends, technical analysis, and DeFi. His works feature in-depth market insights, price forecasts, and institutional-grade research on digital assets.
Disclaimer: The presented content may include the personal opinion of the author and is subject to market condition. Do your market research before investing in cryptocurrencies. The author or the publication does not hold any responsibility for your personal financial loss.
Source link
Markets
Top cryptocurrencies to watch: Pi Network, XRP, Sui
Published
1 day agoon
April 27, 2025By
admin
Cryptocurrency prices rallied last week as U.S. President Donald Trump said, without citing examples, that trade talks with other countries were taking place.
Bitcoin (BTC) jumped above $95,000 for the first time in over a month, while the market cap of all Solana (SOL) meme coins jumped to over $10 billion. This article explains why Pi Network (PI), Ripple (XRP), and Sui (SUI) are the top cryptocurrencies to watch this week.
Sui token unlock could disrupt the rally
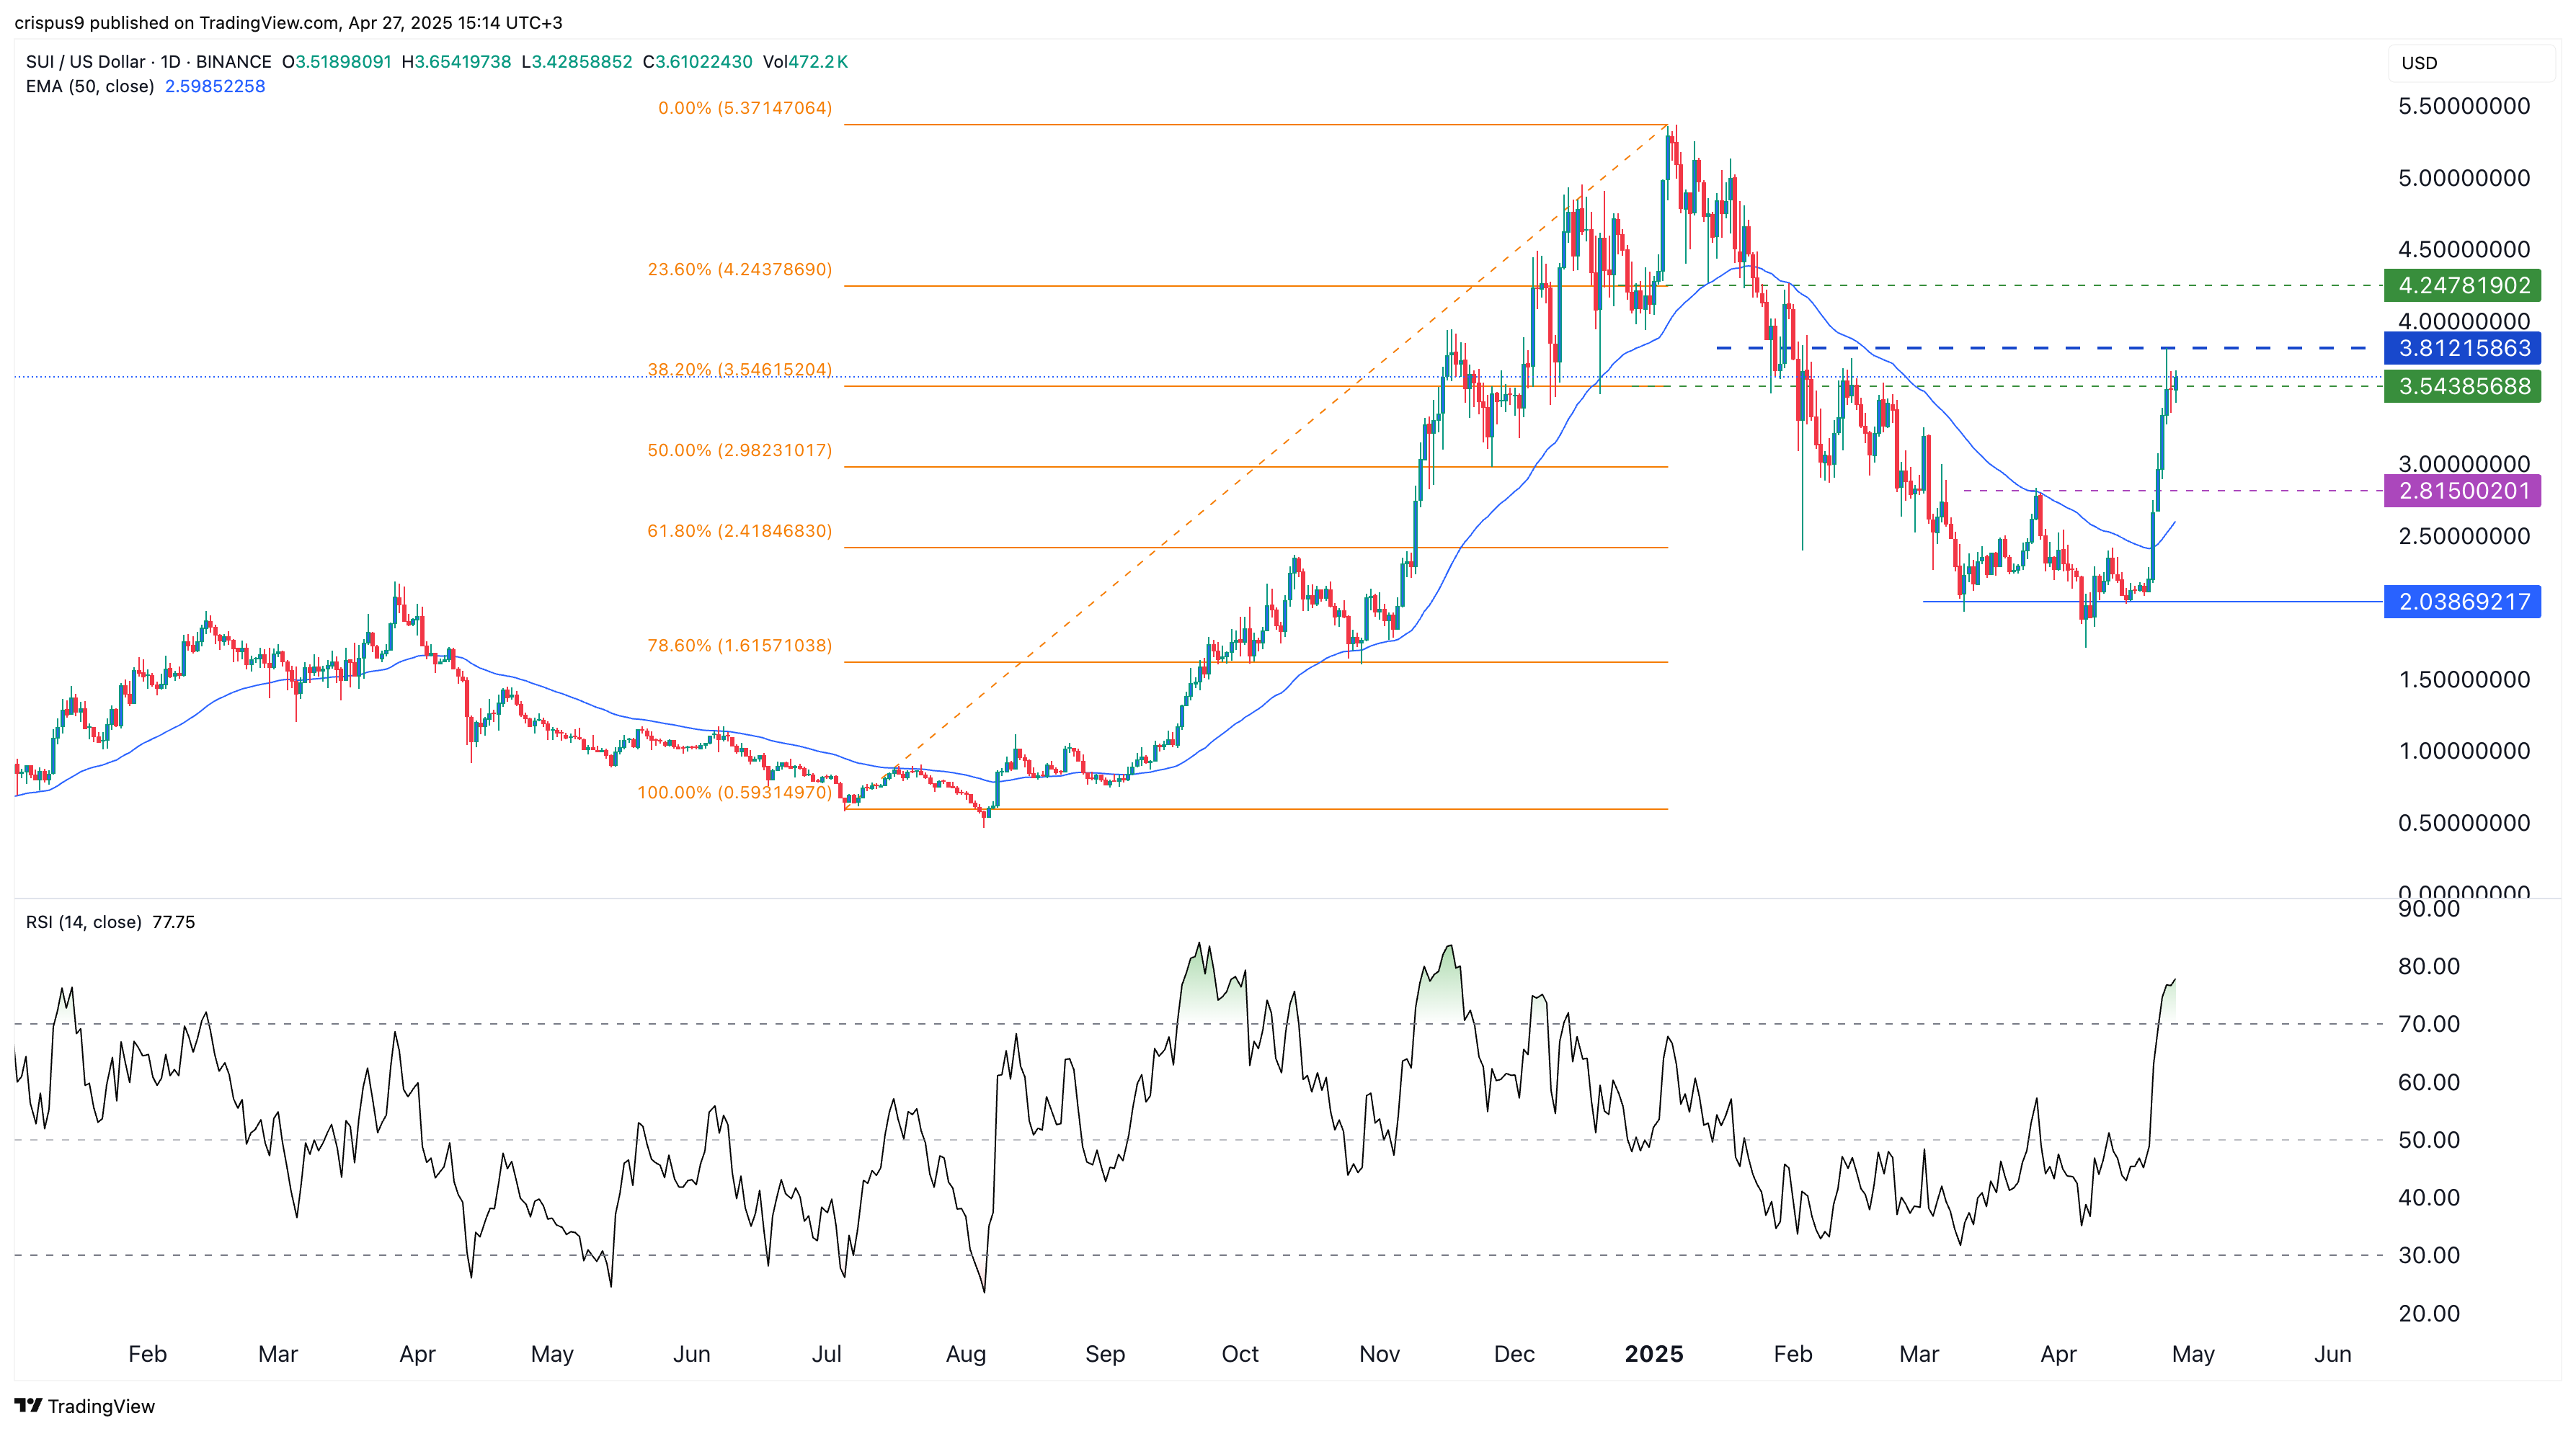
Sui, a top layer-1 network, was one of the top-performing coins in the crypto industry as it jumped to $3.8, its highest level since Feb. 1, and up by 110% from its lowest level this month.
It rallied as top meme coins in its ecosystem surged, resulting in a 60% increase in weekly DEX volume. Protocols in its platform handled over $3.43 billion in volume in the last 7 days, bringing the monthly transactions to over $11 billion.
Sui’s surge may be disrupted by a big token unlock scheduled for Thursday. The network will release tokens worth $120 million. Token unlocks lead to dilution, often affecting a coin’s performance.
The daily chart also shows that the SUI price has become overbought as the Relative Strength Index has moved to 77. Therefore, the coin is likely to retreat and retest the key support at $2.8150, the neckline of the double-bottom pattern at $2.

XRP price sits at a key level
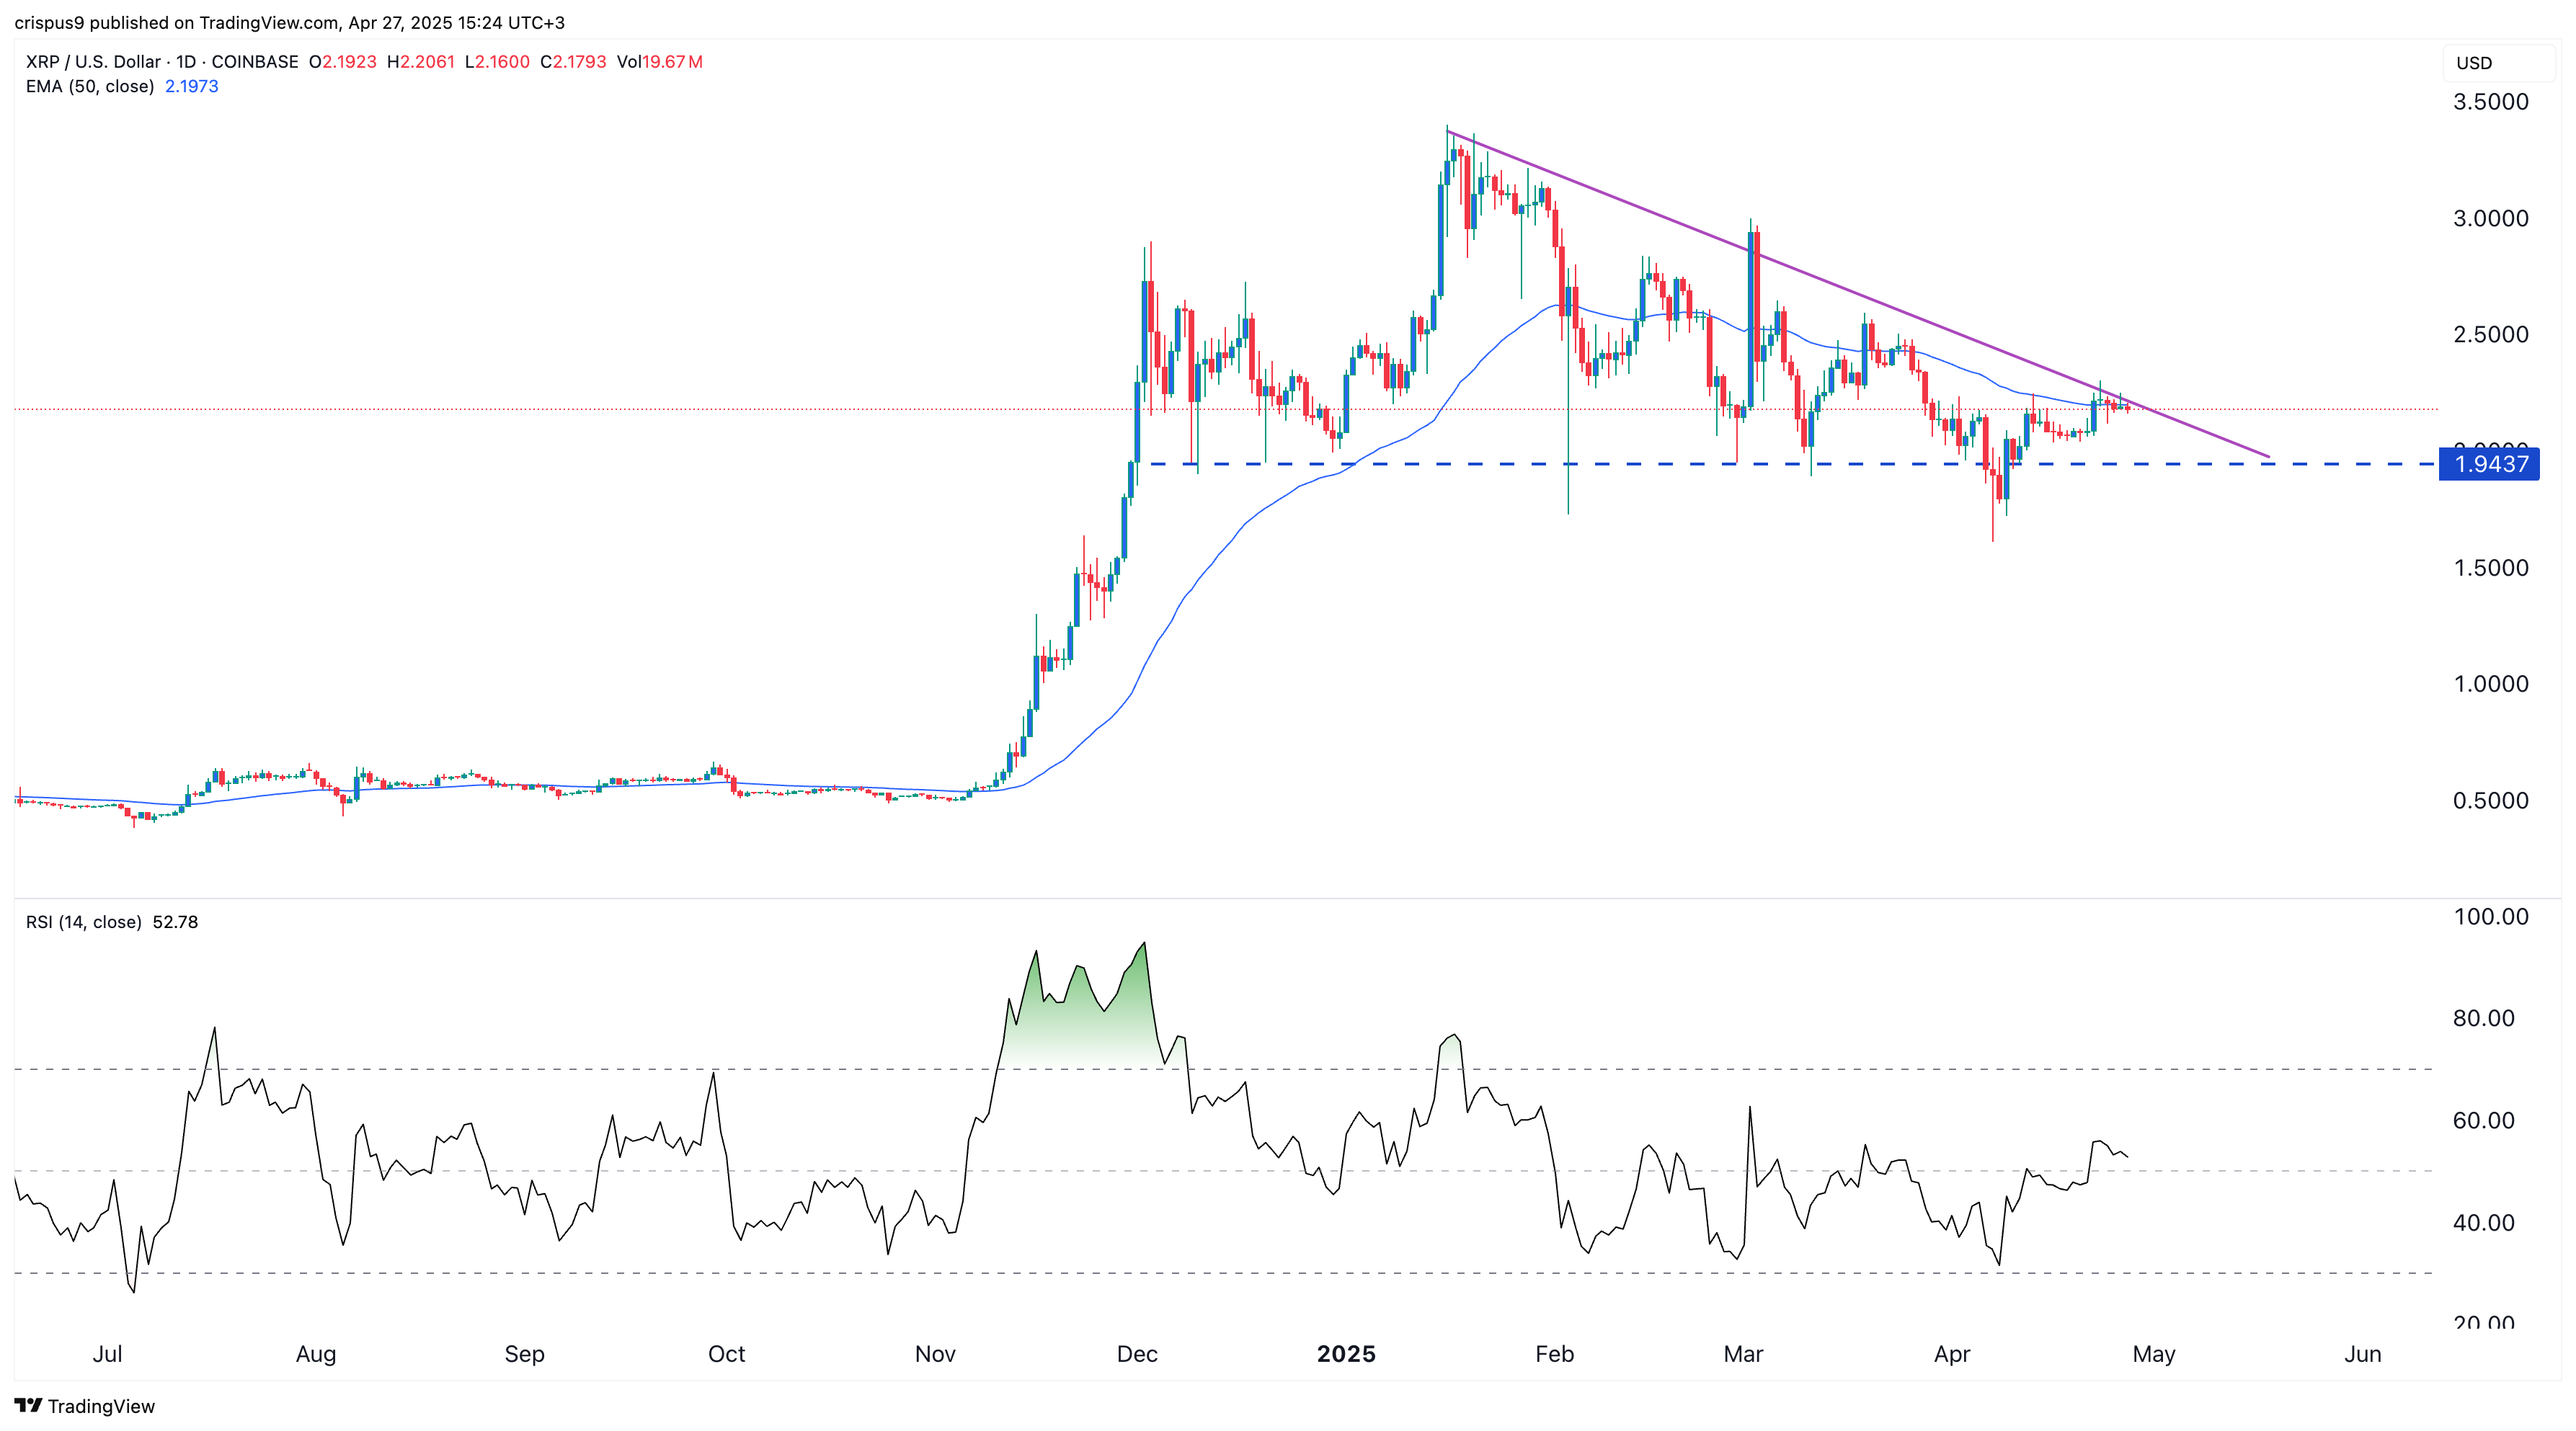
Because of its technicals, Ripple’s token will be in the spotlight this week. The chart below shows that the XRP price was trading at $2.17 on Sunday, a notable level for two reasons. First, it is along the 50-day Exponential Moving Average, which has provided substantial resistance in the past few months.
Second, the price is along the descending trendline connecting the highest levels since January 16. This trendline is the upper side of the descending triangle, whose lower side is at $1.9437.
A descending triangle is a popular bearish chart pattern. Therefore, the coin will need to rise above the slanted trendline and the 50-day moving average to invalidate the bearish outlook of the triangle.

Pi Network: Will the consolidation end?
Pi Network will be a top cryptocurrency to watch this week as its consolidation continues. It has remained at $0.6350 in the past few weeks, and it did not participate in last week’s crypto recovery.
Therefore, this consolidation may be calm before the storm since all Pi needs is a minor catalyst, and its price will go parabolic. A potential catalyst will be an exchange listing by one or more tier-one companies. HTX, a top exchange that is advised by Justin Sun, has been sending hints that it will list it soon. For example, Pi Network has appeared on several X posts, including the one shown below and this one.
Other top cryptocurrencies to watch this week include Cetus Protocol, Maverick Protocol, Optimism, Pendle, and Morpho, which will have token unlocks, and BSC will launch the Lorentz upgrade.
Source link
ETH Price
5 Cardano Rivals to Watch as Founder Predicts Ethereum Will Die by 2040
Published
2 days agoon
April 27, 2025By
admin
Cardano rivals like Avalanche, Solana, Polkadot, NEAR, and Algorand are gaining market share as Ethereum faces scalability challenges.
Cardano (ADA) Tops $0.70 as Founder Predicts Ethereum Collapse
Cardano (ADA) recorded a weekly gain of 12.2%, closing above $0.70 on April 26 — its highest since February 2025.
The move follows public remarks by Cardano founder Charles Hoskinson, who stated during a CNBC interview that Ethereum’s scalability and governance limitations are likely to undermine the network within the next 15 years.


Hoskinson, an original co-founder of Ethereum, highlighted issues around layer-2 reliance, decentralization trade-offs, and ecosystem fragmentation as critical vulnerabilities.
“Without fundamental reform, Ethereum risks disintegration by 2040,” Hoskinson said, citing longstanding market concerns regarding the network’s technical roadmap.
Ethereum’s transition toward rollups and modular scaling, including recent updates such as Dencun, has not eliminated bottlenecks related to cost and throughput.
These factors has seen Cardano rivals like Solana, Avalanche and a handful of others gain ground on Ethereum in recent weeks.
Cardano Rivals to Watch if Ethereum Collapses by 2040
Notably, Charles Hoskinson founding member of Ethereum before exiting to found Cardano. Hence its unsuprisingly that his prediction of Ethereum’s collapse weighs heavy on market sentiment.
If Ethereum continues to lose market share, Avalanche, Solana, Polkadot, NEAR Protocol, and Algorand are some 5 Cardano rivals to watch in the months ahead, based on recent price trends, ETF filings and institutional demand for these assets.
Avalanche (AVAX)


Avalanche’s high transaction throughput, customisable subnets, and enterprise integrations strengthen its case as a scalable smart-contract platform.
Solana (SOL)


Solana ETF applications by Franklin Templeton, Grayscale, and VanEck remain under SEC evaluation, with decision deadlines in October 2025 according to Bloomberg chief ETF analyst Eric Balchunas.
Solana’s fast transactions through-put and growing decentralized finance (DeFi) traction continues to drive institutional and developer interest.
Polkadot (DOT)


NEAR Protocol (NEAR)


Algorand (ALGO)


In summary:
Hoskinson’s assessment of Ethereum’s future emphasizes growing concerns surround the long-term viability of the pioneer smart-contract blockchain network. Despite a leadership shuffle at the Ethereum Foundation in early March 2025, key on-chain benchmarks like scalability, governance, and decentralization resilience remain clouded under pesimism.
As regulatory clarity improves and technological differentiation widens, Cardano rivals like platforms like Avalanche, Solana, Polkadot, NEAR, and Algorand, able to meet those demands are expected to gain market share.
Frequently Asked Questions (FAQs)
Hoskinson predicts Ethereum’s scalability, governance issues, and reliance on layer-2 solutions will undermine its viability within 15 years.
Avalanche, Solana, Polkadot, NEAR Protocol, and Algorand are top contenders to gain market share if Ethereum collapses by 2040.
ETF filings forAvalanche, Solana, Polkadot, NEAR, and Algorand signal growing institutional interest and acceptance, which could drive prices higher.
ibrahim
Crypto analyst covering derivatives markets, macro trends, technical analysis, and DeFi. His works feature in-depth market insights, price forecasts, and institutional-grade research on digital assets.
Disclaimer: The presented content may include the personal opinion of the author and is subject to market condition. Do your market research before investing in cryptocurrencies. The author or the publication does not hold any responsibility for your personal financial loss.
Source link

From Booze to Barbells: Exercise May Offset Risks of College Partying

Ethereum Foundation shuffles leadership, splits board and management

Bitcoin Price (BTC) Retakes $95K Level After Early U.S. Decline

A New Risk For The Industry?

Justin Sun Bets Big On JUST Token, Sees 100x Potential

Worldcoin price prediction | What’s next for WLD price?

Bitcoin Is About To Begin Outperforming Gold, Says InvestAnswers – Here’s His Timeline

Bloomberg Analyst Confirms No Set Launch Date for ProShares XRP ETFs

What is Base? The Ethereum Layer-2 Network Launched by Coinbase

Loopscale hacker in talks to return stolen crypto

Bitcoin (BTC) Yield Platform Coming From Coinbase (COIN), Aspen Digital

The Emerging Market For State Services Via Citizen X

XRP Price Shoots For 20% Surge To $2.51 Amid Pullback To Breakout Zone

Stocks edge higher ahead of big earnings week

Here’s How Bitcoin Could Boost Demand for US Treasuries, According to Macro Guru Luke Gromen

Arthur Hayes, Murad’s Prediction For Meme Coins, AI & DeFi Coins For 2025

Expert Sees Bitcoin Dipping To $50K While Bullish Signs Persist

3 Voting Polls Show Why Ripple’s XRP Price Could Hit $10 Soon

Aptos Leverages Chainlink To Enhance Scalability and Data Access

Bitcoin Could Rally to $80,000 on the Eve of US Elections

Crypto’s Big Trump Gamble Is Risky

The Future of Bitcoin: Scaling, Institutional Adoption, and Strategic Reserves with Rich Rines

Institutional Investors Go All In on Crypto as 57% Plan to Boost Allocations as Bull Run Heats Up, Sygnum Survey Reveals

Sonic Now ‘Golden Standard’ of Layer-2s After Scaling Transactions to 16,000+ per Second, Says Andre Cronje

Ripple-SEC Case Ends, But These 3 Rivals Could Jump 500x

Has The Bitcoin Price Already Peaked?

A16z-backed Espresso announces mainnet launch of core product

Xmas Altcoin Rally Insights by BNM Agent I

Blockchain groups challenge new broker reporting rule

I’m Grateful for Trump’s Embrace of Bitcoin
Trending

 24/7 Cryptocurrency News6 months ago
Arthur Hayes, Murad’s Prediction For Meme Coins, AI & DeFi Coins For 2025

 Bitcoin3 months ago
Expert Sees Bitcoin Dipping To $50K While Bullish Signs Persist

 Ripple Price1 month ago
3 Voting Polls Show Why Ripple’s XRP Price Could Hit $10 Soon

 24/7 Cryptocurrency News4 months ago
Aptos Leverages Chainlink To Enhance Scalability and Data Access

 Bitcoin6 months ago
Bitcoin Could Rally to $80,000 on the Eve of US Elections

 Opinion6 months ago
Crypto’s Big Trump Gamble Is Risky

 Bitcoin6 months ago
Institutional Investors Go All In on Crypto as 57% Plan to Boost Allocations as Bull Run Heats Up, Sygnum Survey Reveals

 Bitcoin3 months ago
The Future of Bitcoin: Scaling, Institutional Adoption, and Strategic Reserves with Rich Rines


✓ Share: