meme coin
Capybara is down by nearly 30% in 24-hour trading
Published
5 months agoon
By
admin
The Capybara token has gone down by 29.2% in the past 24-hours of trading, despite the Solana-powered token having soared through the week at 76%.
In the past day, the Capybara(CAPY) token has slid down by 29.2% according to data from crypto.news. The animal-themed token is currently trading hands at $0.002478.
Despite the downhill slope it is currently in, CAPY has been on an upward trend in the past seven days, with its price going up by nearly 80%. The Solana-based token has even seen a 121.87% in the past month, but it seems its rally has come to an end.

The token featuring the adorable South America-native rodent has had an experience quite similar to other animal-themed meme coins such as MOODENG(MOODENG). Just a few days ago on Nov. 22, CAPY went through a meteoric rise, reaching a new all-time-high of $0.0191521. But the token has since struggled to climb back up to its peak.
At the time of writing, the Capybara token’s trading volume stands at $4,538, decreasing by more than 50% compared to the previous day. Though, the token does not have a visible market cap, therefore it is nowhere near the cryptocurrency rankings. Not only that, CAPY also does not have any tokens on its circulating supply, despite its total supply amounting to 1 billion tokens.
On X, CAPY is being tweeted almost every minute along with other meme coins like CATI, HMSTR, DUCKS and DOGS. Most of these tweets seem to be automatically generated by bots using random accounts.
On the official website, Capybara World, the CAPY token is described as a community-driven token inspired by “the most peaceful animal in the world.” The Capybara token was launched in Dec. 2021, available for trading on Raydium and dexlab.
Over the years, the capybara has become one of the internet’s favorite animals. According to the South China Morning Post, there has been an influx of capybara content on various social media platforms like Instagram, TikTok and YouTube. The capybara is known for its laid-back and serene demeanor, becoming a symbol of peace and tranquility.
Source link
You may like


Here’s why AI tokens FET, AIC, Render, WLD, TAI are soaring


The $89 OmiGPT Aims to Be a Smarter AI Wearable


Uniswap Founder Urges Ethereum To Pursue Layer 2 Scaling To Compete With Solana


Slovenia Moves to Tax Crypto Profits at 25%


‘Crypto is not communism’ — Exec slams BIS’ take on crypto


Bitcoin Battles Triple Resistance As Price Rejection Persists.
Markets
Popcat price surges as exchange reserves fall, profit leaders hold
Published
7 days agoon
April 13, 2025By
admin
Popcat, a top Solana meme coin, has staged a strong comeback as investors bought the dip and exchange reserves dropped.
Popcat (POPCAT) rose for four consecutive days, reaching a high of $0.25, its highest level since March 25. It has jumped by almos 100% from its lowest level this month.
The jump happened as crypto investors bought the dip in some specific Solana (SOL) meme coins like Fartcoin (FARTCOIN), Goatseus Maximus, Fartboy, and Vine.
Nansen data shows that more investors are moving their Popcat tokens from exchanges to self-custody. Exchange balances have dropped by almost 10% in the last seven days to 239.5 million, down from 262 million the same day last week. Most of these outflows were from Bybit, Raydium, and Coinbase.
The weekly supply of Popcat tokens on exchanges dropped by 2.3% to 24%. Falling exchange reserves is a bullish sign, signaling that more investors are taking a long-term view of the coin and are not dumping their tokens.
More data shows that the most profitable Popcat traders in the last seven days are not selling. The top trader has made a profit of $173,000 and still holds 97% of his position. The chart below shows that many of these traders still hold their tokens.

Popcat price analysis

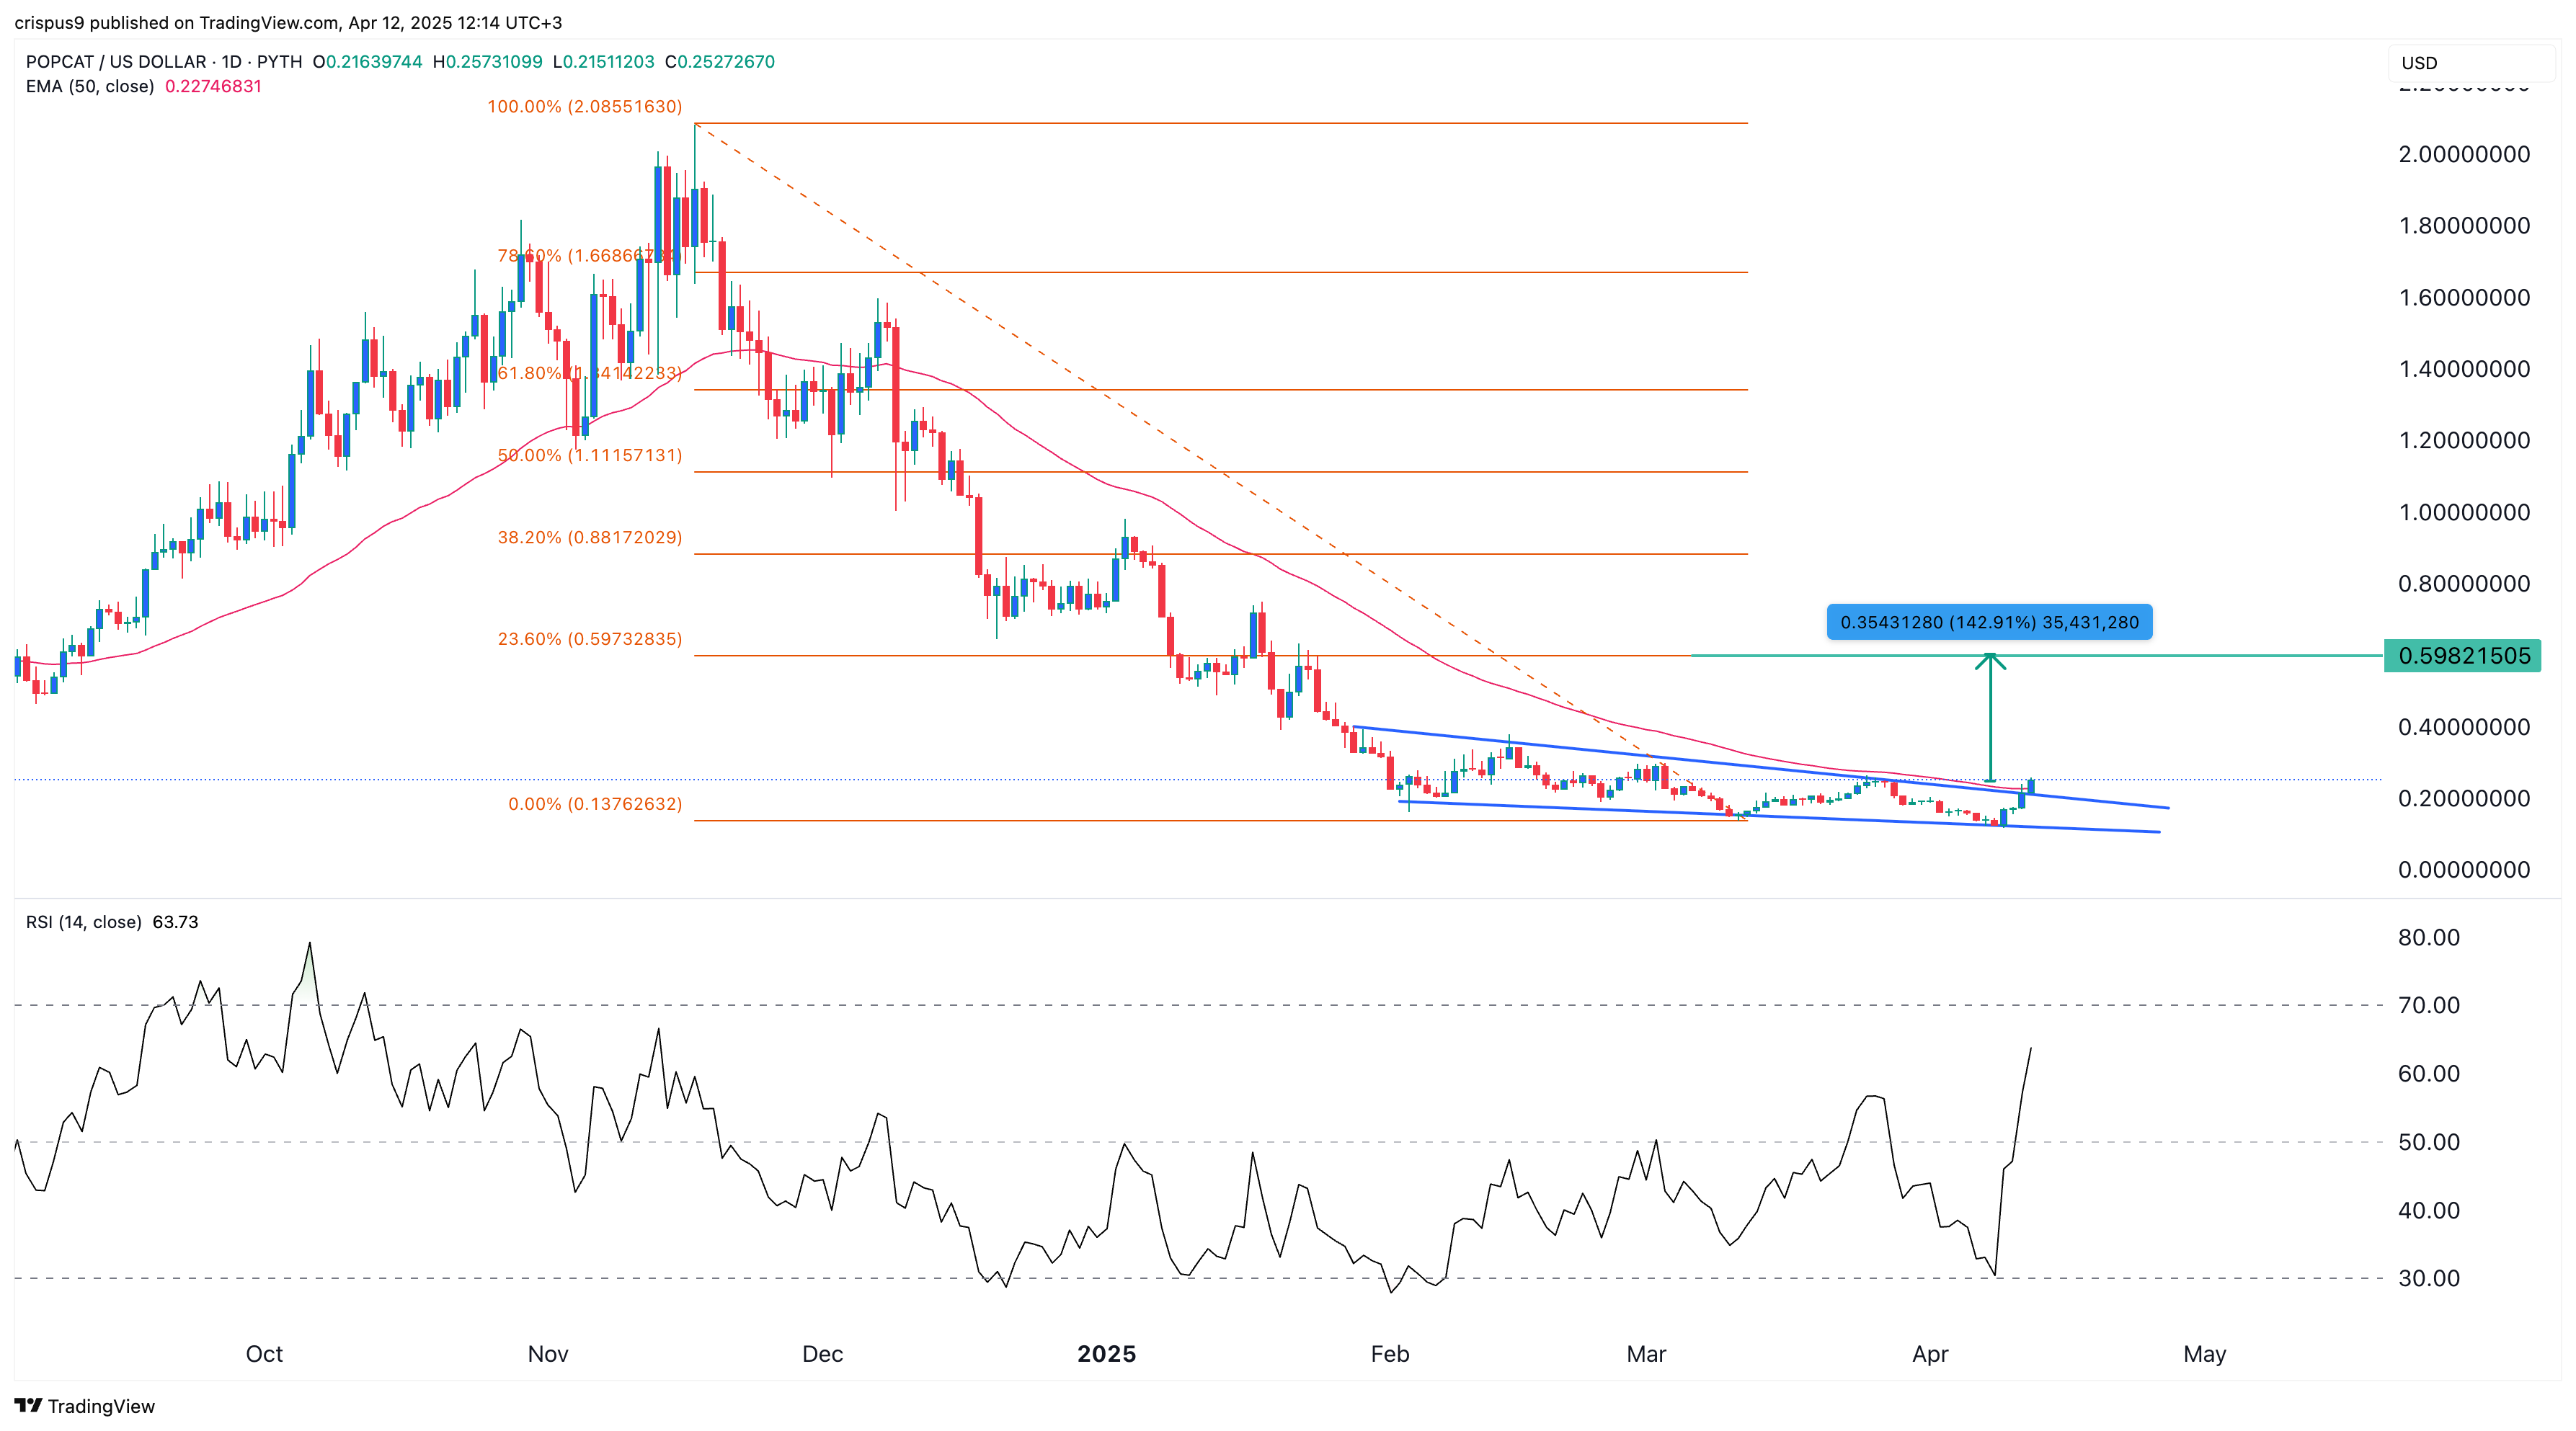
The daily chart shows that the Popcat price has bounced back in the past few days. This rebound happened after the token formed a falling wedge pattern, which is shown in blue. This pattern is made up of two descending and converging trendlines.
The Popcat token has moved slightly above the 50-day moving average, while the Relative Strength Index and other oscillators have pointed upward.
Therefore, the coin will likely keep rising as bulls target the 23.6% retracement level at $0.5982, up 142% from the current level.
Source link
meme coin
Fartcoin price surges 35% as recovery gains momentum
Published
3 weeks agoon
April 1, 2025By
admin
Fartcoin has jumped 35% in the past 24 hours, reinforcing its ongoing recovery after months of consolidation.
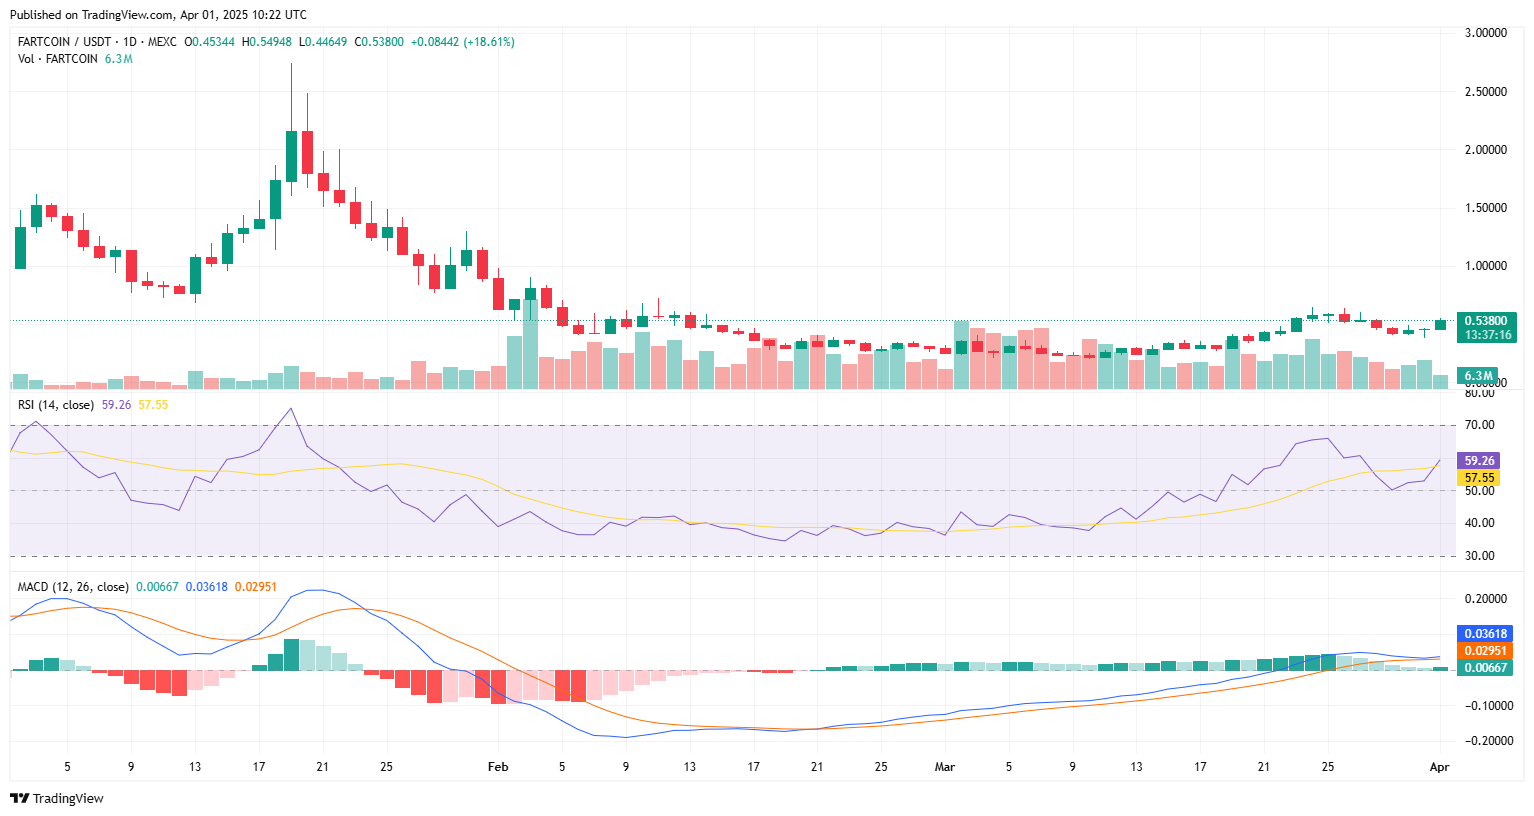
Fartcoin (FARTCOIN) is up 35% in the past 24 hours, currently trading at $0.52 with trading volume at $164 million. The surge is noteworthy as it indicates a strengthening recovery from the prolonged consolidation phase which ensued after the price crashed from its all-time of $2.48 high on Jan, 19.
The FARTCOIN price started rebounding from the $0.20–$0.30 range, where it has been consolidating from February to mid-March 2025, around March 19, when the price surged over 30% from $0.297318 to $0.395195.
During this consolidation period, trading volume was relatively stable, suggesting sellers had exhausted their momentum and accumulation was underway. March 24 marked the turning point, as FARTCOIN surged past $0.60, signaling the start of a breakout.

However, after briefly surpassing $0.60 on March 24, the price bottomed out around $0.40–$0.45. Buyers then stepped in, driving a steady climb with rising volume, culminating in today’s surge to $0.53. Relative Strength Index is currently at 59.26, approaching bullish territory but not yet overbought. Moving Average Convergence Indicator also supports that momentum is on the bulls’ side, with the MACD line (0.03618) above the Signal Line (0.02951).
With this breakout, FARTCOIN is now approaching local resistance levels around $0.60–$0.70. A sustained push above these levels could confirm a full trend reversal, with the price potentially testing the major resistance at around $1.20 – $1.30, the level established when the price tried to recover after the crash from ATH in January.
Source link
doge
Dogecoin (DOGE) Bulls In Trouble—Can They Prevent a Drop Below $0.15?
Published
3 weeks agoon
March 31, 2025By
admin
Dogecoin started a fresh decline from the $0.1880 zone against the US Dollar. DOGE is declining and might test the $0.150 support zone.
- DOGE price started a fresh decline below the $0.1850 and $0.1750 levels.
- The price is trading below the $0.1750 level and the 100-hourly simple moving average.
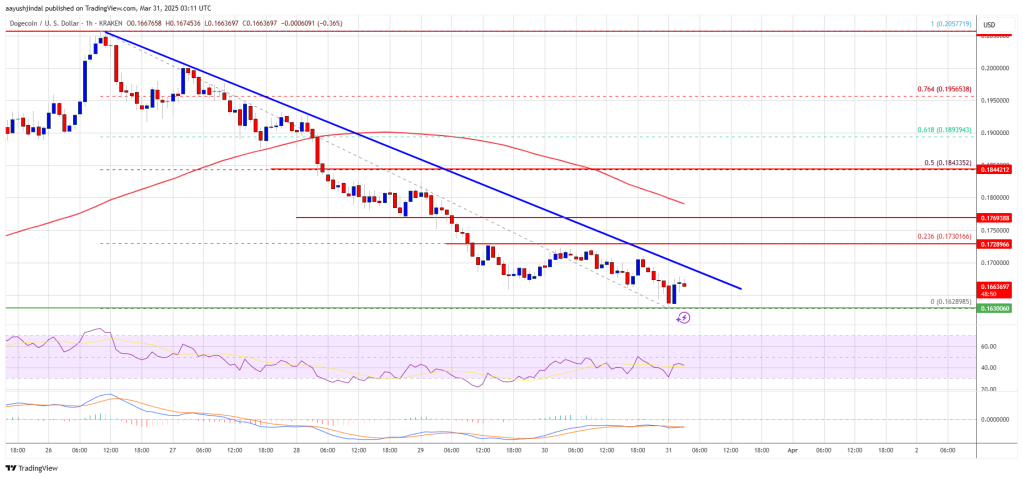
- There is a key bearish trend line forming with resistance at $0.170 on the hourly chart of the DOGE/USD pair (data source from Kraken).
- The price could extend losses if it breaks the $0.1620 support zone.
Dogecoin Price Dips Further
Dogecoin price started a fresh decline after it failed to clear $0.200, like Bitcoin and Ethereum. DOGE dipped below the $0.1880 and $0.1820 support levels.
The bears were able to push the price below the $0.1750 support level. It even traded close to the $0.1620 support. A low was formed at $0.1628 and the price is now consolidating losses below the 23.6% Fib retracement level of the downward move from the $0.2057 swing high to the $0.1628 low.
Dogecoin price is now trading below the $0.1750 level and the 100-hourly simple moving average. Immediate resistance on the upside is near the $0.170 level. There is also a key bearish trend line forming with resistance at $0.170 on the hourly chart of the DOGE/USD pair.
The first major resistance for the bulls could be near the $0.1730 level. The next major resistance is near the $0.1770 level. A close above the $0.1770 resistance might send the price toward the $0.1850 resistance.
The 50% Fib retracement level of the downward move from the $0.2057 swing high to the $0.1628 low is also near the $0.1850 zone. Any more gains might send the price toward the $0.1880 level. The next major stop for the bulls might be $0.1950.
More Losses In DOGE?
If DOGE’s price fails to climb above the $0.1770 level, it could start another decline. Initial support on the downside is near the $0.1635 level. The next major support is near the $0.1620 level.
The main support sits at $0.1550. If there is a downside break below the $0.1550 support, the price could decline further. In the stated case, the price might decline toward the $0.1320 level or even $0.120 in the near term.
Technical Indicators
Hourly MACD – The MACD for DOGE/USD is now gaining momentum in the bearish zone.
Hourly RSI (Relative Strength Index) – The RSI for DOGE/USD is now below the 50 level.
Major Support Levels – $0.1620 and $0.1550.
Major Resistance Levels – $0.1720 and $0.1770.
Source link

Here’s why AI tokens FET, AIC, Render, WLD, TAI are soaring

The $89 OmiGPT Aims to Be a Smarter AI Wearable

Uniswap Founder Urges Ethereum To Pursue Layer 2 Scaling To Compete With Solana

Slovenia Moves to Tax Crypto Profits at 25%

‘Crypto is not communism’ — Exec slams BIS’ take on crypto

Bitcoin Battles Triple Resistance As Price Rejection Persists.

How Bitcoin Offers A Speed Advantage For Driving Shareholder Value

Native Asset of Bitcoin DeFi Project Surges by More Than 55% This Week Amid New Token Buyback

Charles Schwab CEO teases direct spot crypto trading

This ‘Minecraft’ Clone Puts Every Game Action On-Chain—Here’s Why

Ethereum Price Eyes $3,000 as Arizona’s SB 1373 Sparks $91,000,000 Exchange Withdrawals in 48 hours
Trump’s Official Memecoin Surges Despite Massive $320 Million Unlock in Thin Holiday Trading

‘Rich Dad, Poor Dad’ author calls for $1 million BTC by 2035

Chainlink Price Continues To Hover Around $12.5 — Levels To Watch

What Bitcoin Indicators Predict For Q3 2025?

Arthur Hayes, Murad’s Prediction For Meme Coins, AI & DeFi Coins For 2025

Expert Sees Bitcoin Dipping To $50K While Bullish Signs Persist

3 Voting Polls Show Why Ripple’s XRP Price Could Hit $10 Soon

Aptos Leverages Chainlink To Enhance Scalability and Data Access

Bitcoin Could Rally to $80,000 on the Eve of US Elections

Crypto’s Big Trump Gamble Is Risky

Sonic Now ‘Golden Standard’ of Layer-2s After Scaling Transactions to 16,000+ per Second, Says Andre Cronje

Institutional Investors Go All In on Crypto as 57% Plan to Boost Allocations as Bull Run Heats Up, Sygnum Survey Reveals

The Future of Bitcoin: Scaling, Institutional Adoption, and Strategic Reserves with Rich Rines

Ripple-SEC Case Ends, But These 3 Rivals Could Jump 500x

Has The Bitcoin Price Already Peaked?

A16z-backed Espresso announces mainnet launch of core product

Xmas Altcoin Rally Insights by BNM Agent I

Blockchain groups challenge new broker reporting rule

I’m Grateful for Trump’s Embrace of Bitcoin
Trending

 24/7 Cryptocurrency News5 months ago
Arthur Hayes, Murad’s Prediction For Meme Coins, AI & DeFi Coins For 2025

 Bitcoin3 months ago
Expert Sees Bitcoin Dipping To $50K While Bullish Signs Persist

 Ripple Price1 month ago
3 Voting Polls Show Why Ripple’s XRP Price Could Hit $10 Soon

 24/7 Cryptocurrency News3 months ago
Aptos Leverages Chainlink To Enhance Scalability and Data Access

 Bitcoin6 months ago
Bitcoin Could Rally to $80,000 on the Eve of US Elections

 Opinion6 months ago
Crypto’s Big Trump Gamble Is Risky

 Altcoins3 months ago
Sonic Now ‘Golden Standard’ of Layer-2s After Scaling Transactions to 16,000+ per Second, Says Andre Cronje

 Bitcoin5 months ago
Institutional Investors Go All In on Crypto as 57% Plan to Boost Allocations as Bull Run Heats Up, Sygnum Survey Reveals


