Markets
Chainlink price double bottoms as whales accumulate
Published
5 months agoon
By
admin
Chainlink formed a double-bottom pattern, pointing to a potential rebound, as signs showed that some whales were accumulating the token.
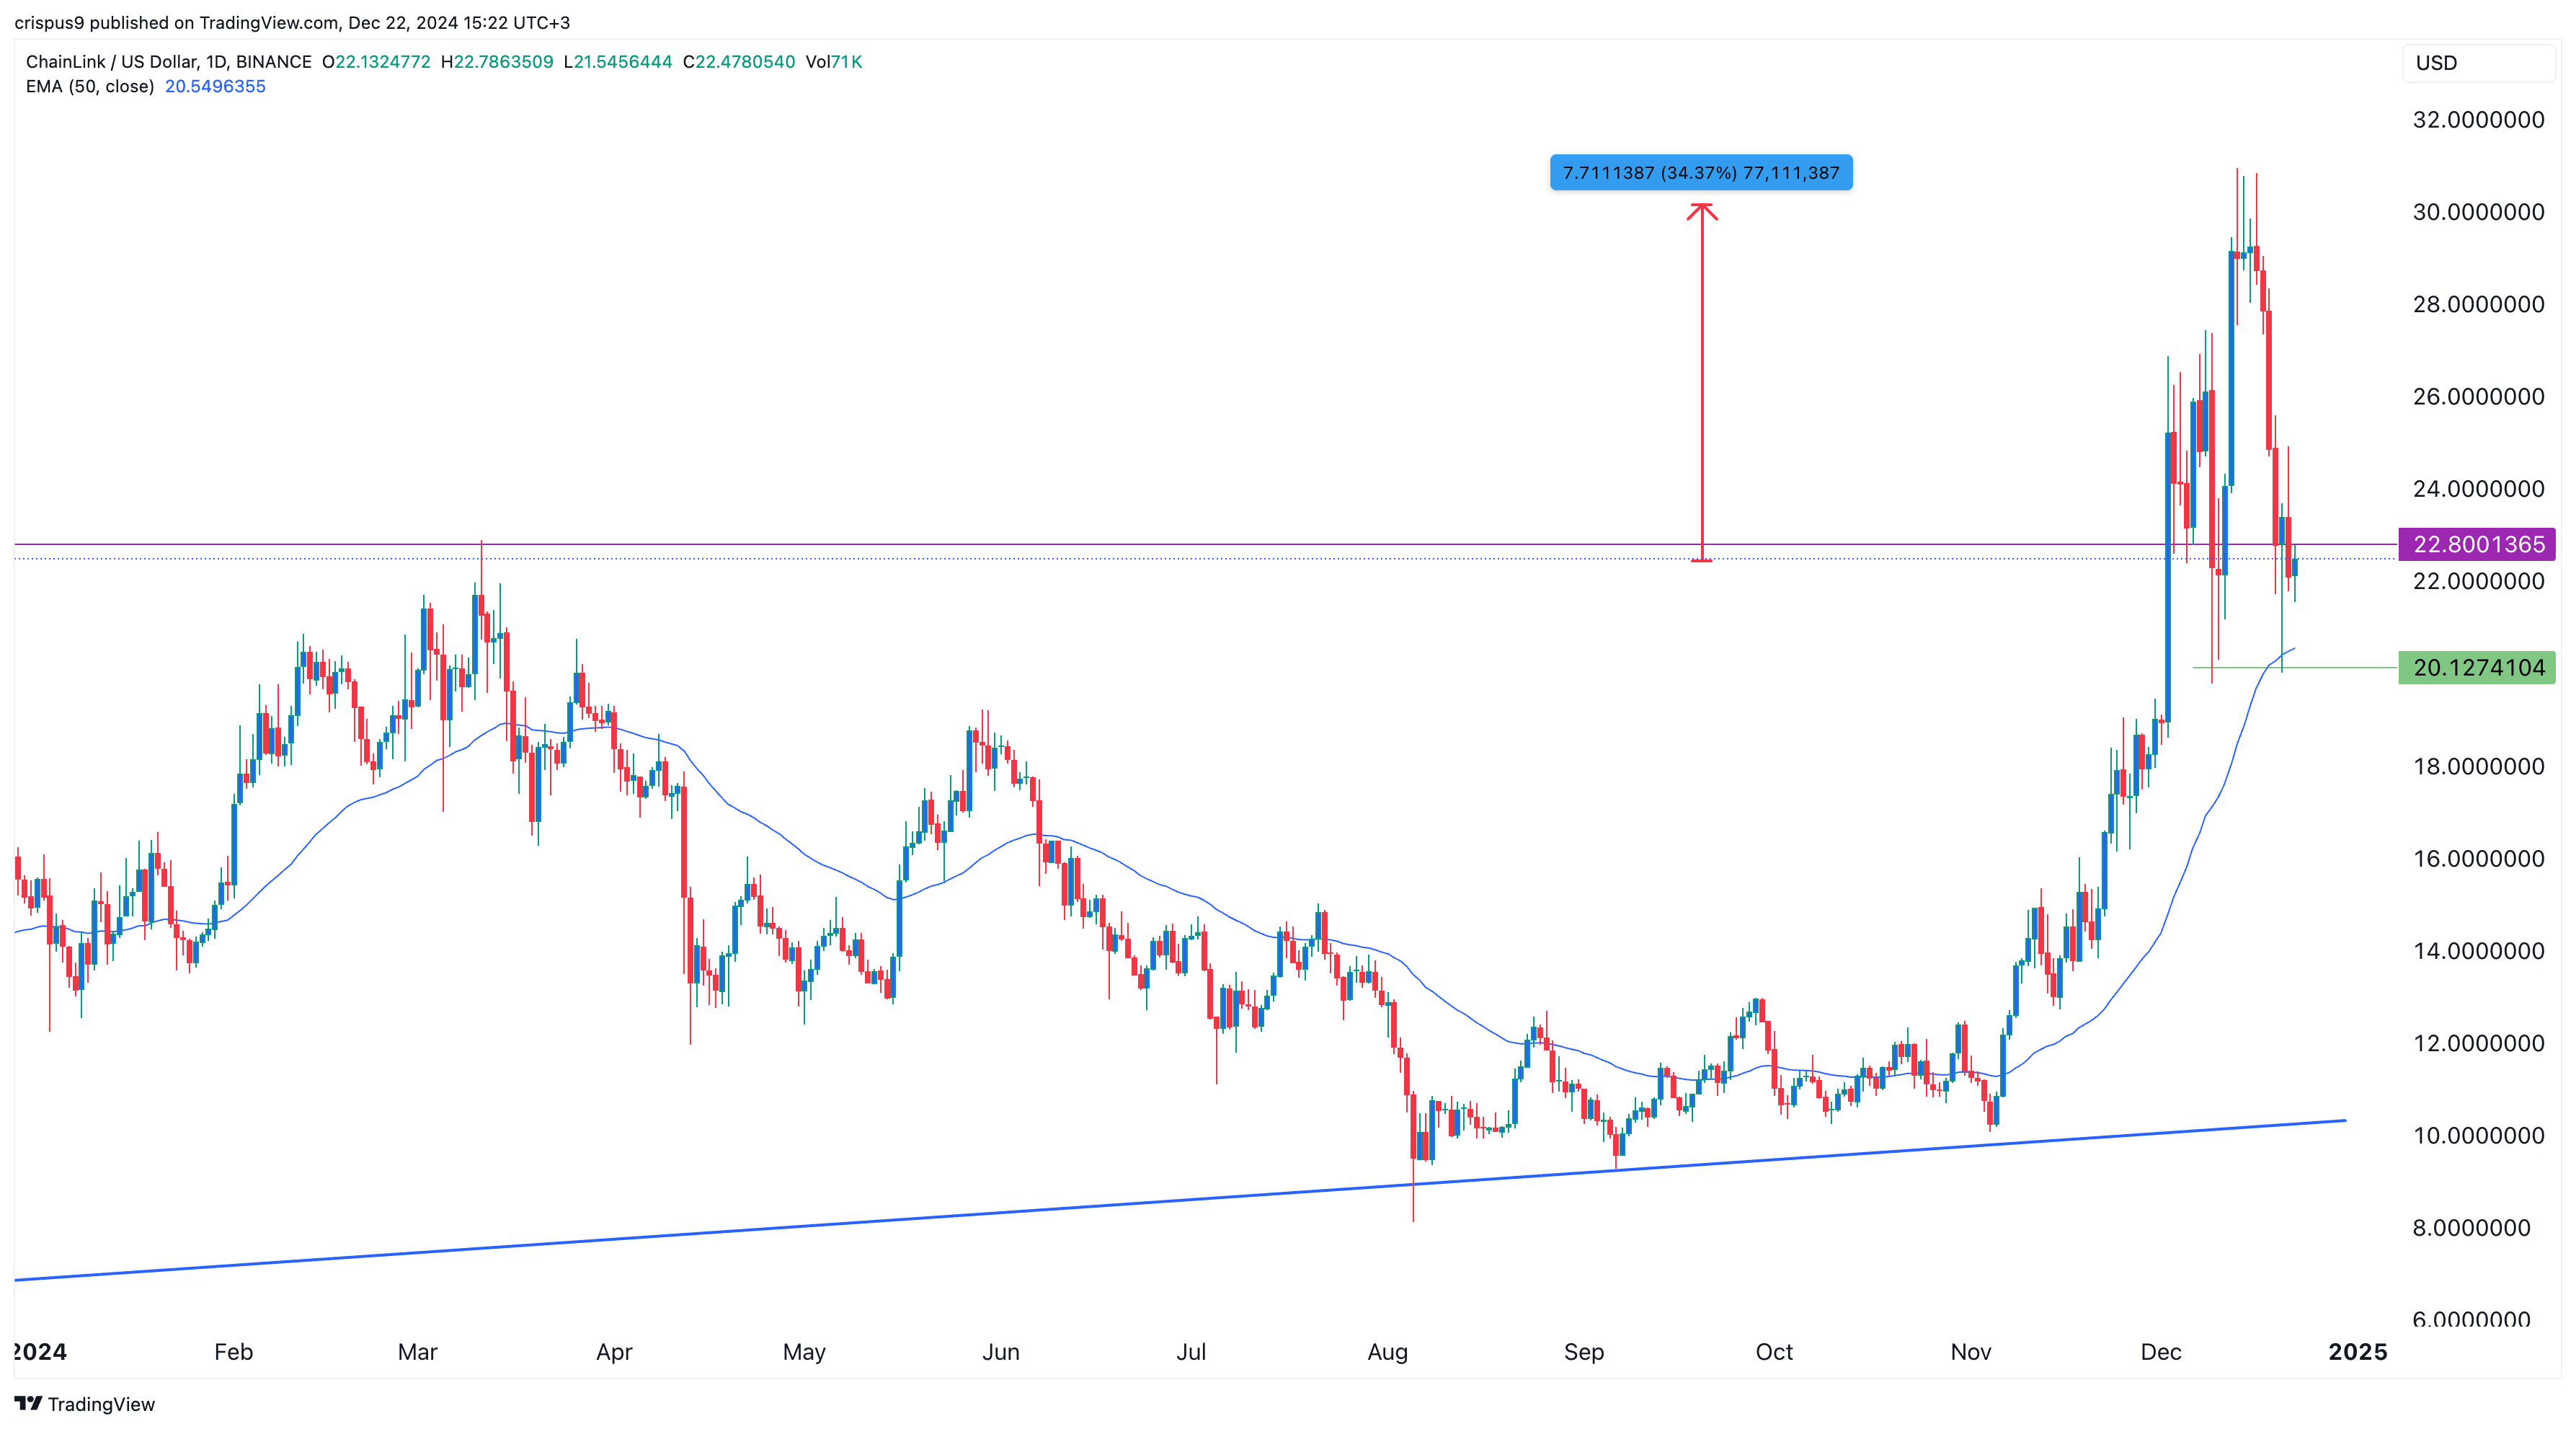
Chainlink (LINK), the biggest oracle provider, bottomed at $20.12 on Friday and rebounded to $22.50 on Sunday, Dec. 22. Still, the coin remains about 27% from its highest point this month, meaning that it is in a bear market.
A potential catalyst for the LINK token is that whales are accumulating it. According to LookOnChain, nine new wallets withdrew 362,380 coins from Binance in the last two days. These coins are now valued at over $8.19 million.
Crypto.news reported last week that another whale accumulated 65,000 LINK coins valued at $1.8 million.
Whales are accumulating $LINK!
We noticed 9 fresh wallets that withdrew 362,380 $LINK($8.19M) from #Binance in the last 48 hours.
Address:
0xdA44049389F87c1170C5e7319c9eb93acDf83304
0xC10396589a40438CcdF48bA1b2061a6067DAa972
0x5199b3Ce02a912056ea8A460371aD83020693F6C… pic.twitter.com/vpAMR0dhbd— Lookonchain (@lookonchain) December 22, 2024
These whales bought Chainlink a week after World Liberty Financial (WLFI), the DeFi platform launched by the Trump family, bought over 78,300 LINK tokens valued at over $1.7 million. It’s worth noting that President-elect Trump and his family mostly own WLFI tokens.
Chainlink, known in the crypto industry for its fundamentals, is the biggest oracle in the sector with over $35 billion in total value secured. That figure is higher than its biggest competitors like Chronicle, Pyth, Edge, and Redstone.
Chainlink’s ecosystem will likely grow as more chains and networks embrace its technology. Justin Sun’s Tron, the most recent chain to use its oracles, has switched from WINKLink to Chainlink.
Chainlink has also formed major partnerships in the Real World Asset tokenization industry, including by companies like Coinbase, Emirates NBD, SWIFT, and UBS.
Chainlink price formed a double-bottom pattern
LINK, like other cryptocurrencies, has dropped sharply in the past few days as concerns about the Federal Reserve remained.
The token has remained above the 50-day moving average on the daily chart. Most importantly, it has formed a double-bottom chart pattern at $20.12. This pattern happens when an asset fails to move below a specific price two times. It is one of the most bullish reversal patterns in the market.
LINK has also formed an inverse hammer pattern, a popular reversal sign. Therefore, the coin is likely to bounce back in the next few days as investors target the key psychological at $30, which is about 35% above the current level.
On the flip side, the bullish view will become invalid if the coin drops below the double-bottom point at $20.12.

Source link
You may like


Ethereum Price Headed For Crash To $2,000 With Current Price Action


Tokenized funds hit $5.7B, scaling fast — Moody’s


Authorities Warn of Phony Text Messages Phishing for Sensitive Information, Telling Victims Their Bank Account Is at Risk


Tether invests in Chilean crypto exchange Orionx


MARA Hits Record-High Bitcoin Production in May


Retail investors no longer FOMO into BTC, altcoins


In brief
- MARA Holdings produced a record 950 Bitcoin in May, representing a 35% increase from April.
- The company said it won 282 blocks, growing its hashrate to 58.3 exahash per second.
- Riot Platforms had more modest 11% production growth to 514 Bitcoin—but it sold 500 BTC during the same period.
Bitcoin miner MARA Holdings, formerly Marathon Digital, set a new monthly record in May, producing 950 Bitcoin, a 35% increase from April.
The BTC miner said it won 282 blocks, marking a 38% month-over-month increase, and grew its energized hashrate to 58.3 exahash per second.
MARA’s big month occurred as Bitcoin hit a record high above $112,000, part of a wider upturn in crypto markets stemming from improved environment for risk-on assets. Bitcon was recently trading above $106,000, up 2% over the past 24 hours.
Bitcoin miners use powerful computers to solve complex math problems that validate transactions on the Bitcoin network. To say that a miner “won” a block means it beat the others to the right answer. A company’s mining power is measured in exahashes, which represent one quintillion guesses at the right answer every second.
Miners are rewarded with new Bitcoin and transaction fees for helping secure the network and add new blocks to the blockchain, which is why MARA’s increased win rate helped it set a new BTC production record.
The company noted that some of this is down to pure luck.
“Production in May also benefitted from block reward luck. Since launch, MARA Pool’s block reward luck has outperformed the network average by over 10%, contributing to our industry-leading block production,” MARA Holdings CEO Fred Thiel said in a press release.
MARA Holdings has now grown its Bitcoin treasury to 49,228 BTC worth approximately $5.3 billion at the time of writing. The company noted in its press release that didn’t sell any Bitcoin in May.
The value of the company’s Bitcoin holdings is now level with its $5.3 billion market capitalization. The company didn’t immediately respond to a question from Decrypt about this point.
It’s likely a welcome turnaround from when its market cap trailed its Bitcoin holdings in April.
Investors seem pleased with the news. MARA, which trades on the Nasdaq under the MARA ticker, has gained 5.6% since the opening bell and is currently trading for $15.15. Just last week, the company was touting on X that instead of just buying Bitcoin, its “twin turbo strategy” includes buying, producing, and compounding BTC.
Bitcoin treasury companies buy and hold.
MARA’s twin turbo strategy buys, produces, and compounds.
Holdings up +174% in just five quarters. pic.twitter.com/o0ORfmwb9n
— MARA (@MARAHoldings) May 27, 2025
MARA’s next largest publicly traded competitor, Riot Platforms, posted a smaller gain in May. Riot, which trades on the Nasdaq under the RIOT ticker, saw BTC production rise 11% to 514 in May. But unlike its rival, RIOT sold 500 Bitcoin in the same month.
In his commentary on May performance, Riot Platforms CEO Jason Les said the company closed on the acquisition of 355 acres near its existing Corsicana site in Texas.
“This additional land will further support the development of data centers to serve high performance compute, which typically require larger footprints than bitcoin mining to utilize the same power capacity,” he said.
Edited by James Rubin
Daily Debrief Newsletter
Start every day with the top news stories right now, plus original features, a podcast, videos and more.
Source link
AI Market Insights
AVAX Rises 3.8% on Strong Volume, Breaking Key Resistance Levels
Published
8 hours agoon
June 3, 2025By
admin

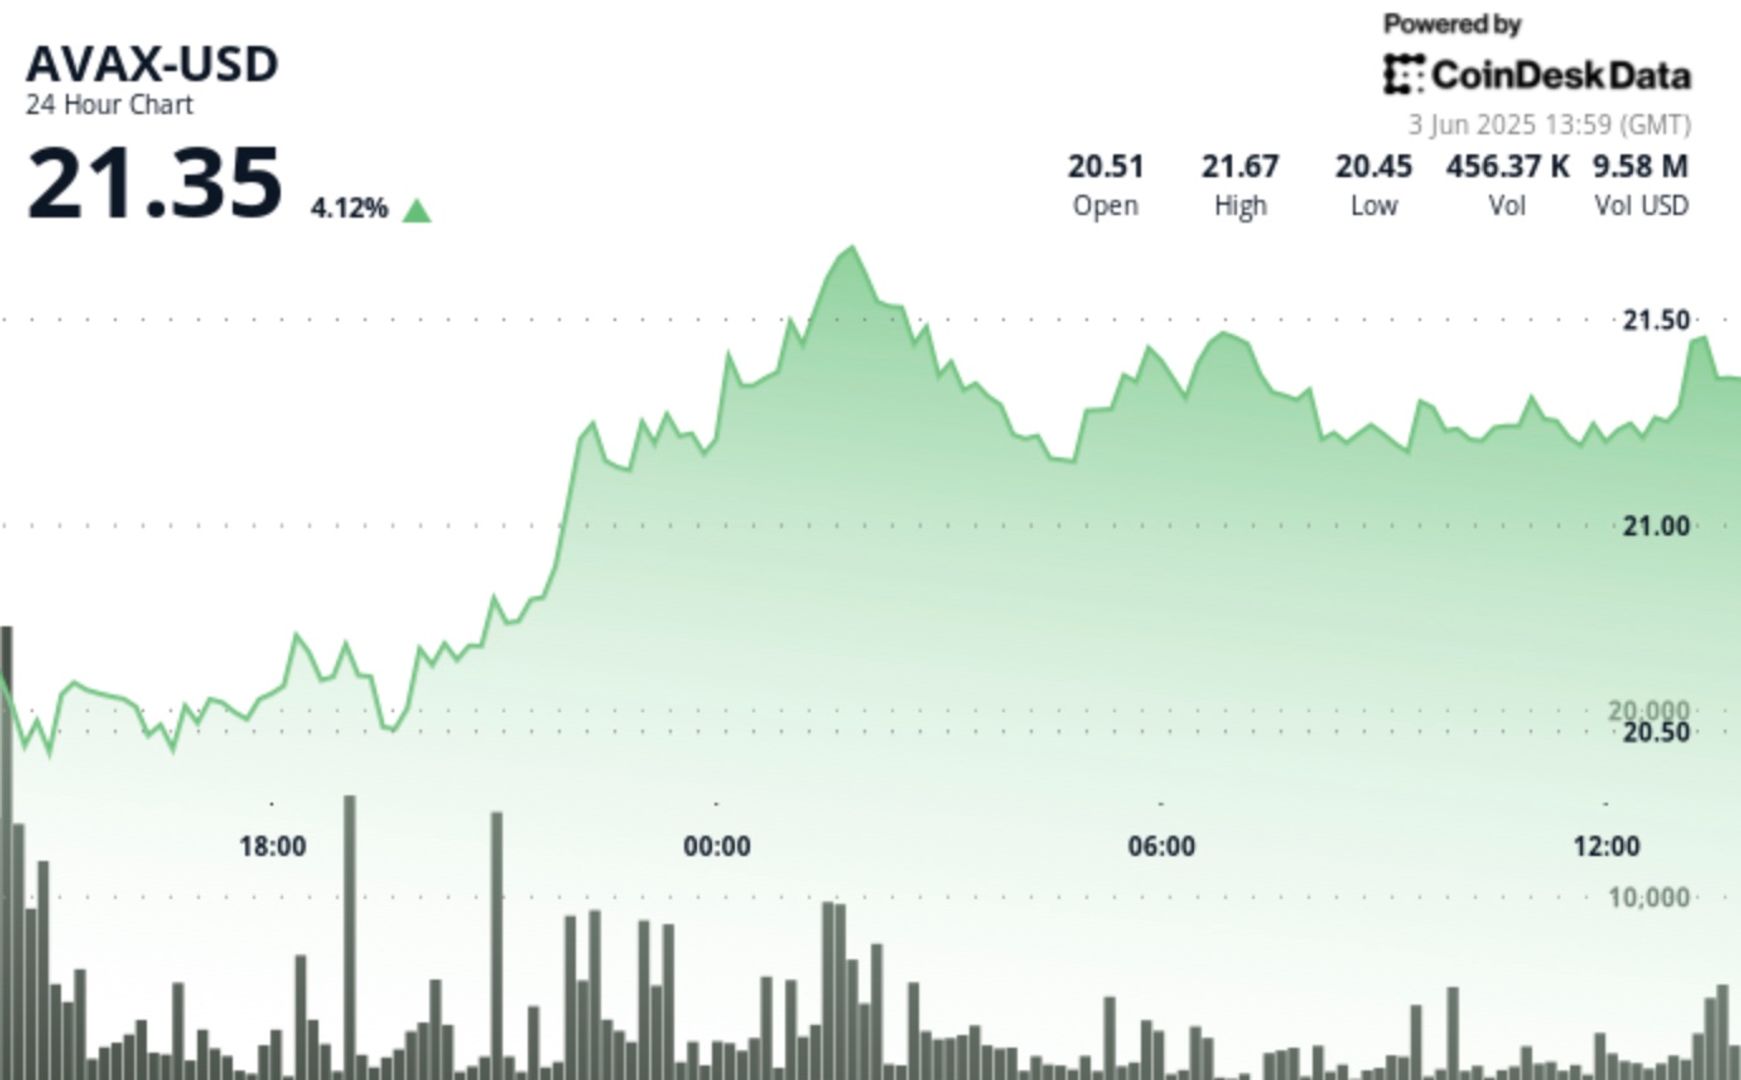
AVAX broke through key resistance levels on high volume, establishing new support zones around $21.30 as traders navigate complex market conditions influenced by international trade disputes and monetary policy speculation.
Technical Analysis
• AVAX climbed from $20.52 to $21.31, representing a 3.8% gain with a total range of $1.28 (6.2%).
• Price formed a clear uptrend with higher lows and higher highs, breaking through key resistance at $20.90.
• Exceptionally high volume (1.33M) confirmed the breakout.
• Strong support established at $21.15 following the surge.
• Most significant price movement occurred when AVAX surged past the $21.00 psychological level.
• Pronounced correction saw price drop 5.8% on the highest volume spike (40,669).
• Decreasing volume suggests consolidation after volatile price action.
Source link
Circle
USDC Stablecoin Issuer Circle Eyes $7.2B Valuation in Upsized IPO
Published
1 day agoon
June 2, 2025By
admin

Circle, the issuer of the USDC stablecoin, is aiming for a fully diluted valuation of up to $7.2 billion in its upcoming initial public offering, according to a Monday filing with the Securities and Exchange Commission (SEC).
The company now plans to offer up to 32 million shares priced between $27 and $28 each, up from 24 million shares at $24 to $26 when it first filed in May. The move suggests investor interest in Circle’s business is growing, and possibly heating up faster than expected.
That interest appears to be coming from some of the world’s most influential investors. In May, it was reported that BlackRock, the world’s largest asset manager, is considering purchasing up to 10% of Circle’s IPO shares, according to people familiar with the matter. Ark Invest, the investment firm led by Cathie Wood, has also signaled intent to buy $150 million worth of stock.
Circle’s IPO comes as stablecoins are having a moment in the broader crypto market. Once considered niche instruments mostly used for crypto trading, they are now widely integrated into decentralized finance (DeFi), remittances and even traditional finance rails.
The total market cap of all stablecoins now stands at $248 billion, with Tether’s USDT making up 62% of the market at $154 billion, followed by Circle’s USDC at $60 billion, according to DeFiLlama.
Disclaimer: Parts of this article were generated with the assistance from AI tools and reviewed by our editorial team to ensure accuracy and adherence to our standards. For more information, see CoinDesk’s full AI Policy.
Source link
Ethereum Price Headed For Crash To $2,000 With Current Price Action
Tokenized funds hit $5.7B, scaling fast — Moody’s
Authorities Warn of Phony Text Messages Phishing for Sensitive Information, Telling Victims Their Bank Account Is at Risk

Tether invests in Chilean crypto exchange Orionx

MARA Hits Record-High Bitcoin Production in May
Retail investors no longer FOMO into BTC, altcoins
AVAX Rises 3.8% on Strong Volume, Breaking Key Resistance Levels

K33 begins Bitcoin buying with 10 BTC purchase for treasury strategy
Why $107,500 And $103,500 Are The Levels To Watch
Pakistan Proposes New Crypto Regulations
Japanese Bitcoin Hoarder Metplanet Adds $115,600,000 Worth of BTC As Stock Surpasses 263% Gains on the Year
Bitcoin traders anticipate decline, watch $100K
Ethereum Foundation Restructures R&D Division, Plans ‘Rethink’ on Design and Development
Here’s why Sophon crypto rallied over 40% today
BCB Strikes Deal with SocGen–FORGE to Distribute Euro-Pegged Stablecoin EURCV

Arthur Hayes, Murad’s Prediction For Meme Coins, AI & DeFi Coins For 2025

Pi Network coin to $10? 4 catalysts that may make it possible

3 Voting Polls Show Why Ripple’s XRP Price Could Hit $10 Soon

Expert Sees Bitcoin Dipping To $50K While Bullish Signs Persist

Aptos Leverages Chainlink To Enhance Scalability and Data Access

Bitcoin Could Rally to $80,000 on the Eve of US Elections

Crypto’s Big Trump Gamble Is Risky

The Future of Bitcoin: Scaling, Institutional Adoption, and Strategic Reserves with Rich Rines

Institutional Investors Go All In on Crypto as 57% Plan to Boost Allocations as Bull Run Heats Up, Sygnum Survey Reveals

Sonic Now ‘Golden Standard’ of Layer-2s After Scaling Transactions to 16,000+ per Second, Says Andre Cronje

Ripple-SEC Case Ends, But These 3 Rivals Could Jump 500x

Has The Bitcoin Price Already Peaked?

A16z-backed Espresso announces mainnet launch of core product

Blockchain groups challenge new broker reporting rule

Xmas Altcoin Rally Insights by BNM Agent I
Trending

 24/7 Cryptocurrency News7 months ago
Arthur Hayes, Murad’s Prediction For Meme Coins, AI & DeFi Coins For 2025

 Markets3 months ago
Pi Network coin to $10? 4 catalysts that may make it possible

 Ripple Price3 months ago
3 Voting Polls Show Why Ripple’s XRP Price Could Hit $10 Soon

 Bitcoin5 months ago
Expert Sees Bitcoin Dipping To $50K While Bullish Signs Persist

 24/7 Cryptocurrency News5 months ago
Aptos Leverages Chainlink To Enhance Scalability and Data Access

 Bitcoin7 months ago
Bitcoin Could Rally to $80,000 on the Eve of US Elections

 Opinion7 months ago
Crypto’s Big Trump Gamble Is Risky

 Bitcoin4 months ago
The Future of Bitcoin: Scaling, Institutional Adoption, and Strategic Reserves with Rich Rines


