Bitcoin
CME Gap Threatens Bitcoin With Potential Drop To $77,000
Published
3 months agoon
By
admin
Some analysts raised their concerns that Bitcoin might experience a possible crash which will be driven by the Chicago Mercantile Exchange (CME) gap leading to a huge drop in its price.
Since Bitcoin needs to fill in the gap, crypto traders predict it might push the firstborn cryptocurrency near the critical CME gap, suggesting that its price could go as low as $77,000 per coin.
Related Reading
Bitcoin Could Slide To $77,000
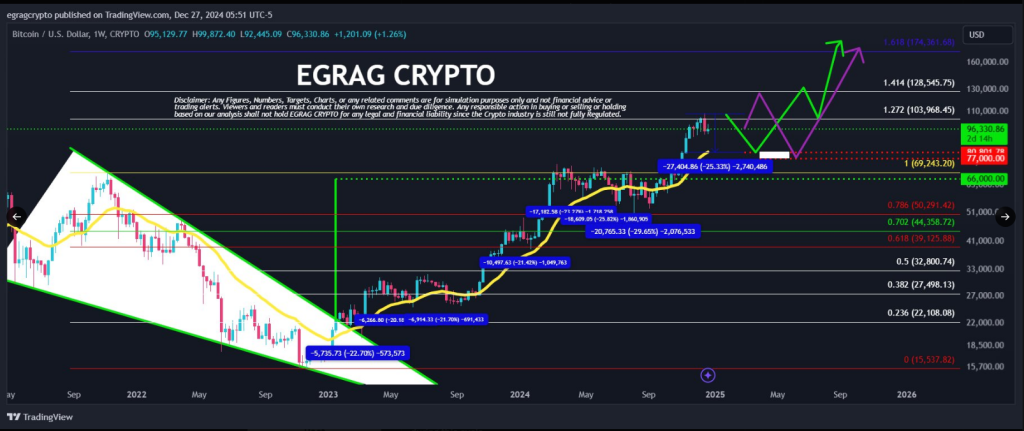
Crypto analyst Egrag Crypto suggested that the massive corrections that Bitcoin has been experiencing could cause the coin to plunge to the $77,000 mark.
Egrag added that since October 2022, the flagship cryptocurrency has been subjected to about seven considerable drops, adding, “The average drop across these events is approximately 23.53%.”
#BTC Drop – Average Dump & CME (70K-74K): How & Why?
Average Drop:
Since October 2022, #BTC has experienced nearly seven significant drops. Here are the percentage declines:1) 22.70%
2) 20.18%
3) 21.70%
4) 21.42%
5) 23.27%
6) 25.82%
7) 29.65%
The average drop across… pic.twitter.com/Vz6QiZlnzF
— EGRAG CRYPTO (@egragcrypto) December 27, 2024
“From the current high of around 108,975, we’re looking at a potential drop to the lower end of the CME GAP (between 77K-80K). This represents a 25% decline, aligning well with the average drop observed during this cycle,” Egrag said in a post.

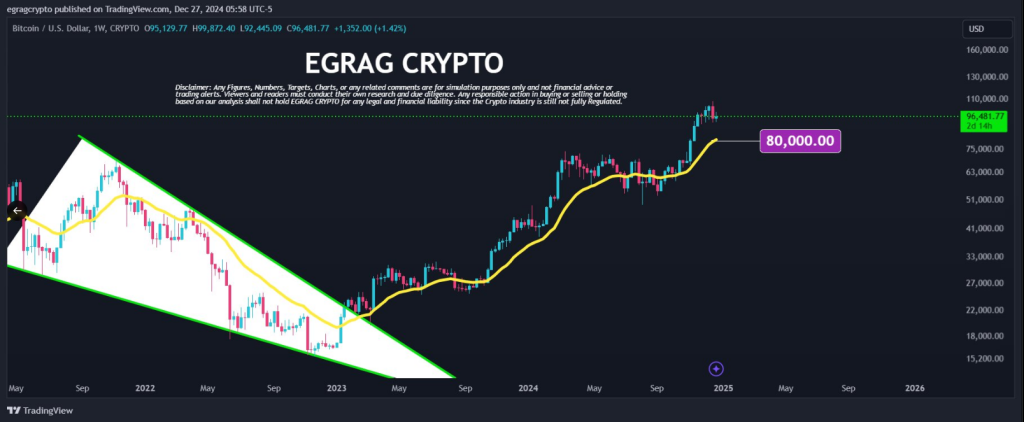
Egrag also noted that the current 21 Weekly EMA is around $80,000, suggesting that “another flash crash could be on the horizon.”

CME Gap At $80,000
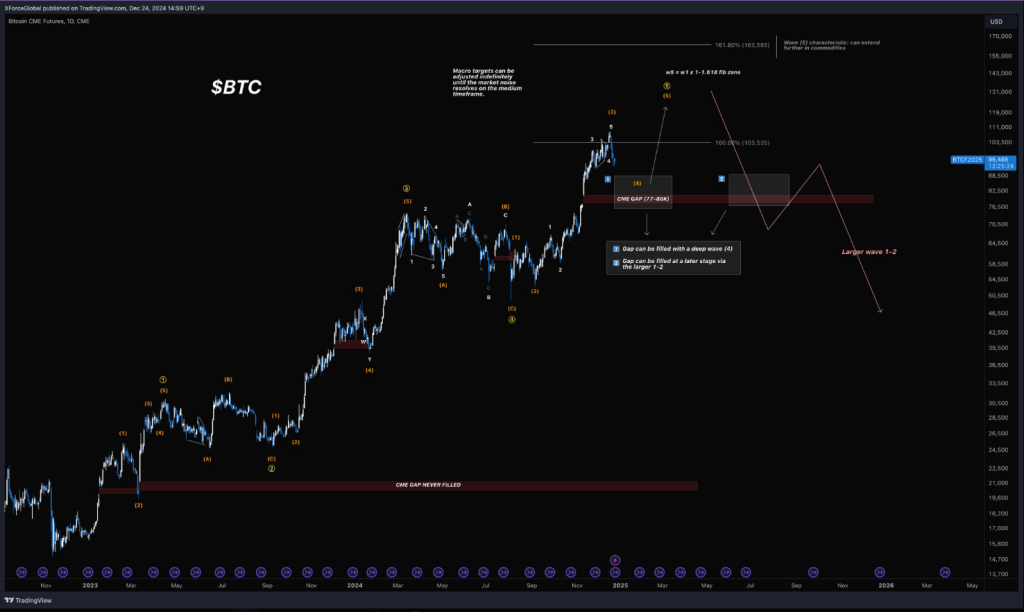
Another crypto analyst, XForceGlobal, reminded traders that “there’s a 1D CME gap at $80,000.”
XForceGlobal said that historically, 90% of daily CME gaps larger than have been eventually filled since 2018.
Just a friendly reminder: there’s a 1D CME gap at $80,000.
Statistically, since 2018, with the growing interest in gaps, 90% of 1-Day timeframe gaps larger than $1,000 have eventually been filled (ignore anything below the 1D timeframe).
The tricky part with CME gaps is… pic.twitter.com/wJC2ih5U8M
— XForceGlobal (@XForceGlobal) December 24, 2024

However, the crypto analyst noted that it is hard to predict the timing and method of filling CME gaps.
“The tricky part with CME gaps is that their timing and method of filling remain unpredictable,” XForceGlobal said in a post.
The crypto analyst sees possible scenarios to fill the CME gaps. In one scenario, XForceGlobal suggests it could be filed through a deep wave or wave-4 correction, bringing Bitcoin down to the $77,000 to $80,000 level.
In another scenario, XForceGlobal said it can be filled “at a later stage via the assumed 1-2 correction after we finally finish off this bull run’s impulse,” a scenario which might result in the BTC to plummet to $46,000.
Related Reading
A Market Dump In January?
Egrag believes that market makers might use the upcoming inauguration of President-elect Donald Trump to trigger selling pressure for Bitcoin, contributing to its imminent crash.
“Market makers are known for seizing opportunities during crises. Expect a market dump on Inauguration Day (January 20, 2025). This could be the perfect local top for a sell-off, likely leaving many newcomers in a panic,” the crypto analyst said.
Egrag outlined two scenarios that might unfold from the current market condition, suggesting that in one scenario, Bitcoin could pump to $120,000 and later experience a dump to the CME GAP before “resuming the bull run in 2025.”
In another possible scenario, the crypto analyst said that BTC could drop to the CME gap of $70,000 to $75,000 level before the resumption of the bull run.
Featured image from Pexels, chart from TradingView
Source link
You may like


New SEC Chair Paul Atkins Holds $6,000,000 in Crypto-Related Investments – Here’s His Portfolio: Report


We’ve Turned A Generation Of Bitcoiners Into Digital Goldbugs


Solana DEX Raydium’s Pump.fun Alternative Is Going Live ‘Within a Week’


Google Cloud joins Injective as validator, expands Web3 tools


U.S. House Stablecoin Bill Poised to Go Public, Lawmaker Atop Crypto Panel Says


South Korea Urges Google To Block 17 Unregistered Crypto Exchanges
Bitcoin
Bitcoin Rally To $95K? Market Greed Suggests It’s Possible
Published
7 hours agoon
March 26, 2025By
admin
Reason to trust

Strict editorial policy that focuses on accuracy, relevance, and impartiality
Created by industry experts and meticulously reviewed
The highest standards in reporting and publishing
Strict editorial policy that focuses on accuracy, relevance, and impartiality
Morbi pretium leo et nisl aliquam mollis. Quisque arcu lorem, ultricies quis pellentesque nec, ullamcorper eu odio.
Bitcoin is on everyone’s crosshairs once more. The cryptocurrency shot up to $88,500 today, exciting traders who think the price will rise to $95,000 in the near term. But while optimism is high, so is caution. Some analysts are warning that a retreat back to $80,000 may occur before the next major rally starts.
Related Reading
Traders Show Signs Of Greed
Market intelligence platform Santiment reports that greed is building among crypto investors. References of Bitcoin reaching $100,000 or even as high as $159,000 have surged through social media platforms. While hope is generating all the excitement, Santiment reminds that such peaks in greed generally precede an imminent price adjustment.
As crypto has bounced nicely in the second half of March, traders have swung the pendulum back toward mild greed. After showing major fear in late February and early March following two stints of Bitcoin dipping as low as $78K, it appears that this rebound to $88.5K has… pic.twitter.com/WGvmvKSv2X
— Santiment (@santimentfeed) March 25, 2025
Traders had also been holding back earlier in the year when Bitcoin fell to a low of $78,000. But that recent spike back to $88,500 does appear to have changed the general sentiment. Santiment suggests this might be an ideal time for traders to consider taking profits.

Miners Hold Onto Bitcoin Reserves
Bitcoin miners appear to be confident about the future. According to data from CryptoQuant, miners have not been selling much of their Bitcoin recently. In fact, miner reserves now total 1.81 million BTC, which is worth around $159 billion.
Ali Martinez, a crypto analyst, confirmed in a comment on X that no significant selling activity has been recorded among miners over the past 24 hours. This behavior could be a sign that miners are expecting higher prices and prefer to hold onto their earnings for now.
Institutional Interest Grows With ETF Inflows
Institutional investors are also playing a big role in the market’s momentum. On March 25, Bitcoin spot ETFs in the US recorded a total daily inflow of $27 million. BlackRock, one of the largest asset management firms, led the way with $42 million in inflows that day.
Whereas some other funds such as Bitwise and WisdomTree experienced $10 million and $5 million outflows respectively, the robust demand for BlackRock helped in nudging the general trend into positive direction. BlackRock’s net assets in its Bitcoin spot ETF are currently at a little over $50 billion, demonstrating that institutional investors still have a passion for Bitcoin.
Related Reading
Analysts Expect Short-Term Fall Before Rally
Technical analysis is indicating Bitcoin might experience a temporary decline before the next peak. On its 4-hour chart, Bitcoin is having a difficult time surpassing a trendline of resistance, creating what experts refer to as a “double top” formation. The pattern suggests the potential for a price drop towards $85,000.
Meanwhile, the most important support level is at $86,146, according to the 61.80% Fibonacci retracement level. If Bitcoin manages to stay above this level, analysts indicate that the price may rebound and move towards $95,000.
Featured image from Gemini Imagen, chart from TradingView
Source link
Bitcoin
Crusoe Energy sells Bitcoin mining arm to NYDIG, turns focus to AI
Published
11 hours agoon
March 26, 2025By
admin

United States-based Bitcoin miner Crusoe Energy is wrapping up its Bitcoin mining business as it plans to shift focus towards the artificial intelligence sector.
According to a recent press release, Crusoe will sell 425 of its modular data centers— spanning sites across Colorado, North Dakota, Montana, Wyoming, New Mexico, Utah, Texas, and Argentina — with a combined 270 megawatts of power generation capacity, to the New York Digital Investment Group.
The deal also includes its Digital Flare Mitigation business, and around 135 employees will transition to NYDIG.
“Our innovative approach to energy utilized for mining is uniquely complementary to NYDIG’s bitcoin custody, institutional trading and mining businesses, creating a consolidated business that is more valuable than the sum of its parts,” Chase Lochmiller, CEO and co-founder of Crusoe, said regarding the acquisition.
NYDIG, which already has a strong presence in Bitcoin custody, trading, and mining, plans to continue operating and investing in the newly acquired business. In a separate announcement, the firm said the move will help support Bitcoin’s proof-of-work mechanism and contribute to the network’s long-term security.
Founded in 2018, Crusoe Energy was among the first U.S. Bitcoin mining firms to harness wasted natural gas to fuel the high-performance computing needed for both crypto mining and AI workloads.
Now, the company says it’s ready to shift gears and focus on scaling its AI infrastructure.
“We will continue to channel the same energy-first mentality towards scaling AI infrastructure and accelerating the adoption and proliferation of AI in our everyday lives,” Lochmiller added.
Signs of a transition to AI had already emerged in 2024, when Crusoe announced a multibillion-dollar deal with energy tech firm Lancium to build a 200-megawatt AI data center in Abilene, Texas.
Touted as the “first phase” of a larger expansion, the facility was set to tap into up to 1.2 gigawatts of clean power and support GPU clusters designed for AI training and inference at scale.
At the time, Lochmiller called the project a unique opportunity to “sustainably power the future of AI.” Although a specific launch date wasn’t confirmed, the facility was expected to go live in 2025.
Crusoe’s transition to AI comes at a time when the U.S. government is also turning its attention to the sector. Since returning to office in 2025, President Donald Trump has signed an executive order aimed at encouraging American leadership in artificial intelligence.
Source link
Bitcoin
What Next For XRP, DOGE as Bitcoin Price Action Shows Bearish Double Top Formation
Published
13 hours agoon
March 26, 2025By
admin
Bitcoin’s (BTC) recovery looks to have run out of steam with an emergence of a double top bearish reversal pattern on the short duration price charts.
BTC peaked near $87,400 last week, with prices pulling back to around $84,000 on Friday and staging a recovery to above $87,000 before stalling again. This sequence of two prominent peaks at roughly the same level, separated by a trough, hints at a classic double top formation. This bearish pattern often signals the end of an uptrend.

The double top pattern typically requires confirmation through a decisive drop below the “neckline,” the support level between the two peaks, which lies at around $86,000.
Should this occur, BTC could decline toward $75,000 or lower in the short term. However, long-term charts continue to indicate the asset remains in an ascending range.
Traders reacted positively to the U.S. Federal Reserve’s dovish stance on inflation and a cooldown in concerns around the upcoming U.S. tariffs, which have supported gains in the past week.
However, the lack of altcoin correlation with BTC’s recent moves hints that the current price action might lack broad market support, raising the possibility of a “fakeout” rally.
A potential drop in BTC will likely spread over to major tokens, denting recent gains and hopes of a lasting rally. Dogecoin (DOGE), heavily influenced by market sentiment and speculative trading, could see amplified losses if bitcoin’s bearish pattern plays out, while XRP might see reduced momentum, especially given its sensitivity to market sentiment and regulatory developments.
Solana could be particularly sensitive due to its recent volatility and technical indicators — with it coming close to forming a “death cross” (a bearish signal where the 50-day moving average crosses below the 200-day) in mid-April, a pattern that historically leads to deeper losses.
For now, bitcoin hovers in a critical zone. A weekly close below $84,000 could confirm the bearish double top scenario, while a push above $87,500 might invalidate it, potentially reigniting bullish momentum.
Source link

New SEC Chair Paul Atkins Holds $6,000,000 in Crypto-Related Investments – Here’s His Portfolio: Report

We’ve Turned A Generation Of Bitcoiners Into Digital Goldbugs

Solana DEX Raydium’s Pump.fun Alternative Is Going Live ‘Within a Week’

Google Cloud joins Injective as validator, expands Web3 tools

U.S. House Stablecoin Bill Poised to Go Public, Lawmaker Atop Crypto Panel Says

South Korea Urges Google To Block 17 Unregistered Crypto Exchanges

Bitcoin Rally To $95K? Market Greed Suggests It’s Possible

Polymarket faces scrutiny over $7M Ukraine mineral deal bet

Morgan Stanley Warns of Short-Lived Stock Market Rally, Says Equities To Print ‘Durable’ Low Later in the Year

Stablecoins Are The CBDCs

Ethereum Volatility Set to Surge in April as Derive Flags Bearish Sentiment Shift

Crusoe Energy sells Bitcoin mining arm to NYDIG, turns focus to AI

What Next For XRP, DOGE as Bitcoin Price Action Shows Bearish Double Top Formation

Why Is Pi Coin Price Down Another 12% Today?

XRP Price Struggles at Key Resistance—Can Bulls Force a Breakout?

Arthur Hayes, Murad’s Prediction For Meme Coins, AI & DeFi Coins For 2025

Expert Sees Bitcoin Dipping To $50K While Bullish Signs Persist

Aptos Leverages Chainlink To Enhance Scalability and Data Access

Bitcoin Could Rally to $80,000 on the Eve of US Elections

Sonic Now ‘Golden Standard’ of Layer-2s After Scaling Transactions to 16,000+ per Second, Says Andre Cronje

Institutional Investors Go All In on Crypto as 57% Plan to Boost Allocations as Bull Run Heats Up, Sygnum Survey Reveals

Crypto’s Big Trump Gamble Is Risky

Ripple-SEC Case Ends, But These 3 Rivals Could Jump 500x

Has The Bitcoin Price Already Peaked?

A16z-backed Espresso announces mainnet launch of core product

Xmas Altcoin Rally Insights by BNM Agent I

Blockchain groups challenge new broker reporting rule

Trump’s Coin Is About As Revolutionary As OneCoin

The Future of Bitcoin: Scaling, Institutional Adoption, and Strategic Reserves with Rich Rines

Is $200,000 a Realistic Bitcoin Price Target for This Cycle?
Trending

 24/7 Cryptocurrency News5 months ago
Arthur Hayes, Murad’s Prediction For Meme Coins, AI & DeFi Coins For 2025

 Bitcoin2 months ago
Expert Sees Bitcoin Dipping To $50K While Bullish Signs Persist

 24/7 Cryptocurrency News3 months ago
Aptos Leverages Chainlink To Enhance Scalability and Data Access

 Bitcoin5 months ago
Bitcoin Could Rally to $80,000 on the Eve of US Elections

 Altcoins2 months ago
Sonic Now ‘Golden Standard’ of Layer-2s After Scaling Transactions to 16,000+ per Second, Says Andre Cronje

 Bitcoin4 months ago
Institutional Investors Go All In on Crypto as 57% Plan to Boost Allocations as Bull Run Heats Up, Sygnum Survey Reveals

 Opinion5 months ago
Crypto’s Big Trump Gamble Is Risky

 Price analysis5 months ago
Ripple-SEC Case Ends, But These 3 Rivals Could Jump 500x


