
cryptocurrency
Crypto exchange Backpack, founded by former FTX execs, acquires FTX EU


FTX alumni’s Backpack Exchange completes acquisition of FTX EU, set to launch MiFID II-regulated crypto products.
Backpack, a crypto exchange founded by former FTX executives, has acquired FTX EU, the former European arm of FTX, as part of its expansion into the European market. The acquisition, approved by the FTX bankruptcy court and the Cyprus Securities and Exchange Commission, will allow Backpack to offer regulated crypto derivatives and other financial products to European users, the company said in a blog announcement.
The new European branch will provide a range of crypto derivatives, including perpetual futures. This comes as other exchanges exit Europe, leaving a gap in the regulated crypto derivatives market. Backpack chief executive Armani Ferrante says becoming a MiFID II-licensed entity “demonstrates our dedication to meeting the highest regulatory standards and is a significant step to bringing transparent, secure, and regulated crypto trading to an underserved European market.”
In addition to offering new products, Backpack EU will handle the distribution of FTX bankruptcy claims to FTX EU customers. Backpack EU will also integrate traditional payment systems, allowing users to make payments across Europe via SEPA and wire transfers, the announcement reads.
The company plans to reactivate its EU license and launch Backpack EU in Q1 2025, though no exact timeframe has been provided for the launch.
Founded in 2022 by Armani Ferrante, an early employee of Alameda Research, Backpack was initially launched as the non-custodial Backpack Wallet. In November 2022, during the collapse of FTX, Backpack lost $14.5 million, which was 88% of its operating funds. Despite that setback, the team chose to continue building with minimal funding.
Source link


Reason to trust
![]()
Strict editorial policy that focuses on accuracy, relevance, and impartiality
Created by industry experts and meticulously reviewed
The highest standards in reporting and publishing
Strict editorial policy that focuses on accuracy, relevance, and impartiality
Morbi pretium leo et nisl aliquam mollis. Quisque arcu lorem, ultricies quis pellentesque nec, ullamcorper eu odio.
XRP has struggled to gain momentum, with its price caught in a downtrend since the beginning of March. Although XRP has managed to push up in the past five days after reaching a low of $1.93 on March 11, it has yet to fully recoup its losses in the first week of the month.
Related Reading
The altcoin’s long-term prospects are still on bullish speculation, but its short-term price action has frustrated traders looking for signs of a breakout. Amid this stagnation, crypto analyst Egrag Crypto has outlined specific price levels that could determine whether XRP finally reverses its course.
Analyst Identifies $2.65 As Key Level Before XRP Can Challenge $3.00
Egrag Crypto, a long-time bullish advocate for XRP, recently took to social media platform X to outline key price levels that could determine the cryptocurrency’s next significant move. He identified $2.65 as the first critical threshold the coin must reclaim to sustain meaningful bullish momentum. However, the analyst expressed concern over XRP’s repeated tests of lower boundaries, which is in reference to the recent bottom at $1.93.
According to the analyst, the frequent retests of this support level are a double-edged sword. While multiple touches on resistance can eventually trigger a breakout, repeated tests of support weaken its integrity, increasing the likelihood of a breakdown. He likened this pattern to knocking on a door that would eventually open or break. He highlighted six instances of XRP retesting this zone since December 2024 on a 12-hour candlestick chart, warning that prolonged weakness could pave the way for further downside.
For the crypto to escape this cycle and shift into bullish territory, Egrag emphasized the importance of a strong close above $3.00, not just a brief move past it. This level has served as the upper resistance trendline for the past two weeks and has been a barrier to any sustained uptrend. Failure to break and hold above $3.00 could cause continued correction in the short term and keep XRP trapped in its current range.
However, the analyst believes XRP’s chances of reaching $3.00, considering the current price action, are slim without securing a close above $2.65.

Image From X: EGRAG CRYPTO
What’s Next For XRP After $3?
March has been particularly bearish for XRP, with sellers maintaining control as it failed to reclaim lost ground. However, if XRP bulls manage to close above $3 before the end of the month, it will open up the door for the resumption of a price rally. With this in mind, Egrag set an initial target of $4.80, placing XRP at new all-time highs.
Related Reading
Interestingly, this target is modest compared to the analyst’s more ambitious long-term projections. Egrag has previously predicted that XRP could surge to $110 in the long term. At the time of writing, XRP is trading at $2.37 and is still 26.5% away from reaching $3.
Featured image from Crypto Logos, chart from TradingView
Source link
Reason to trust
![]()
Strict editorial policy that focuses on accuracy, relevance, and impartiality
Created by industry experts and meticulously reviewed
The highest standards in reporting and publishing
Strict editorial policy that focuses on accuracy, relevance, and impartiality
Morbi pretium leo et nisl aliquam mollis. Quisque arcu lorem, ultricies quis pellentesque nec, ullamcorper eu odio.
US President Trump’s outspoken acceptance of near-term economic hardship has placed risk assets—including Bitcoin (BTC) and the broader crypto market—under mounting pressure. According to a thread by The Kobeissi Letter on X, President Trump’s strategy revolves around tolerating significant “short term pain” in order to drive down inflation and facilitate the refinancing of over $9 trillion in US debt.
Will Crypto Survive Trump’s ‘Short-Term Pain’ Strategy?
The impact on cryptocurrencies has been immediate and pronounced. While US equities have shed an estimated $5 trillion in market value this year, digital assets have also suffered steep losses. Since President Trump’s inauguration on January 21, Bitcoin (BTC) has declined by approximately -23%, Ethereum (ETH) has tumbled by roughly -43% and the broader crypto market has experienced even more dramatic price drops.
Related Reading
Although high volatility is nothing new in crypto, the synchronized downturn suggests that crypto assets are not immune to macroeconomic forces. The Kobeissi Letter adds, “Based on our research, President Trump made this conclusion BEFORE inauguration. However, he began formally articulating it on March 6th. Below is the headline that destroyed investor confidence in 2025. President Trump is no longer the ‘stock market’s President’ (for now).”
The Kobeissi Letter points to March 9 as the date President Trump further confirmed his stance by noting that America is in a “period of transition” and that it will “take a little time,” implying a willingness to tolerate near-term market turbulence. During this period, Commerce Secretary Lutnick’s statement on March 6—“Stock market not driving outcomes for this admin”—was followed by Treasury Secretary Bessent’s remark, “Not concerned about a little volatility.”
Although The Kobeissi Letter’s analysis notes that the administration’s viewpoint solidified before inauguration, it cites President Trump’s urgent focus on the year 2025, when $9.2 trillion in US debt will either mature or need to be refinanced. The thread states, “First, as we have previously noted, the US is facing a massive refinancing task. In 2025, $9.2 TRILLION of US debt will either mature or need to be refinanced. The quickest way to LOWER rates ahead of this colossal refinancing would be a recession.”
Related Reading
Beyond debt concerns, The Kobeissi Letter also highlights the administration’s drive to reduce oil prices and the US trade deficit as part of the same economic calculation. Since President Trump took office, oil has fallen by over 20%. “Furthermore, a clearly defined part of President Trump’s strategy has been to LOWER oil prices. Oil prices are down 20%+ since Trump took office. This morning, Citigroup said oil prices falling to $53 would lower inflation to 2%. What would lower oil prices? A recession.”
Meanwhile, the administration’s extensive use of tariffs, which The Kobeissi Letter describes as “levying tariffs on almost ALL US trade partners,” is chipping away at GDP growth estimates, further hinting that a deliberate slowdown is in motion.
The Kobeissi Letter also notes, “On top of this, DOGE and Trump are attempting to cut TONS of government jobs. These are the same jobs that have accounted for much of the recent job ‘growth’ in the US. Government jobs have risen by 2 million over the last 4.5 years. Cutting these jobs will spur a recession.” DOGE leader Elon Musk appears resigned to short-term declines. Even after Tesla (TSLA) recorded its seventh-largest historical drop on March 10, Musk posted that “It will be fine long-term.”
For crypto traders and investors, the “short term pain” scenario by Trump is currently dictating the price action. The question, the analysts from The Kobeissi Letter posit, is whether this will lead to a more favorable economic landscape in the long run. “Is the ‘short term pain’ worth the ‘long term gain’ in President Trump’s economic strategy?”.
At press time, the BTC price remained under heavy downward pressure and traded at $82,000.
Featured image from Shutterstock, chart from TradingView.com
Source link
Reason to trust
![]()
Strict editorial policy that focuses on accuracy, relevance, and impartiality
Created by industry experts and meticulously reviewed
The highest standards in reporting and publishing
Strict editorial policy that focuses on accuracy, relevance, and impartiality
Morbi pretium leo et nisl aliquam mollis. Quisque arcu lorem, ultricies quis pellentesque nec, ullamcorper eu odio.
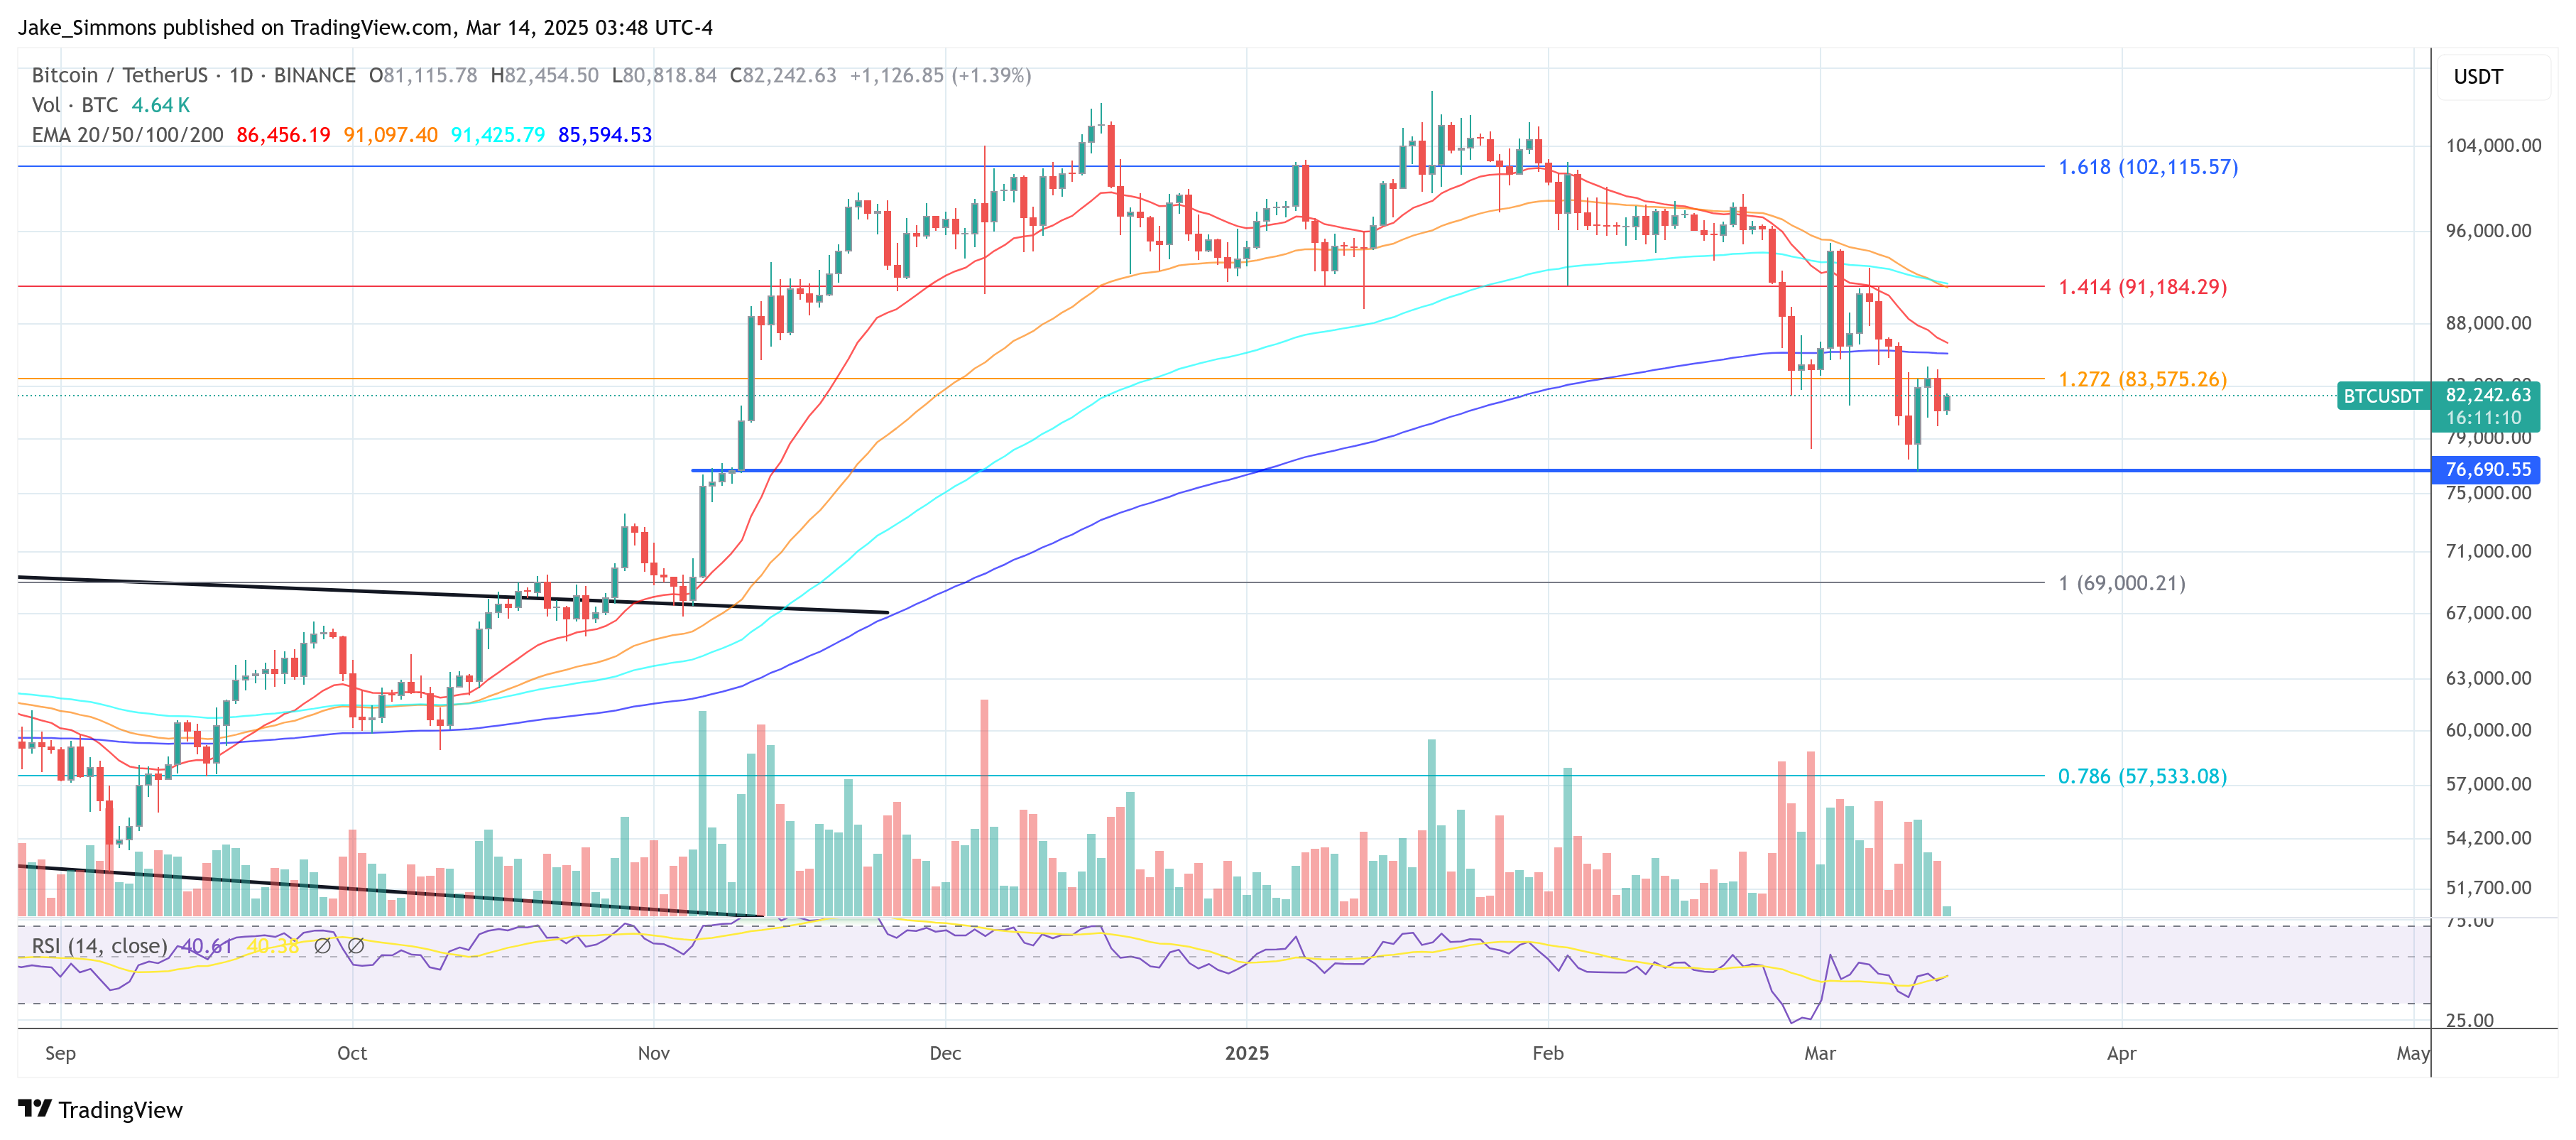
In an X post published yesterday, crypto analyst Matthew Hyland highlighted that according to the weekly timeframe chart, Bitcoin (BTC) is likely to test the support level between $69,000 to $74,000 in the coming months.
Is The Bitcoin Bottom In?
Hyland noted that BTC’s weekly resistance level currently hovers around the $90,500 level. The analyst emphasized that if BTC has a weekly close above $89,000, then it may indicate that the market bottom is in. He added:
If we do get a weekly close above this area ($89,000 to $91,000), I think the low is in for Bitcoin, and we are not going down to this area.
To recall, BTC last traded above $89,000 earlier this month on March 9. From there, the cryptocurrency experienced a breakdown to lower price levels, primarily due to rising macroeconomic uncertainties due to US President Donald Trump’s trade tariffs on numerous countries.
Related Reading
According to data from cryptocurrency exchange Binance, after failing to defend the $89,000 level, BTC ended up falling as low as $76,606 on March 10. Since then, the digital asset has made slight recovery, buoyed by lower than anticipated US CPI inflation data and is currently trading in the low $80,000 level.
BTC Faces Strong Resistance At $86,100
Similarly, in a recent Quicktake post on CryptoQuant, analyst Yonsei_dent highlighted the significance of short-term holder (STH) Realized Price in determining the digital asset’s future price trajectory.
Related Reading
For the uninitiated, Bitcoin’s Realized Price refers to the average acquisition cost of investors while STH refers to holders who have held BTC for less than six months. These investors are typically more sensitive to market movements.
The analyst remarked that the weighted average Realized Price for STHs who have held BTC for one week to six months lies around $91,800, suggesting that these investors are currently in a loss position.
The three months to six months STH cohort has a Realized Price of $86,100, denoting a strong resistance level for the digital asset in the short-term. Notably, this group of holders has the highest share of Realized Cap among STHs, hinting that selling pressure could magnify around this price level.
With regard to major support levels, long-term holders (LTH) with a holding time of six months to twelve months have a Realized Price of $63,700. The post adds:
The highest volume profile over the past year is concentrated around $64,000. This reinforces the idea that this area could serve as a strong support level.
If BTC fails to clear some of its immediate resistance levels, there is a high possibility that it may follow Arthur Hayes prediction of finding a bottom around $70,000. That said, several indicators suggest that BTC may be undervalued at its current market price. At press time, BTC trades at $81,745, up 0.7% in the past 24 hours.

Featured image from Unsplash, chart from TradingView.com
Source link

Trump, Associates Net $390 Million Payday From World Liberty Token Sale

Bitcoin Price Eyes $200,000 Breakout If This History Aligns

Gold-Backed Tokens Outperform as ‘Bond King’ Gundlach Sees Precious Metal Hit $4,000

Ethena Labs, Securitize launch blockchain for DeFi and tokenized assets

Shiba Inu Gains Momentum: SHIB Price Breaks Above 100-Day Moving Average, What’s Next?

A Saint Patrick’s Day Price History

Memecoin Insider Creates Wolf of Wall Street-Inspired Coin Despite Potential Interpol Warrant: Report

Bitfarms stock dips despite $110m acquisition

Police Arrest Four Teens Over Amouranth Home Invasion, Attempted Bitcoin Theft

MUBARAK Coin Price Soars 22% Amid This Binance Announcement, What’s Next?

Michael Saylor’s MSTR Purchases 130 Additional BTC

Michael Saylor’s Strategy makes smallest Bitcoin purchase on record
Bitcoin To $10 Million? Experts Predict Explosive Growth By 2035

Dormant whale sends 300 BTC to FalconX as Bitcoin nears $84k CME gap

Bitcoin Flashing Bullish Reversal Signal Amid Waning Sell-Pressure, According to Crypto Strategist


 24/7 Cryptocurrency News4 months ago
Arthur Hayes, Murad’s Prediction For Meme Coins, AI & DeFi Coins For 2025

 Bitcoin2 months ago
Expert Sees Bitcoin Dipping To $50K While Bullish Signs Persist

 24/7 Cryptocurrency News2 months ago
Aptos Leverages Chainlink To Enhance Scalability and Data Access

 Bitcoin4 months ago
Bitcoin Could Rally to $80,000 on the Eve of US Elections

 Altcoins2 months ago
Sonic Now ‘Golden Standard’ of Layer-2s After Scaling Transactions to 16,000+ per Second, Says Andre Cronje

 Bitcoin4 months ago
Institutional Investors Go All In on Crypto as 57% Plan to Boost Allocations as Bull Run Heats Up, Sygnum Survey Reveals

 Opinion4 months ago
Crypto’s Big Trump Gamble Is Risky

 Price analysis4 months ago
Ripple-SEC Case Ends, But These 3 Rivals Could Jump 500x
