doge
Dogecoin (DOGE) Eyes $0.50 Again: Is a New Rally on the Horizon?
Published
5 months agoon
By
admin
Dogecoin is consolidating gains above the $0.320 resistance against the US Dollar. DOGE is holding gains and eyeing more upsides above $0.400.
- DOGE price started a consolidating like Bitcoin and stayed above the $0.320 resistance level.
- The price is trading near the $0.3750 level and the 100-hourly simple moving average.
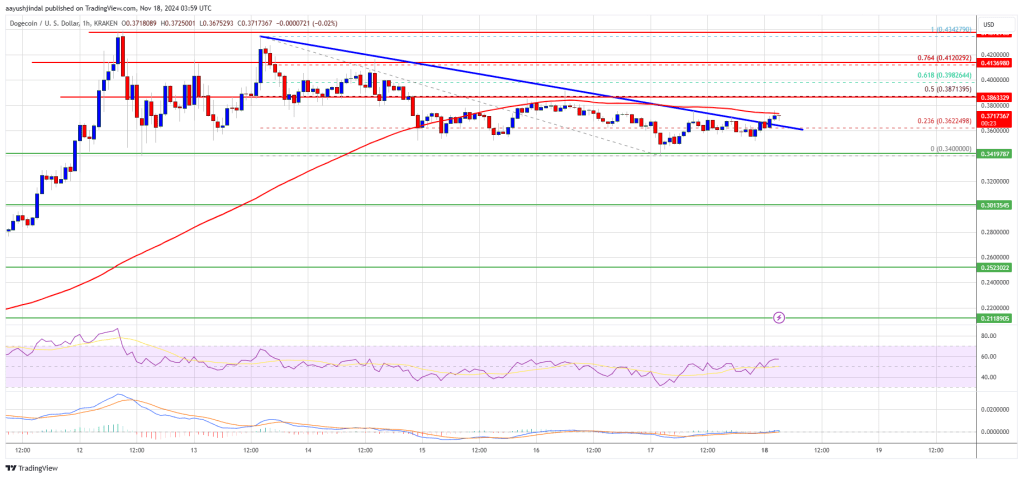
- There was a break above a key bearish trend line with resistance at $0.3670 on the hourly chart of the DOGE/USD pair (data source from Kraken).
- The price could continue to rally if it clears the $0.400 and $0.4150 resistance levels.
Dogecoin Price Eyes Fresh Surge
Dogecoin price started a consolidating phase above the $0.320 zone like Bitcoin and Ethereum. DOGE formed a base above $0.350 and is currently rising.
There was a move above the $0.3550 and $0.3620 resistance levels. The price climbed above the 23.6% Fib retracement level of the downward move from the $0.4342 swing high to the $0.3400 low. There was also a break above a key bearish trend line with resistance at $0.3670 on the hourly chart of the DOGE/USD pair.
Dogecoin price is now trading near the $0.3750 level and the 100-hourly simple moving average. Immediate resistance on the upside is near the $0.3720 level.
The next major resistance is near the $0.3880 level or the 50% Fib retracement level of the downward move from the $0.4342 swing high to the $0.3400 low. A close above the $0.3880 resistance might send the price toward the $0.400 resistance. Any more gains might send the price toward the $0.4200 level. The next major stop for the bulls might be $0.500.
Are Dips Limited In DOGE?
If DOGE’s price fails to climb above the $0.3720 level, it could start a downside correction. Initial support on the downside is near the $0.3650 level. The next major support is near the $0.3500 level.
The main support sits at $0.320. If there is a downside break below the $0.320 support, the price could decline further. In the stated case, the price might decline toward the $0.300 level or even $0.2950 in the near term.
Technical Indicators
Hourly MACD – The MACD for DOGE/USD is now gaining momentum in the bullish zone.
Hourly RSI (Relative Strength Index) – The RSI for DOGE/USD is now above the 50 level.
Major Support Levels – $0.3650 and $0.3500.
Major Resistance Levels – $0.3720 and $0.3880.
Source link
You may like


AVAX Falls 2.1% as Nearly All Assets Trade Lower


What is a VTuber, and how do you become one in 2025?


Top Expert’s Update Sets $10 Target


How Academia Interacts With The Bitcoin Ecosystem


AB DAO and Bitget Launch Dual Reward Campaign, Distributing $2.6M Worth of $AB Globally


AI crypto tokens at risk as Nvidia faces restrictions on China exports
doge
Dogecoin Whales Buy 800 Million DOGE in 48 Hours – Smart Money Or Bull Trap?
Published
20 hours agoon
April 15, 2025By
admin
Reason to trust

Strict editorial policy that focuses on accuracy, relevance, and impartiality
Created by industry experts and meticulously reviewed
The highest standards in reporting and publishing
Strict editorial policy that focuses on accuracy, relevance, and impartiality
Morbi pretium leo et nisl aliquam mollis. Quisque arcu lorem, ultricies quis pellentesque nec, ullamcorper eu odio.
Dogecoin is showing signs of strength after weeks of volatility and market uncertainty. The meme-inspired cryptocurrency has held firm above crucial support levels and is now pushing toward a potential recovery rally. After reclaiming the $0.15 mark, bulls are looking to build momentum, with the $0.17 level emerging as the next major resistance to break. A successful move above this threshold could confirm a broader trend reversal and reignite bullish sentiment across the meme coin sector.
Related Reading
Supporting this outlook, recent on-chain data from Santiment shows that Dogecoin whales have been highly active—accumulating over 800 million DOGE in the last 48 hours. This surge in whale buying activity adds weight to the bullish thesis, suggesting that larger players are positioning for a move higher. The renewed accumulation, paired with improving technical conditions, has sparked optimism among traders and investors who believe Dogecoin could be gearing up for its next leg upward.
Still, caution remains, as global macroeconomic tensions continue to create unpredictable conditions across the financial markets. For Dogecoin to confirm a recovery rally, bulls must hold current levels and push through near-term resistance in the coming sessions.
Dogecoin Faces Crucial Resistance As Whale Accumulation Builds
Dogecoin is now at a pivotal point, trading just below key resistance levels after a strong rebound from recent lows. As broader market conditions improve and global tensions—especially around trade and tariffs—begin to cool, analysts are turning their attention to assets like DOGE that have lagged in performance but now show signs of potential upside. The meme coin has managed to reclaim the $0.15 mark, but to validate a broader recovery rally, bulls must push beyond the $0.17–$0.18 zone in the days ahead.
Momentum indicators are beginning to flip bullish, and some market watchers suggest that Dogecoin could be preparing for a breakout. However, sentiment remains mixed, with others pointing to the possibility of a continuation of the downtrend, particularly if resistance holds or macroeconomic conditions deteriorate. Despite this uncertainty, on-chain data paints a more optimistic picture.
Top analyst Ali Martinez shared insights on X, revealing that Dogecoin whales have accumulated over 800 million DOGE in the last 48 hours. This level of accumulation by large holders suggests renewed confidence in the asset’s short-term potential. Historically, such whale activity has often preceded strong price moves in DOGE.
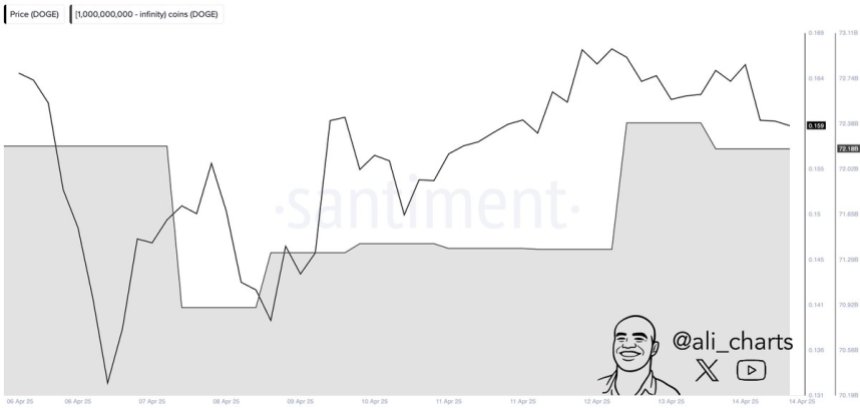
For bulls to take control, Dogecoin must break above near-term resistance and sustain momentum amid a still-volatile environment. A failure to do so could see the asset slip back into consolidation or even retest previous lows. The coming week will be critical for determining whether DOGE’s next move is a breakout or another pullback.
Related Reading
DOGE Price Holds $0.16 As Bulls Aim for Breakout
Dogecoin is trading at $0.16 after failing to reclaim the 4-hour 200 Moving Average (MA) near $0.168, a level that has acted as strong short-term resistance. Despite recent bullish momentum across the crypto market, DOGE bulls are struggling to regain control. The $0.15 level now serves as critical support. If Dogecoin holds this area, there’s a strong chance it could push higher in the coming sessions.
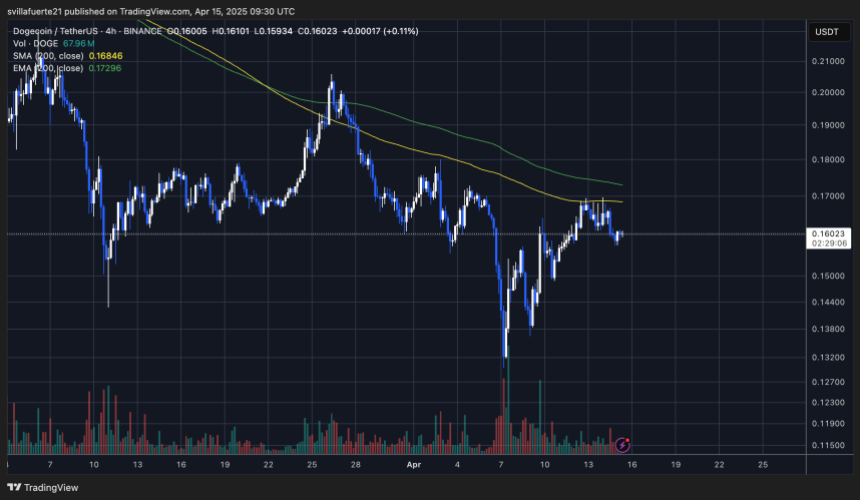
A successful break above $0.17 would be significant, potentially opening the door to a rally toward $0.20, a level not seen since early April. However, price rejection and continued weakness around $0.168 suggest that sellers are still active, and bulls need to reclaim this moving average to build momentum.
Related Reading
If DOGE loses the $0.15 mark, downside risk increases sharply. A drop to $0.13—or even lower—is likely as bearish pressure could intensify in a volatile market. Investors will be watching closely for a clear move in either direction, as Dogecoin sits at a key inflection point. Volume and on-chain data, including recent whale accumulation, suggest potential, but confirmation must come through price action above immediate resistance.
Featured image from Dall-E, chart from TradingView
Source link
doge
Dogecoin Follows This Blueprint, Says Crypto Analyst
Published
2 days agoon
April 14, 2025By
admin
Reason to trust

Strict editorial policy that focuses on accuracy, relevance, and impartiality
Created by industry experts and meticulously reviewed
The highest standards in reporting and publishing
Strict editorial policy that focuses on accuracy, relevance, and impartiality
Morbi pretium leo et nisl aliquam mollis. Quisque arcu lorem, ultricies quis pellentesque nec, ullamcorper eu odio.
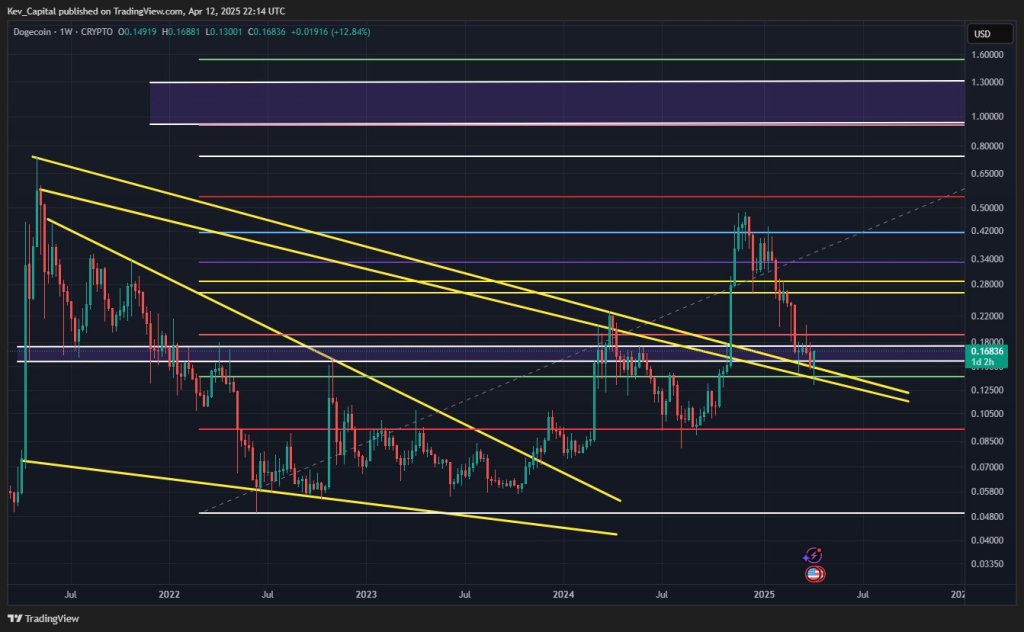
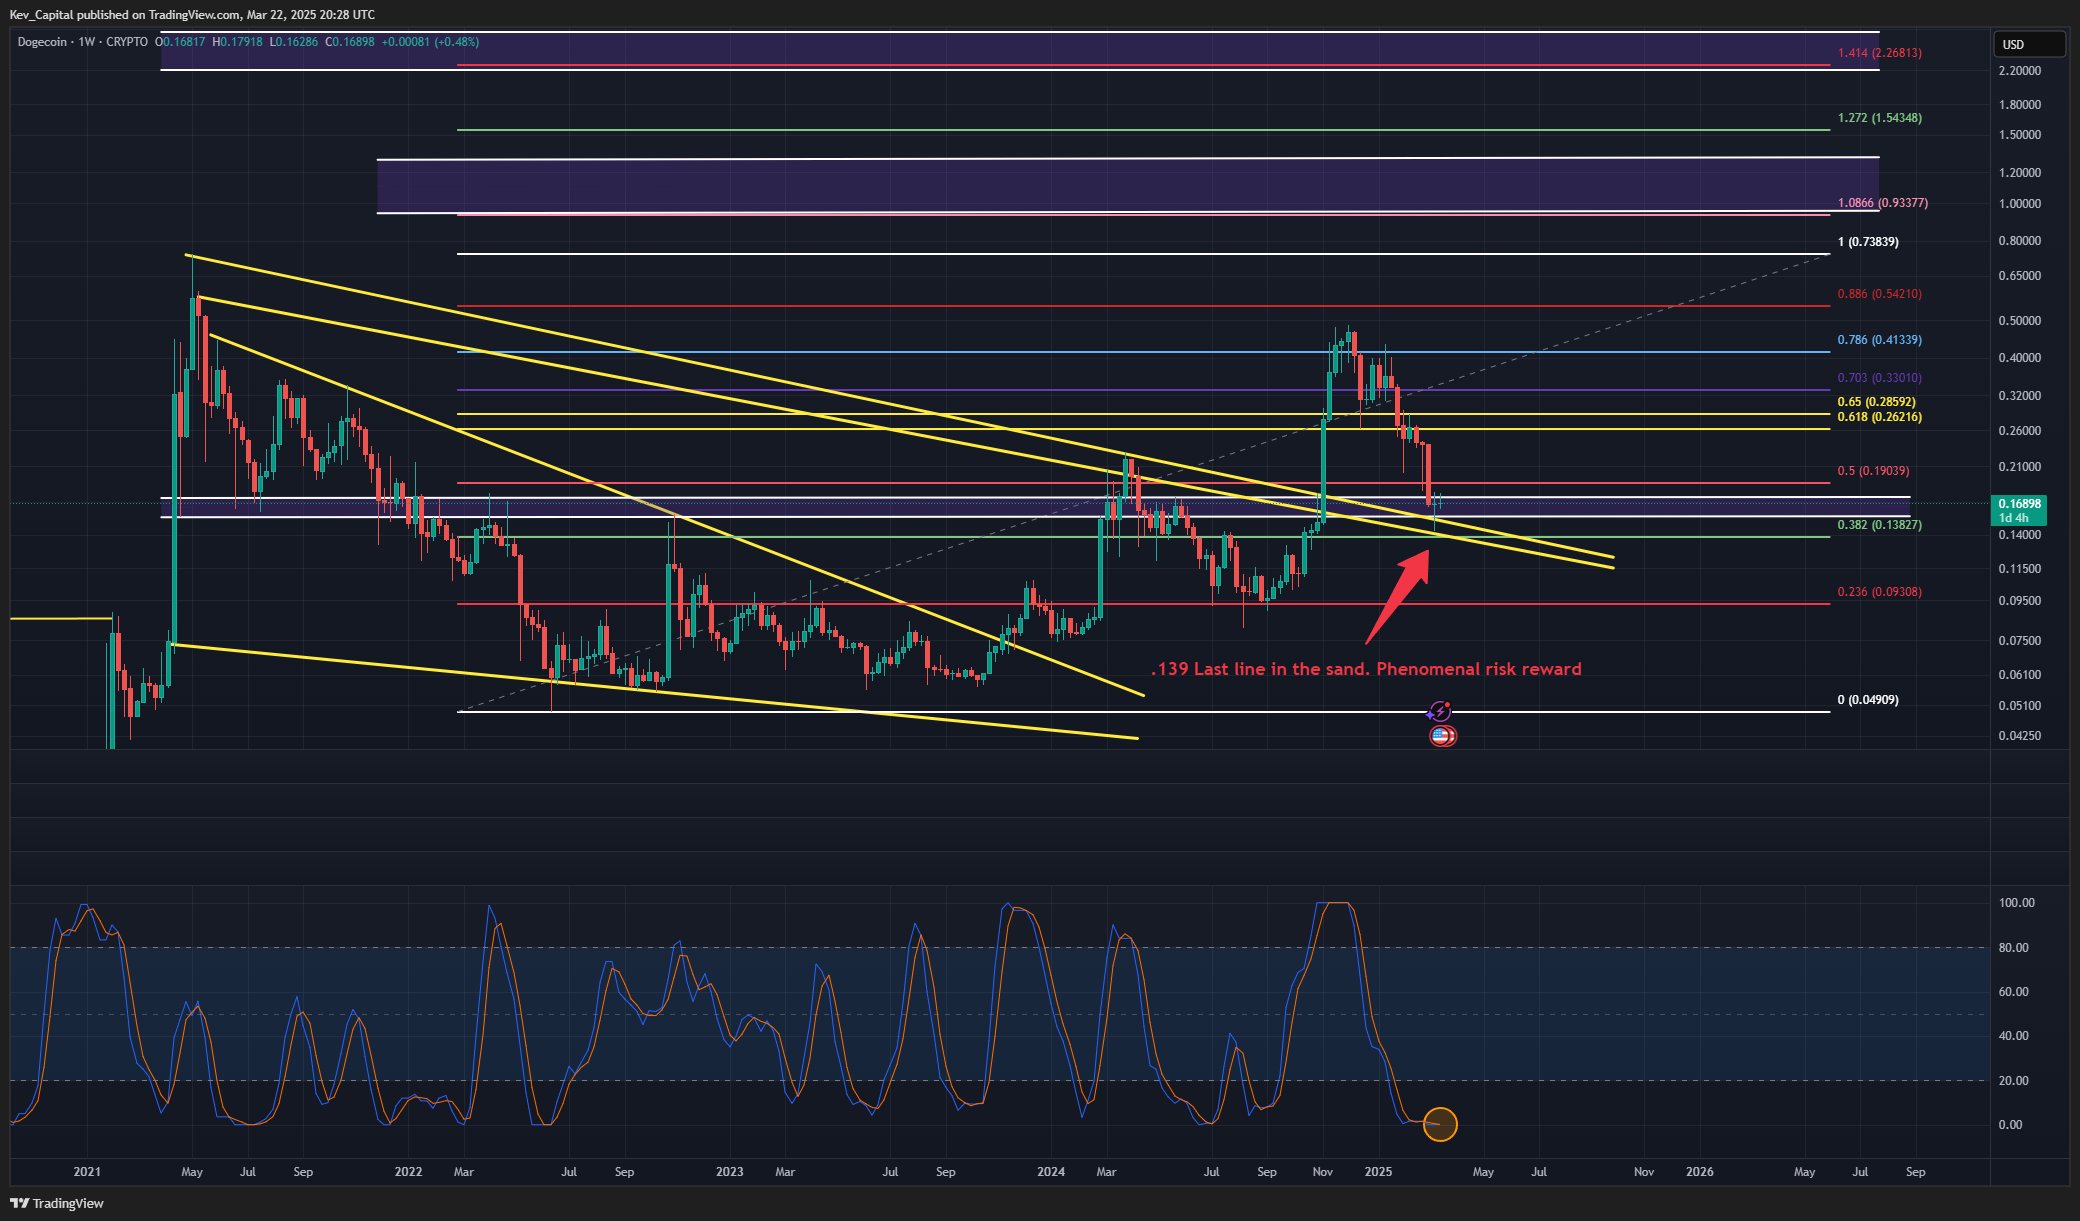
Dogecoin’s price action continues to honor the technical “blueprint” laid out by crypto analyst Kevin (@Kev_Capital_TA), who reaffirmed on Sunday that his strategic roadmap from March 22 remains intact. The weekly chart reveals an extended descending channel drawn with multiple yellow trend lines that originated in 2021 and constricted price action throughout 2022.
Within that formation, the most critical horizontal threshold appears to be $0.139, labeled on the chart as the “Last line in the sand” and described by Kevin as essential for preserving bullish market structure. He notes that maintaining durable weekly closes above this zone is paramount for further upside, while a decisive break beneath $0.139 would nullify the bullish thesis.
Dogecoin Follows The Blueprint
Dogecoin’s retracement from highs near $0.45 earlier this year has so far been contained by a confluence of support channels and Fibonacci retracement levels. According to Kevin’s chart, the primary Fib levels span from roughly $0.049 at the lower bound (0% Fib) to around $2.268 at the 1.414 extension.
Related Reading
Closer inspection shows intermediate Fibonacci markers at $0.090 (0.236), $0.138 (0.382), $0.190 (0.50), $0.262 (0.618), $0.413 (0.786), $0.542 (0.88), $0.738 (1.0), $0.934 (1.0866), and $1.543 (1.272). Since the price is hovering near $0.16–$0.17 at press time, Dogecoin has remained above the 0.382 retracement near $0.138, reinforcing Kevin’s argument that the risk-reward ratio at this level appears “absolutely phenomenal.”
Kevin’s March 22 update describes the confluence of several higher time frame indicators, including the Weekly Stochastic RSI, the 3-Day MACD, and the 2-Week Stochastic RSI, all of which he sees nearing full resets. He cites the previous weekly demand candle, which formed just above $0.139, as a key sign that buyers are stepping in to defend what he calls “the Last line of bull market support.”
The Weekly Stoch RSI on his chart is already situated at low levels, while the 3-Day MACD and 2-Week Stoch RSI appear roughly a month away from bottoming out. According to Kevin, these technical resets should serve as a springboard for Dogecoin’s next significant upward move, provided that Bitcoin, which he believes must hold above $70K in his scenario, remains stable enough to support broader market strength.
Related Reading
On Sunday, Kevin reminded his audience that this strategy, first made public on March 22, is going “exactly according to plan,” given Dogecoin’s confirmed bounce around the $0.139 region and the ongoing drift toward oversold conditions in multiple momentum gauges. He disclosed that his Patreon trading portfolio holds an average entry at $0.15 for this swing and noted that a swift rejection of sub-$0.139 weekly closes, coupled with the bullish stance of the higher time frame indicators, corroborates his confidence in Dogecoin’s recovery potential.
While he acknowledges that “lots of work” still needs to be done for Dogecoin to reclaim loftier levels near the 0.618 Fib around $0.262 or even the 0.786 Fib at $0.413, Kevin maintains that his initial thesis stands as long as the meme-inspired asset preserves its foothold above $0.139. For him, the risk of a breakdown is well-defined if the pivotal support gives way, but should the level persist, he sees the upside potential extending far beyond the current range. As of now, Dogecoin’s price continues to cling to that all-important line in the sand, keeping Kevin’s bullish blueprint very much alive.
At press time, DOGE traded at $0.16493.
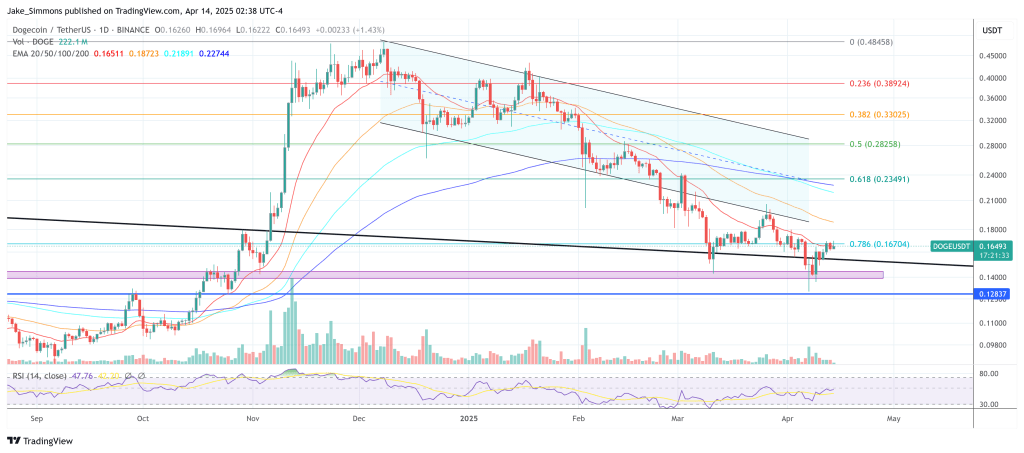
Featured image created with DALL.E, chart from TradingView.com
Source link
doge
Dogecoin Bull Div Plays Out, Analyst Maps Next Price Targets
Published
6 days agoon
April 10, 2025By
admin
Reason to trust

Strict editorial policy that focuses on accuracy, relevance, and impartiality
Created by industry experts and meticulously reviewed
The highest standards in reporting and publishing
Strict editorial policy that focuses on accuracy, relevance, and impartiality
Morbi pretium leo et nisl aliquam mollis. Quisque arcu lorem, ultricies quis pellentesque nec, ullamcorper eu odio.
Dogecoin’s momentum has shifted dramatically following macroeconomic developments and a series of strong technical signals, according to crypto chartist Kevin (@Kev_Capital_TA). Yesterday, the broader crypto market surged after President Donald Trump announced a 90-day pause on tariffs for 75 countries, while raising China’s tariffs to 125%.
Bullish Momentum For Dogecoin
The news sent Bitcoin above the $80,000 threshold and catapulted several major altcoins, including Dogecoin, higher. “Daily Bullish divergence on Dogecoin starting to play here,” Kevin writes in his latest update, while cautioning that “obviously macro news has most to do with this, but nonetheless the charts were giving us hints ahead of time that the opportunity was not guaranteed but there.”
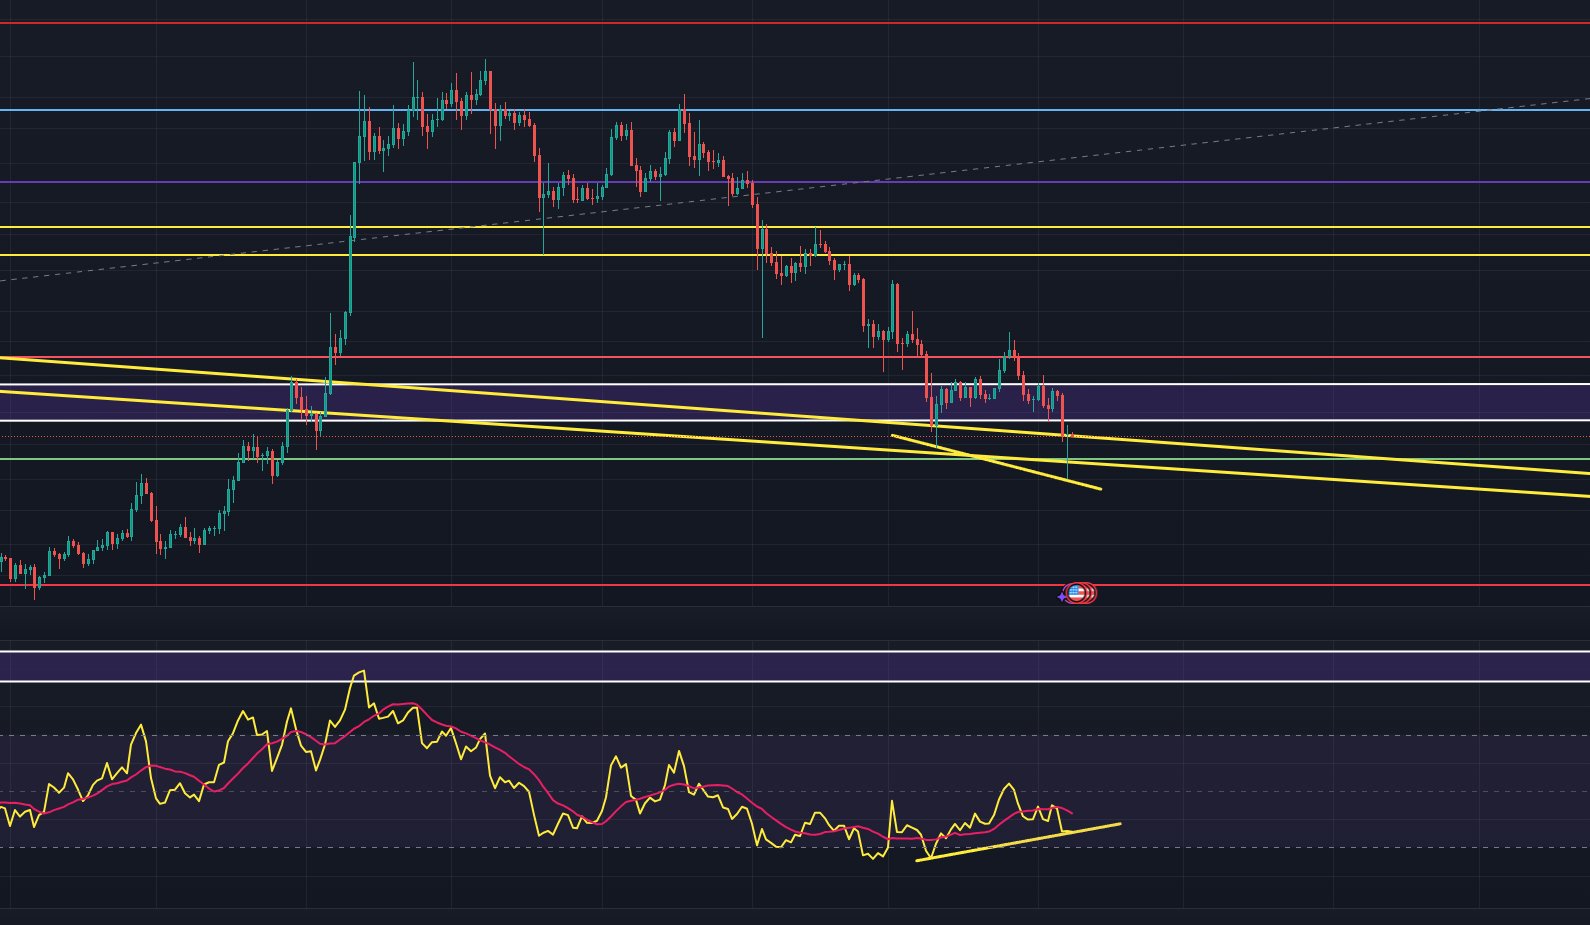
In the hours following the tariff announcement, Dogecoin rallied by approximately 13%, strengthening signs of a bullish divergence Kevin first flagged two days earlier. “Dogecoin came down once again to test the bull market structure ‘lines in the sand’ and somehow even though it cleanly broke through earlier in the day was able to recover and close the daily candle slightly above this support level,” he explained.
Related Reading
Kevin noted the parallel between Dogecoin’s bullish divergence and that of Bitcoin on the daily time frame, suggesting that renewed optimism for DOGE may be tied, in part, to the leading cryptocurrency’s resilience above its own pivotal support.
Kevin’s outlook is rooted in a multi-week assessment of Dogecoin’s technical posture. At the end of March, he pointed to a “weekly demand candle” and the ‘Last line of bull market support.” He emphasized how crucial it remains for Dogecoin to hold above the 0.139 mark. “It will continue to be absolutely vital that Dogecoin hold this level while it resets higher time frame indicators like the 3 Day MACD, Weekly Stoch RSI and 2W Stoch RSI all of which are getting very close to being fully reset,” he said.
DOGE Price Targets
He also described the potential upside for Dogecoin as “phenomenal” relative to the risk of losing that $0.139 threshold for multiple weekly closes. The chart’s Fibonacci retracement and extension levels suggest potential technical targets for Dogecoin that remain relevant for traders seeking directional cues.
Related Reading
These levels begin with the 0.236 at $0.09038, the 0.382 at $0.13827, the 0.5 at $0.19039, the 0.618 at $0.26216, the 0.65 at $0.28529, and the 0.70 at $0.3310. Higher up, the 0.786 reads $0.41339, the 0.88 is $0.54210, the 1.0 level marks $0.73839, and the 1.0866 is $0.93377.
Further on the extension side, the 1.272 stands at $1.54348, and the 1.414 appears at $2.26813. The analyst underscored that “as long as BTC holds these levels and does not lose $70K then I absolutely love this spot on DOGE,” highlighting how the broader market’s trajectory could shape Dogecoin’s path along these technical markers.
However, the coming days will reveal whether Dogecoin can build on the momentum that emerged amid the tariff-related market surge—and whether the well-worn phrase “the trend is your friend” will keep Dogecoin enthusiasts in a bullish mindset.
At press time, DOGE traded at $0.15751.
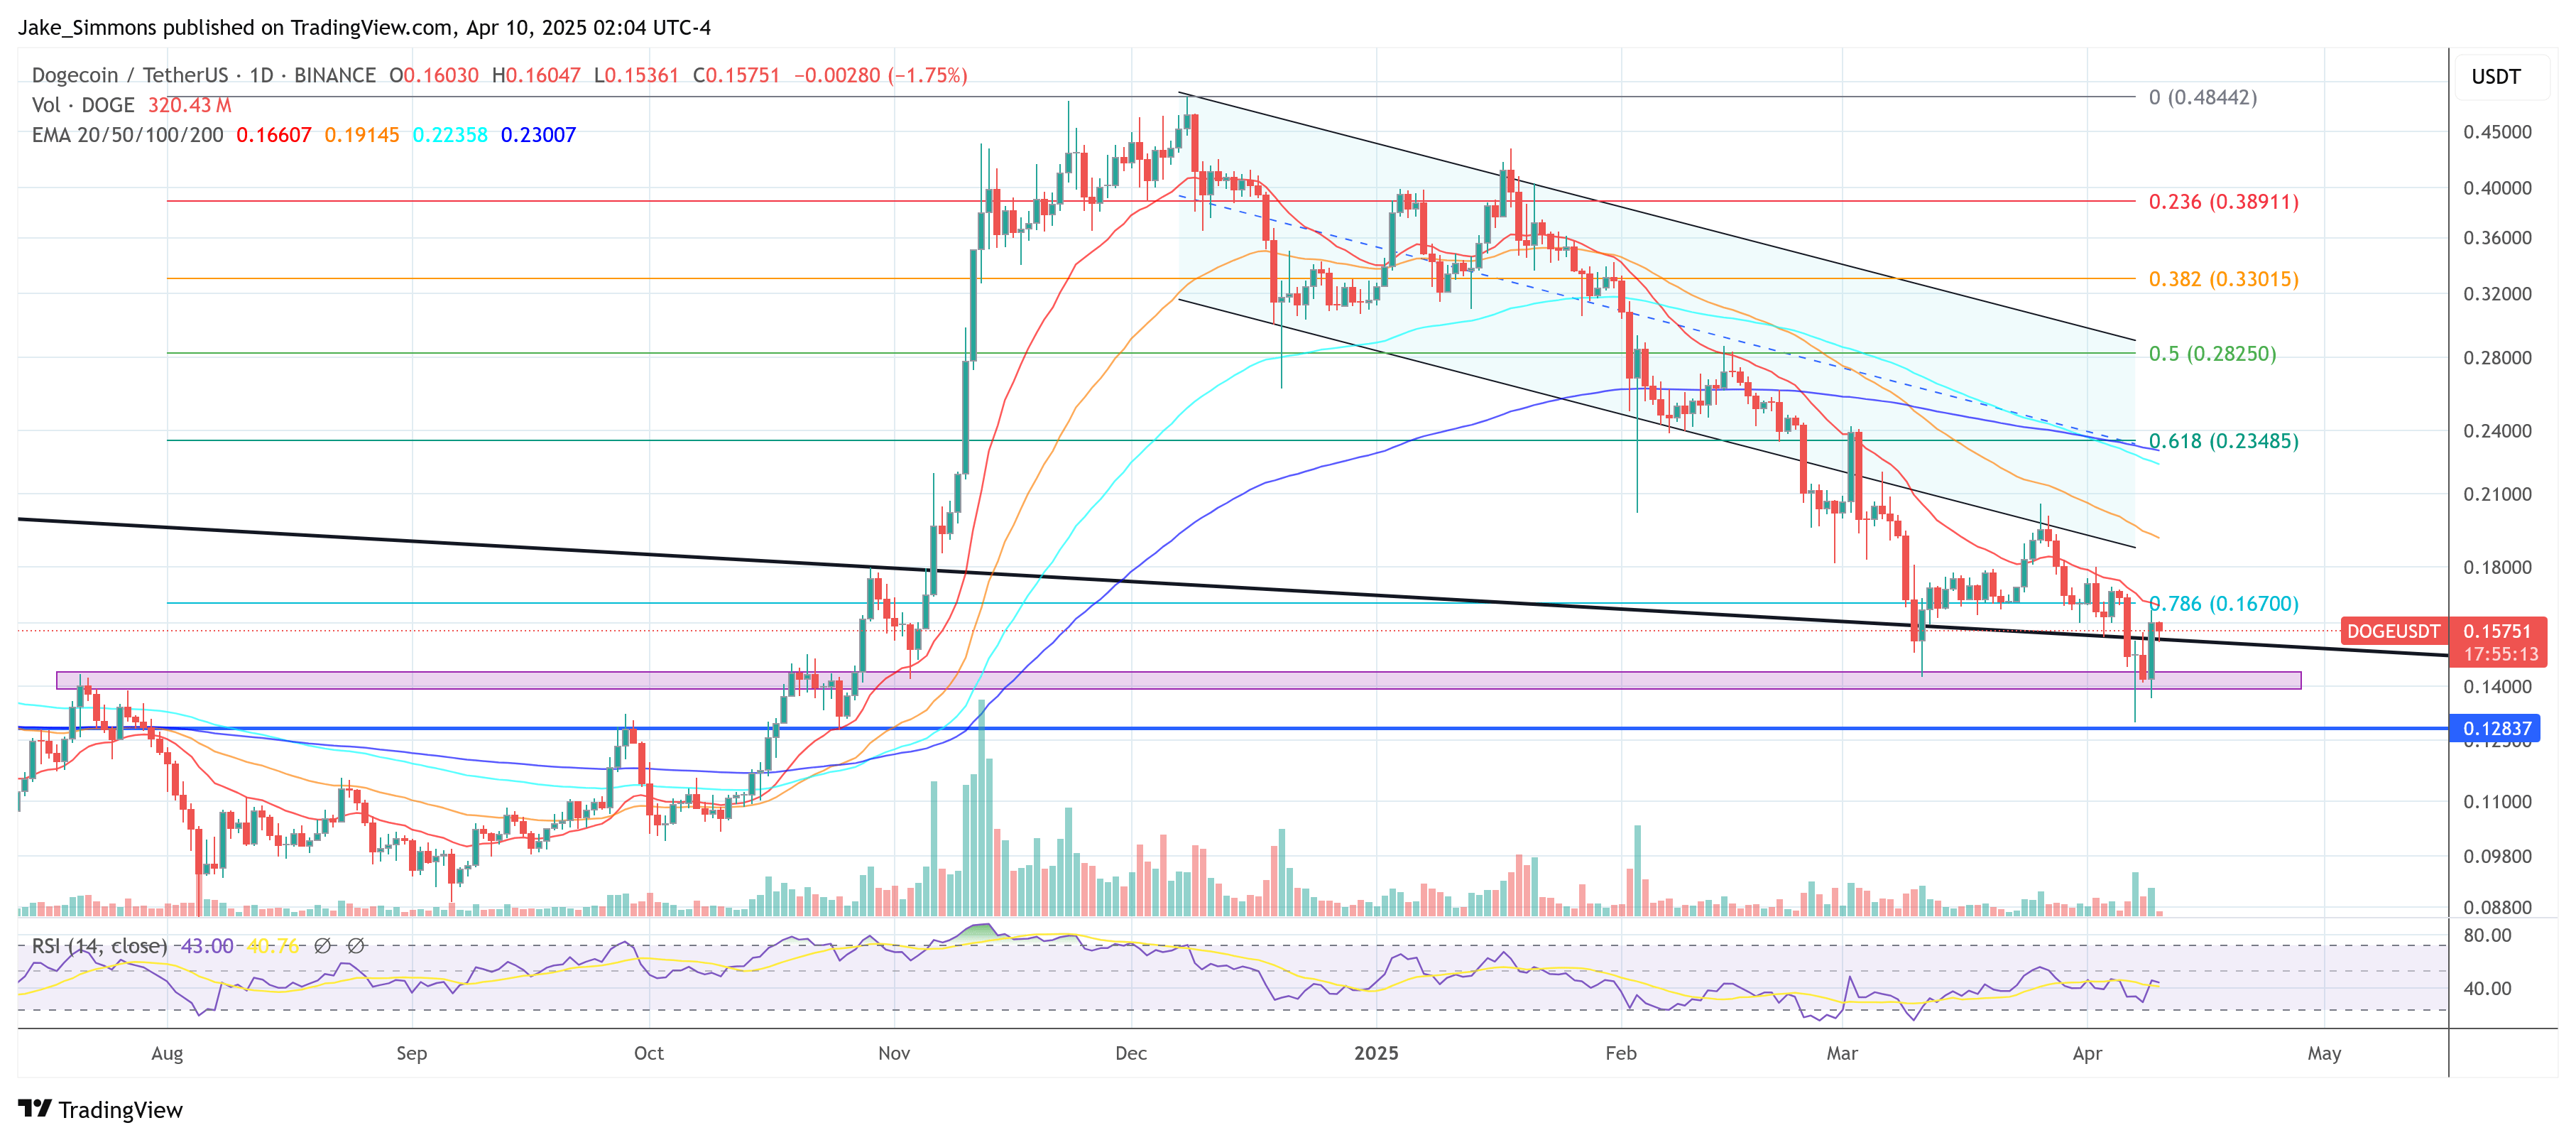
Featured image created with DALL.E, chart from TradingView.com
Source link

AVAX Falls 2.1% as Nearly All Assets Trade Lower

What is a VTuber, and how do you become one in 2025?

Top Expert’s Update Sets $10 Target

How Academia Interacts With The Bitcoin Ecosystem

AB DAO and Bitget Launch Dual Reward Campaign, Distributing $2.6M Worth of $AB Globally

AI crypto tokens at risk as Nvidia faces restrictions on China exports

Coinbase Urges Australia to Vote for Crypto Progress in May

How High Would Pi Network Price Go If Pi Coin Adopts Transparency to Avoid Mantra Pitfalls

XRP’s ‘Rising Wedge’ Breakdown Puts Focus on $1.6 Price Support

China selling seized crypto to top up coffers as economy slows: Report

Ethereum Price Dips Again—Time to Panic or Opportunity to Buy?

The Inverse Of Clown World”

Bitcoin Indicator Flashing Bullish for First Time in 18 Weeks, Says Analyst Who Called May 2021 Crypto Collapse

3iQ and Figment to launch North America’s first Solana staking ETF

Bitcoin Miners Are Selling More BTC to Make Ends Meet: CryptoQuant

Arthur Hayes, Murad’s Prediction For Meme Coins, AI & DeFi Coins For 2025

Expert Sees Bitcoin Dipping To $50K While Bullish Signs Persist

Aptos Leverages Chainlink To Enhance Scalability and Data Access

Bitcoin Could Rally to $80,000 on the Eve of US Elections

Crypto’s Big Trump Gamble Is Risky

Sonic Now ‘Golden Standard’ of Layer-2s After Scaling Transactions to 16,000+ per Second, Says Andre Cronje

Institutional Investors Go All In on Crypto as 57% Plan to Boost Allocations as Bull Run Heats Up, Sygnum Survey Reveals

Ripple-SEC Case Ends, But These 3 Rivals Could Jump 500x

3 Voting Polls Show Why Ripple’s XRP Price Could Hit $10 Soon

Has The Bitcoin Price Already Peaked?

A16z-backed Espresso announces mainnet launch of core product

The Future of Bitcoin: Scaling, Institutional Adoption, and Strategic Reserves with Rich Rines

Xmas Altcoin Rally Insights by BNM Agent I

Blockchain groups challenge new broker reporting rule

I’m Grateful for Trump’s Embrace of Bitcoin
Trending

 24/7 Cryptocurrency News5 months ago
Arthur Hayes, Murad’s Prediction For Meme Coins, AI & DeFi Coins For 2025

 Bitcoin3 months ago
Expert Sees Bitcoin Dipping To $50K While Bullish Signs Persist

 24/7 Cryptocurrency News3 months ago
Aptos Leverages Chainlink To Enhance Scalability and Data Access

 Bitcoin5 months ago
Bitcoin Could Rally to $80,000 on the Eve of US Elections

 Opinion5 months ago
Crypto’s Big Trump Gamble Is Risky

 Altcoins3 months ago
Sonic Now ‘Golden Standard’ of Layer-2s After Scaling Transactions to 16,000+ per Second, Says Andre Cronje

 Bitcoin5 months ago
Institutional Investors Go All In on Crypto as 57% Plan to Boost Allocations as Bull Run Heats Up, Sygnum Survey Reveals

 Price analysis5 months ago
Ripple-SEC Case Ends, But These 3 Rivals Could Jump 500x

