
doge
Dogecoin (DOGE) Poised for a Move: Will It Start a Fresh Increase?

Dogecoin started a downside correction from the $0.180 zone against the US Dollar. DOGE tested $0.1420 and is currently recovering losses.
- DOGE price started a fresh decline from the $0.180 resistance level.
- The price is trading below the $0.1650 level and the 100-hourly simple moving average.
- There is a key bearish trend line forming with resistance at $0.1580 on the hourly chart of the DOGE/USD pair (data source from Kraken).
- The price could start a fresh increase if it clears the $0.1550 and $0.1580 resistance levels.
Dogecoin Price Eyes Fresh Increase
Dogecoin price started a fresh decline after it failed to clear the $0.180 resistance like Bitcoin and Ethereum. DOGE declined below the $0.1720 and $0.1650 support levels.
The price even declined below $0.1550 before the bulls appeared. A low was formed at $0.1422 and the price is now attempting a recovery wave. There was a move above the $0.150 resistance zone. The price climbed above the 23.6% Fib retracement level of the downward move from the $0.1790 high to the $0.1422 low.
Dogecoin price is now trading below the $0.1550 level and the 100-hourly simple moving average. Immediate resistance on the upside is near the $0.1550 level. The next major resistance is near the $0.1580 level. There is also a key bearish trend line forming with resistance at $0.1580 on the hourly chart of the DOGE/USD pair.

A close above the $0.1580 resistance might send the price toward the $0.1600 resistance. Any more gains might send the price toward the $0.1650 level or the 61.8% Fib retracement level of the downward move from the $0.1790 high to the $0.1422 low. The next major stop for the bulls might be $0.1720.
Another Decline In DOGE?
If DOGE’s price fails to climb above the $0.1550 level, it could start another decline. Initial support on the downside is near the $0.1480 level. The next major support is near the $0.1420 level.
The main support sits at $0.1400. If there is a downside break below the $0.1400 support, the price could decline further. In the stated case, the price might decline toward the $0.1320 level or even $0.1300 in the near term.
Technical Indicators
Hourly MACD – The MACD for DOGE/USD is now losing momentum in the bearish zone.
Hourly RSI (Relative Strength Index) – The RSI for DOGE/USD is now above the 50 level.
Major Support Levels – $0.1480 and $0.1420.
Major Resistance Levels – $0.1550 and $0.1580.
Source link


Reason to trust
![]()
Strict editorial policy that focuses on accuracy, relevance, and impartiality
Created by industry experts and meticulously reviewed
The highest standards in reporting and publishing
Strict editorial policy that focuses on accuracy, relevance, and impartiality
Morbi pretium leo et nisl aliquam mollis. Quisque arcu lorem, ultricies quis pellentesque nec, ullamcorper eu odio.
A popular meme coin has shown signs of recovery as it entered bullish territory with analysts showing optimism for the future of the crypto in the upcoming months. Analysts predict that Dogecoin’s current momentum will push it to a possible 318% rally, giving their insights on what is driving this move upward.
Related Reading
Price Rally Around The Corner?
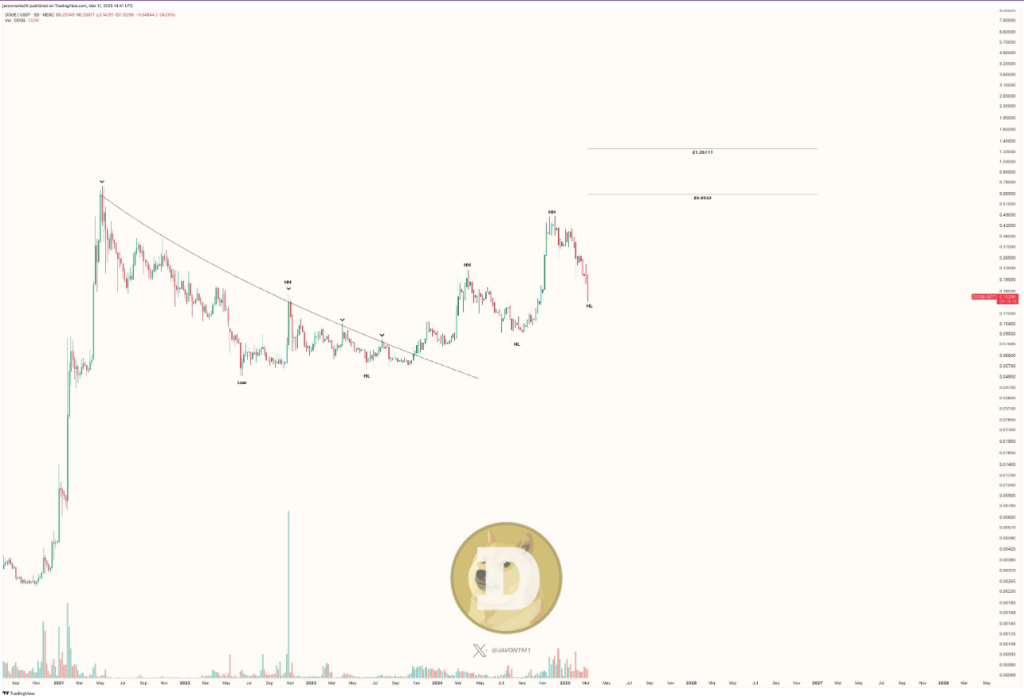
An analyst said in a post that Dogecoin could be heading for a 318% increase, which is possible since the breakout experienced by the meme coin aligns with its historical price movements.
“With the breakout target at $0.6533, another +318% increase to reach it can be in the works and prices may only be preparing here to do so,” JavonTM1 said.
Prices of $DOGE (Dogecoin) are still up nearly +129% since breaking out of the pictured resisting trend and with prices still broken out and in a position to confirm another set of Higher Lows, even more upside can be coming!
With the breakout target at $0.6533, another +318%… https://t.co/nhmMIkJgqv pic.twitter.com/Qum16794Li
— JAVON
MARKS (@JavonTM1) March 11, 2025
JavonTM1 made the prediction after the meme coin soared by 129% following a breach of a critical resistance trendline. “Prices of $DOGE (Dogecoin) are still up nearly +129% since breaking out of the pictured resisting trend, and with prices still broken out and, in a position to confirm another set of Higher Lows, even more upside can be coming!”
The Bullish Impulse Wave
Analysts used the Elliott Wave Theory to explain the future of DOGE. According to the charts, Dogecoin’s price might be “in the middle of a bullish impulse wave.” They argued that the coin’s volume spikes showed that there was an increase in market participation, supporting the possibility of sustained upward movement.
Meanwhile, a curved trendline on the chart indicates that the meme coin has shifted from a prolonged correction phase into a breakout phase.
Last month, JavonTM1 noted that Dogecoin, hitting $0.6533, is just around the corner. “It’s only a matter of time here with such a major breakout response and climb thus far but a move above is looking more and more likely!”
Potential Rebound
Another analyst believes that DOGE is heading towards a potential price rebound, reinforcing the coin’s bullish outlook.
Ali Martinez used the TD Sequential indicator to explain the likely surge, saying that the indicator has flashed a buy signal on the daily chart, a cue used by investors to identify trend reversals.
Martinez added that this usually happens after a bearish phase, indicating that the meme coin could be moving toward the recovery phase.
Related Reading
Data showed that DOGE remains in a strong position following the price breakout, indicating possible further gains.
At press time, Dogecoin is traded at $0.1720 per coin with a market cap of more than $25 billion.
Featured image from Pexels, chart from TradingView
Source link

Reason to trust
![]()
Strict editorial policy that focuses on accuracy, relevance, and impartiality
Created by industry experts and meticulously reviewed
The highest standards in reporting and publishing
Strict editorial policy that focuses on accuracy, relevance, and impartiality
Morbi pretium leo et nisl aliquam mollis. Quisque arcu lorem, ultricies quis pellentesque nec, ullamcorper eu odio.
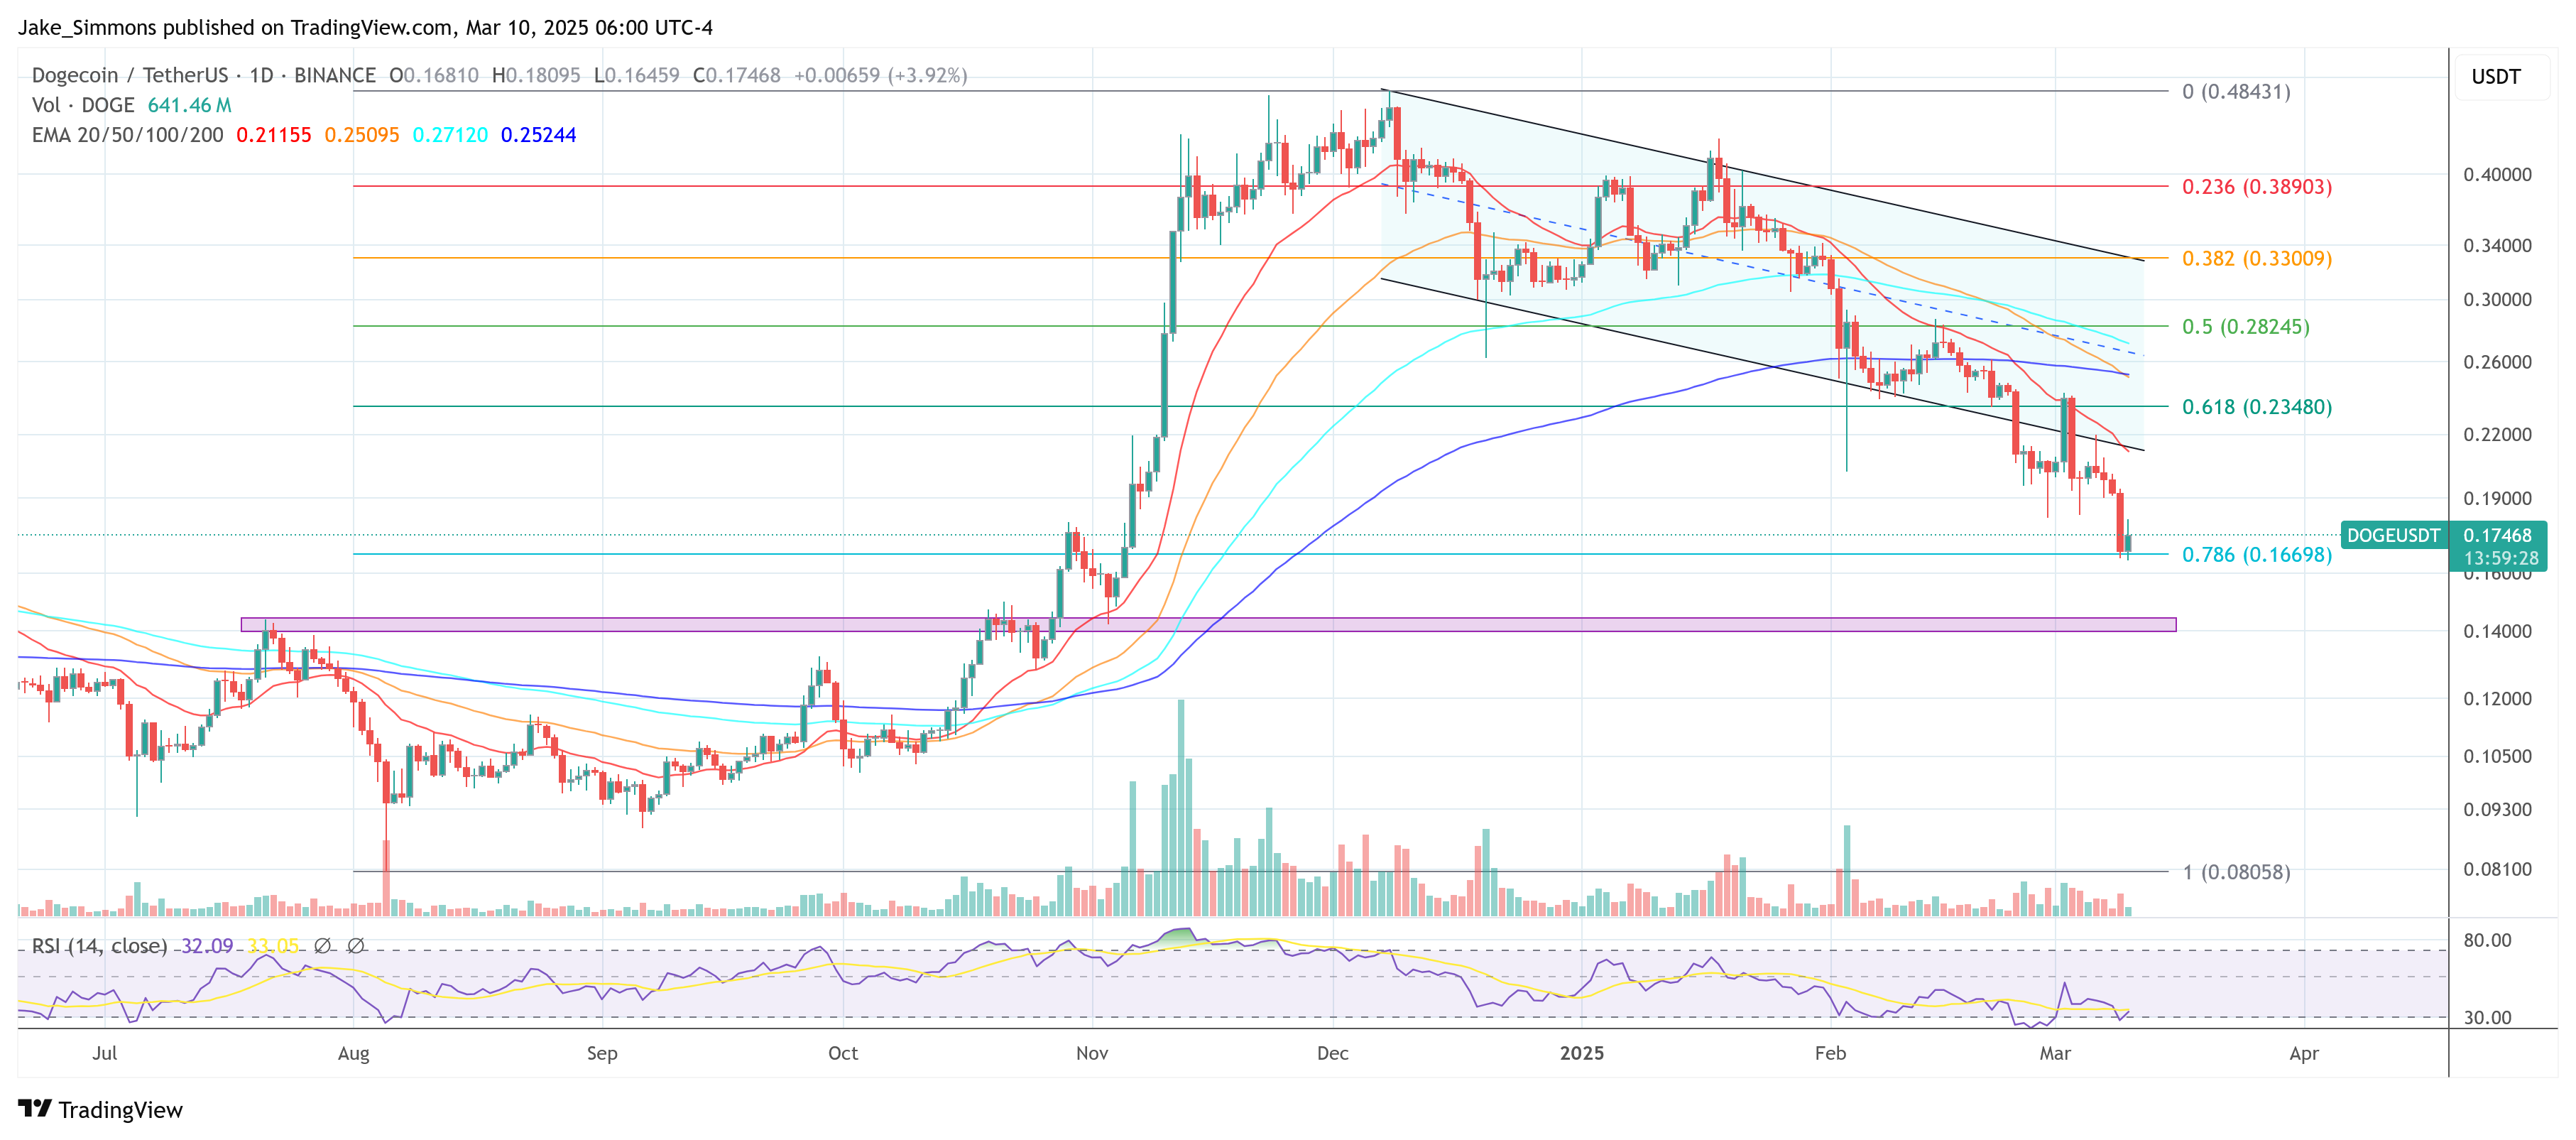
Dogecoin is at a critical point, with its price hovering around $0.16. Traders are watching closely, as this support level could be the deciding factor in whether the meme coin takes off or tumbles further. If history is any guide, maintaining this level could spark a rally, while losing it may bring more pain.
Related Reading
Dogecoin: Key Level To Watch
The $0.16 support level is not just a random number—it has been a crucial zone for Dogecoin. If it stays above this mark, there’s a strong chance of a rebound. Past price movements suggest that Dogecoin tends to climb after testing key supports.
Some analysts believe that holding this level could lead to a breakout toward the $0.20–$0.30 range in the near term.
Crypto analyst Ali Martinez has weighed in, stating that Dogecoin’s price is following an ascending parallel channel. He believes that if the $0.16 support holds, the meme coin could surge toward $2.74 or even as high as $6.24 in a strong bullish scenario.
However, a breakdown below this level could invalidate this outlook and send the price lower.
#Dogecoin $DOGE is nearing a crucial support level at the lower boundary of this channel. Holding above $0.16 could fuel a strong rebound! pic.twitter.com/foCUdbnTFZ
— Ali (@ali_charts) March 9, 2025
Traders Adjust Price Targets
The market mood is shifting. Some traders are setting their profit targets between $0.70 and $0.80, looking for another big move. Even with recent setbacks, many people still believe that Dogecoin will reach $1.
Even if this seems far-fetched, anyone who recalls Dogecoin’s meteoric climb in 2021 knows that when momentum builds, it may surprise.

Short-term traders, meanwhile, are exercising caution and holding off on making significant trades until they receive clear signs.
The course of the next few days may determine if Dogecoin continues to trend upward or remains in its present range.
History Hints At A Possible Rally
Dogecoin’s past performance shows a pattern of major price swings after testing strong support zones. After going up from key marks in 2017 and 2021, the coin made a lot of money.
If things keep going the way they are, some experts think Dogecoin could go over $1.75 in its next bull run.
Still, it’s never easy to tell how crypto will move. External factors, such as how the market feels, Bitcoin’s price movement, and broader economic trends, will also affect the meme coin’s price route.
Related Reading
Current Price Action
Currently selling at around $0.174, Dogecoin has dropped about 7% over the previous day. The low dropped to $0.16; the intraday high hit $0.1878. The meme crypto’s market capitalization now is almost $26.23 billion. Technical indicators suggest a possible rebound, but that depends on whether buyers step in at this critical level.
Featured image from Gemini Imagen, chart from TradingView
Source link
Reason to trust
![]()
Strict editorial policy that focuses on accuracy, relevance, and impartiality
Created by industry experts and meticulously reviewed
The highest standards in reporting and publishing
Strict editorial policy that focuses on accuracy, relevance, and impartiality
Morbi pretium leo et nisl aliquam mollis. Quisque arcu lorem, ultricies quis pellentesque nec, ullamcorper eu odio.
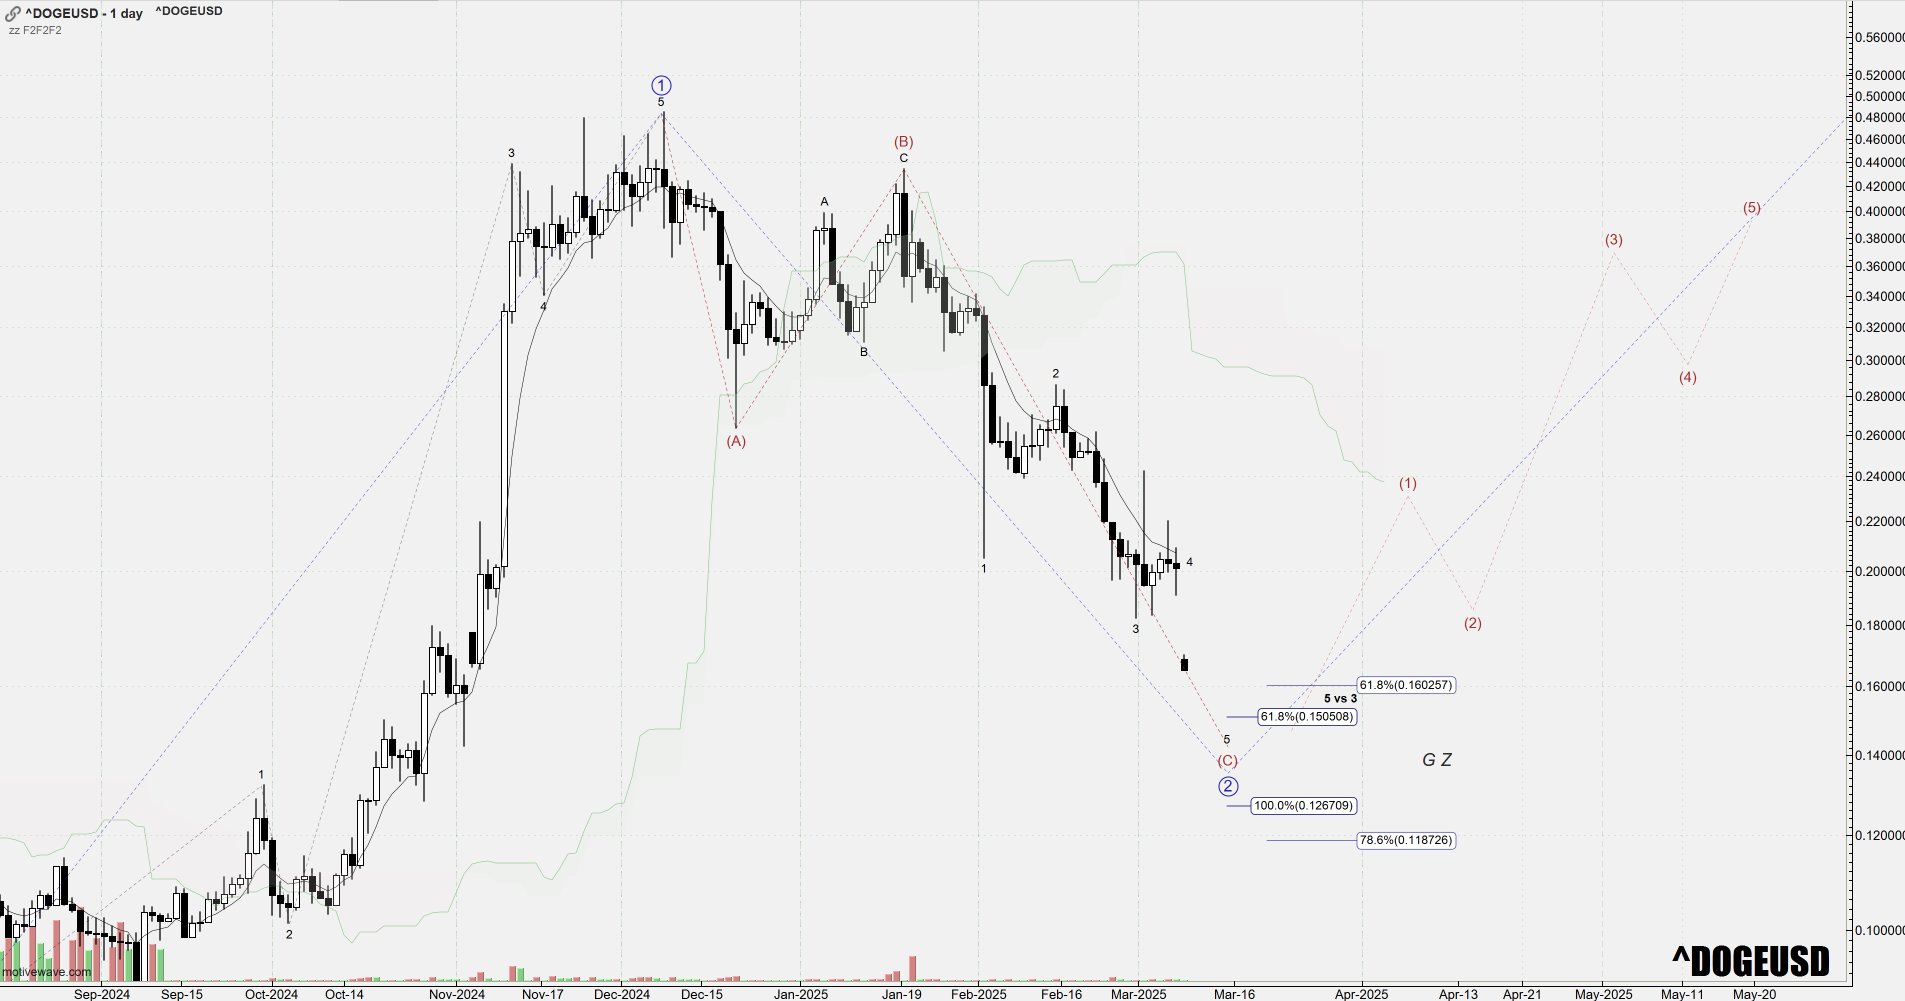
A recently published Dogecoin (DOGE) chart by analyst Paul (@Zig_ZagTrades) suggests that the popular meme-based cryptocurrency could slide as low as $0.12 in a final corrective phase before attempting a significant rebound. The 1-day chart, shared on X, outlines a textbook Elliott Wave structure that Paul interprets as a larger (A)–(B)–(C) correction, culminating in a potential Wave 2 near the $0.12–$0.15 region.
More Downside For Dogecoin Ahead?
In Paul’s analysis, Dogecoin has been tracing a five-subwave decline since reaching a prominent peak labeled as Wave 1 on his chart. This top coincided with a multi-day surge that lost momentum and reversed lower, leading to a series of smaller waves marked as 1, 2, 3, 4, and now 5. The analyst indicates that this fifth and final subwave is likely concluding a broader C wave (or 2nd wave if counting at a higher degree). Paul’s notations highlight a “GZ” (a “Golden Zone” commonly used by traders to pinpoint Fibonacci support clusters), and his markings pinpoint Fibonacci ratios that could define DOGE’s near-term floor.
Related Reading
The chart shows a cluster of key retracement levels spanning from $0.16 down to the mid-$0.11 range. Paul highlights Fibonacci levels at 61.8% around $0.160257 and $0.150508, alongside deeper retracements at 78.6% near $0.118726 and a 100% projection around $0.126709. These numeric zones appear to bracket the “GZ” in which Paul believes DOGE may complete its final subwave. According to the chart, the $0.12–$0.15 pocket stands out as the most critical price territory for bulls seeking to halt the ongoing downtrend.
The path from the current price region toward this lower objective is labeled with a subwave count that suggests a final push beneath prior lows. Candlestick patterns on the chart confirm a sequence of lower highs and lower lows in recent weeks, a sign that the bearish momentum remains intact. Volume bars at the bottom indicate steady selling pressure accompanying downward impulses, in line with the view that DOGE could still be carving out its terminal leg of the correction.
Related Reading
Paul’s use of Ichimoku Cloud settings shows that the price has consistently traded below the cloud since late January, indicating that DOGE has yet to reestablish any bullish momentum. The shaded green cloud area on his chart appears to have acted as dynamic resistance, backing up the notion that the market has remained in a corrective posture for several weeks. The analyst’s labeling of the waves beyond the purported bottom, marked as (1) to (5), suggests an expectation of an eventual upward cycle if and when the coin finds support in the “GZ” zone.
While the chart projects a subsequent rally from the anticipated low, no guarantees exist that DOGE will definitely hold the $0.12–$0.15 band. Failure to do so would theoretically extend the corrective pattern and undermine the bullish wave count, but Paul’s annotation implies that he sees the current downswing as a last flush of sellers. In his own words, “DOGE 1D: A Subwave 5 drop setting up a wave C/2 finish in the GZ for DOGE,” suggests an expectation of a local bottom in this area, although the market’s overall direction will hinge on whether enough buyers step in at those Fibonacci levels.
At press time, DOGE traded at $0.17
Featured image created with DALL.E, chart from TradingView.com
Source link

This Week in Bitcoin: Strategy Stalls, But White House Plans to Buy More BTC

Layer3 (L3) Price Prediction March 2025, 2026, 2030, 2040

Ripple Token Zooms 5% Higher as Bitcoin Grapples With $84K Level

Bitcoin’s megaphone pattern, explained: How to trade it
Is Bitcoin Price Headed For $70,000 Or $300,000? What The Charts Are Saying

This Rare Bitcoin Buy Signal Could Ignite Next BTC Rally

There’s a Good Chance the Bull Cycle’s Over if Bitcoin Plunges to This Level, Warns Analyst Benjamin Cowen

Ethena overtakes PancakeSwap and Jupiter with $3.28m daily revenue

Gold ETFs Winning the Asset Race With Bitcoin Funds–for Now

BTC Regains $84K; ETH, XRP, SOL Pump

Court Approves 3AC’s $1.53B Claim Against FTX, Setting Up Major Creditor Battle

Sacks and his VC firm sold over $200M in crypto and stocks before WH role
Polkadot (DOT) Price Stability Fuels Hopes For Short-Term Recovery

Bitcoin Is A Strategic Asset, Not XRP

Bank of America Insider Helps Criminals and Illicit Businesses Launder Funds in Massive Global Conspiracy: US Department of Justice


 24/7 Cryptocurrency News4 months ago
Arthur Hayes, Murad’s Prediction For Meme Coins, AI & DeFi Coins For 2025

 Bitcoin2 months ago
Expert Sees Bitcoin Dipping To $50K While Bullish Signs Persist

 24/7 Cryptocurrency News2 months ago
Aptos Leverages Chainlink To Enhance Scalability and Data Access

 Bitcoin4 months ago
Bitcoin Could Rally to $80,000 on the Eve of US Elections

 Bitcoin4 months ago
Institutional Investors Go All In on Crypto as 57% Plan to Boost Allocations as Bull Run Heats Up, Sygnum Survey Reveals

 Altcoins1 month ago
Sonic Now ‘Golden Standard’ of Layer-2s After Scaling Transactions to 16,000+ per Second, Says Andre Cronje

 Opinion4 months ago
Crypto’s Big Trump Gamble Is Risky

 Price analysis4 months ago
Ripple-SEC Case Ends, But These 3 Rivals Could Jump 500x
