
bear market
Don't Buy The Bitcoin Dip


With bitcoin’s price dipping significantly below $100k again, the “buy the dip” cheerleaders are out in full force.
But I’m here to offer a different perspective: Don’t buy the dip.
Before I continue, let me please make it clear that nothing that I write in this Take is investment advice.
Why would I say such a thing? Is it that I hate bitcoin all of a sudden?
No.
I have other reasons for making such a statement.
The first is that I’m trying to keep you from becoming exit liquidity for people like this:
Don’t worry guys.
The retards are coming. pic.twitter.com/1YL8keRHYa
— Breadman (@BTCBreadMan) January 8, 2025
The second is that I like to buy bitcoin when it’s truly selling at a discount, not just when it appears to be selling at one.
Let me explain.
Right now, bitcoin is trading about 13% off of its all-time highs. While that may be a significant discount for an asset in the world of traditional finance, it’s hardly more than a daily fluctuation in the world of bitcoin.
In the four-year bitcoin cycles, bitcoin’s price tends to skyrocket during the years of and after its halving. And then the year that follows tends to be pretty terrible for bitcoin’s price. During that year, bitcoin’s price hits a low, which tends to be in the range of the prior cycle’s high.
That was a bit confusing, so let me give you an example.
In 2022, the last “pretty terrible” year, bitcoin’s price dropped to about $15,500, which was actually about $3,500 lower than bitcoin’s top from the previous cycle — $20,000.
If something comparable were to happen in 2026, we’d see bitcoin’s price at approximately $53k (23% below the previous cycle’s all-time high of $69k). Now, that would be a significant discount and a dip worth buying.
I don’t share this perspective to dissuade you from continuing with something like a dollar-cost averaging bitcoin investment strategy (one of the best strategies out there for the average retail investor). Instead, I share it because if a loved one came to me and asked me if now was a good time to buy bitcoin, I’d say “not really.”
I try to maximize the financial upside (in fiat terms) of investing in bitcoin as much as possible for those who ask me about investing in it — especially those who are new to it. And while I could maybe help someone trade in and out of a bitcoin position in the next year or so, I don’t like to do this, as I encourage people to buy and hold bitcoin for the long haul.
But, Frank, the U.S. might announce a Strategic Bitcoin Reserve and other nations may follow suit! And look at all the companies buying bitcoin for their treasuries!
Yes, these things are happening, and so are things like Bhutan selling bitcoin and so have things like Germany selling bitcoin and Tesla selling bitcoin.
Up until now, all bitcoin price cycles have been similar. So, while it looks like we have another year of bitcoin price upside in store for us, I think we drop far lower than this current price level when the tables turn.
And that’s when I’ll be proactively buying.
This article is a Take. Opinions expressed are entirely the author’s and do not necessarily reflect those of BTC Inc or Bitcoin Magazine.
Source link


Bitcoin just dropped 24% from its all-time high — what happens next? Analysts say BTC is “very close to its local bottom,” but could a Black Swan event send it crashing even lower?
Macro turmoil shakes Bitcoin
Bitcoin’s (BTC) price has been on a bumpy stretch. After hitting an all-time high of $109,114 in January when President Donald Trump took office and established a more pro-crypto administration, the market has taken a sharp turn.
As of Mar. 13, Bitcoin is sitting around $82,600, down 24% from its January peak, after plunging to a four-month low of $76,600 on Mar. 11.

The market is facing headwinds from multiple directions. Wall Street is leaning into risk aversion, U.S. recession fears are growing, and Trump’s new tariff policies have added uncertainty to the mix.
Many investors were also disappointed by the lack of fresh BTC purchases under the Trump administration’s strategic reserve plan, which some had hoped would provide a steady buying force for Bitcoin.
On the macroeconomic side, inflation data released on Mar. 12 offered a brief moment of optimism. The consumer price index rose by just 0.2% in February, slowing to an annual inflation rate of 2.8% — down from 0.5% in January. The core CPI, which strips out food and energy prices, also landed at 3.1%, its lowest level since April 2021.
The market initially reacted positively to the softer CPI data. Bitcoin pushed above $84,000, and altcoins saw double-digit gains. The S&P 500 and Nasdaq 100 also recorded slight upticks.
But the optimism didn’t last. As the day progressed, BTC and equities erased most of their gains, weighed down by Trump’s tariff war escalating against major trading partners.
In a dramatic move, Trump slapped a 25% tariff on steel and aluminium imports from Canada, prompting Canada to retaliate with 25% tariffs on $21 billion worth of U.S. goods.
Just hours later, the EU fired back with its own $28 billion in retaliatory tariffs on U.S. products, further intensifying trade tensions.
These actions have put investors on edge, shifting market sentiment toward a risk-off approach, where cash and safer assets like gold and bonds become more attractive than volatile plays like Bitcoin.
With all these forces at play, Bitcoin finds itself at a crossroads. Will it stabilize and gear up for another run, or are further corrections on the horizon? Let’s dig deeper.
Institutional money retreats
Since Feb. 13, spot Bitcoin ETFs have been under pressure, with money flowing out at an aggressive pace. While there were a few days of net positive inflows, they were small in volume compared to the heavy outflows on most days.
The worst hit came on Feb. 25, when ETFs saw their largest single-day outflow ever — over $1 billion, marking a clear risk-off sentiment among institutional investors.
Despite the outflows, as of Mar. 12, BlackRock’s IBIT remains the dominant ETF in the market, holding nearly 568,000 BTC. Fidelity’s FBTC and Grayscale’s GBTC follow, managing 197,500 BTC and 196,000 BTC, respectively.
Adding a political layer to the Bitcoin narrative, at least six members of President Trump’s cabinet hold Bitcoin, either directly or indirectly through ETFs.
Among them, Health and Human Services Secretary Robert F. Kennedy Jr. has the largest disclosed stake, with a Bitcoin Fidelity crypto account valued between $1 million and $5 million.
Treasury Secretary Scott Bessent holds between $250,001 and $500,000 worth of BlackRock’s iShares Bitcoin Trust ETF. While Bessent has pledged to divest his holdings within 90 days, his position highlights the growing connection between Bitcoin and top-level U.S. policymakers.
Meanwhile, Bitcoin’s open interest, a crucial metric showing the total value of outstanding BTC derivative contracts, has been in a downward spiral.
After peaking at $70 billion on Jan. 22, following Bitcoin’s new all-time high, open interest has been on a steady decline. As BTC tumbled, OI followed, dropping to a low of $45.7 billion on Mar. 11, the same day BTC hit its four-month low.
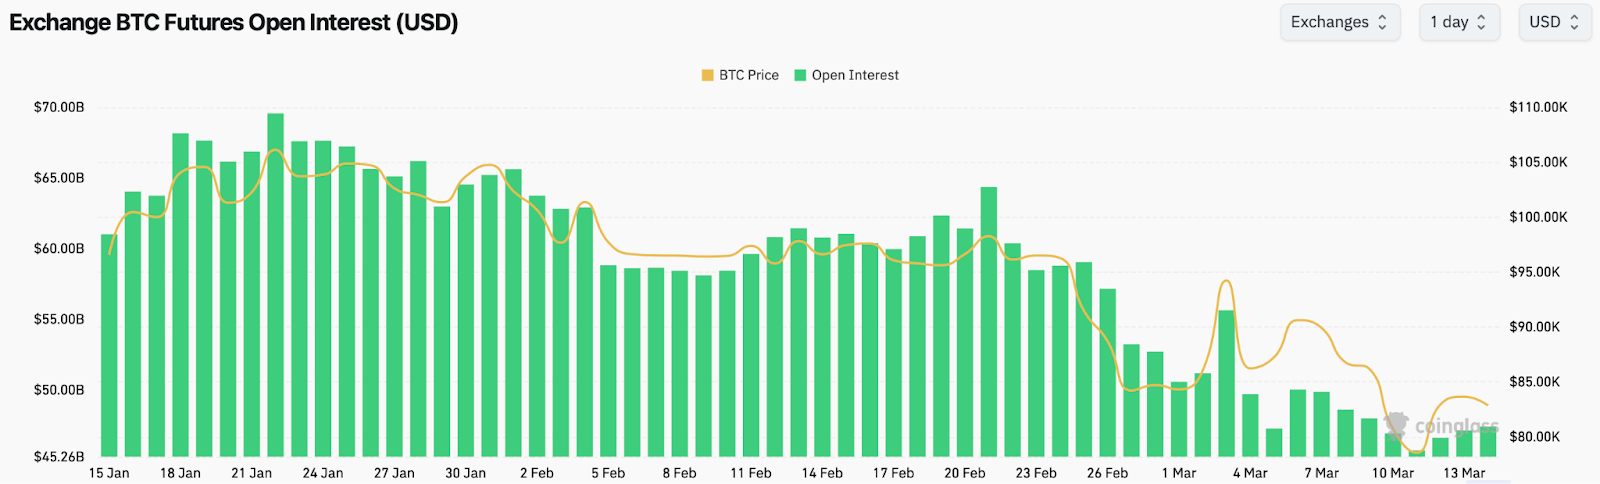
However, in the last two days, open interest has started climbing back, adding over $1 billion as of Mar. 13, in sync with BTC’s price recovery.
The heavy ETF outflows and dropping open interest paint a picture of institutional hesitation and reduced speculative activity over the past few weeks.
Bitcoin’s rally in January was fueled by strong ETF inflows and high-leveraged positions, but as soon as macro uncertainty and Trump’s trade war escalated, the market turned defensive.
The latest open interest rebound is a potential signal that traders are cautiously re-entering long positions, but the recovery is slow. A sustained increase in both OI and ETF inflows will be critical for Bitcoin to regain momentum.
History hints at a rebound
Bitcoin’s recent pullback from its all-time high has been sharp, but historical trends and technical indicators suggest that this could either be a temporary bottom or the beginning of a deeper correction.
Technical analyst CryptoCon points out that Bitcoin has now reached historically low RSI Bollinger Band % levels, a point where BTC rarely stays for long.
To break this down — Relative Strength Index measures momentum, while Bollinger Bands show volatility. When the RSI Bollinger % reaches extreme lows, it suggests that Bitcoin is at an oversold level, meaning the downside pressure is likely exhausting itself.
In previous cycles, when BTC hit similar RSI Bollinger % lows, it marked a strong local bottom before the next leg up.
According to CryptoCon, Bitcoin has just completed Phase 4, a part of the market cycle where price breaks past the previous all-time high—something we saw in January 2013, December 2016, and November 2020.
In all three of these cycles, BTC had a correction after the breakout before rallying to a new high within the next 9 to 12 months.
He believes that this market cycle is behaving exactly like March 2017, when BTC faced a deep correction but then recovered to rally further. If that’s the case, this means we are still months away from a cycle top.
However, this optimistic outlook is far from universally accepted. Doctor Profit, another respected analyst, lays out two possible scenarios for BTC’s next move.
https://twitter.com/DrProfitCrypto/status/1900007014165856644
In a normal market environment, BTC’s local bottom should form between $68,000 and $74,000, as confirmed by the Market Value to Realized Value indicator.
The MVRV indicator measures whether Bitcoin is overvalued or undervalued by comparing the current market price to the average purchase price of all BTC in circulation.
Right now, the MVRV suggests that BTC is approaching a strong bottom zone, meaning downside risk is limited unless something drastic happens.
That’s where the Black Swan risk comes in. While Doctor Profit initially believed a Black Swan event was highly unlikely, recent economic shifts — such as Trump’s aggressive tariff moves, global trade war concerns, and broader recession fears — make him less certain.
A severe global economic downturn, a financial crisis, or a major crypto industry collapse could push Bitcoin much lower, possibly toward $50,000. While he still leans toward the first scenario, he no longer rules out a full-blown market wipeout.
The signs are mixed. Bitcoin’s historical cycles suggest this is a healthy pullback before another rally, but global conditions have rarely been this unstable.
For now, investors should stay cautious, watch key support levels, and be prepared for heightened volatility.
While historical data favors a recovery, markets don’t move in a vacuum, and external shocks can override even the strongest technical indicators. Never invest more than you can afford to lose.
Disclosure: This article does not represent investment advice. The content and materials featured on this page are for educational purposes only.
Source link

The CoinMarketCap Altcoin Season Index now sits below 40, signaling that altcoins continue to underperform relative to Bitcoin. What’s next?
The CMC Altcoin Season Index is a tool that helps determine whether the market is in altcoin season or Bitcoin (BTC) season by tracking the performance of the top 100 cryptocurrencies over the past 90 days. When 75% or more of these altcoins outperform Bitcoin, the market is considered to be in altcoin season.
In December 2024, the index hit 64, signaling the start of altcoin season. However, since the beginning of January, the index has remained just above 40 and is now showing signs of further decline. As of Feb. 17, the index stands at 36, indicating that Bitcoin is currently leading the market.

Despite the continuous market volatility, Bitcoin has demonstrated remarkable strength, staying above $96,000. The direction of the larger market may be determined by Bitcoin’s next action. Despite the overall optimistic tone, Maartunn, an analyst with CryptoQuant, seems to disagree.
Maartunn points out that the Inter-exchange Flow Pulse (IFP) indicator is signaling a bearish trend. This metric tracks Bitcoin’s movement between derivatives and spot markets. Typically, rising flows into derivatives indicate a bullish market. However, the current negative signal suggests that Bitcoin could face further resistance before a breakout.
Inter-exchange Flow Pulse (IFP) turned bearish
️
The indicator measures bitcoin flows between spot and derivative exchanges using CryptoQuant’s Bitcoin exchange flows data.
This flow data shows market sentiment. A growing (declining) amount of Bitcoin flowing to (from)… pic.twitter.com/zokdfeE8xc
— Maartunn (@JA_Maartun) February 15, 2025
On the other hand, altcoins have had difficulty, perhaps as a result of the increasing number of fresh launches. Liquidity tends to be spread thin when there are too many new products entering the market.
Bobby Ong, co-founder of CoinGecko, released data showing that over 600,000 tokens were created in January alone. Seemingly, investors are actively shifting their money between many different tokens, which is causing altcoin performance to suffer.
2/ Back in 2022-2023, around 50k new tokens were minted every month.
Fast forward to Q4 2024, and we’re seeing 400k new tokens/month – with January 2025 hitting a record 600k new tokens created per month!
That’s 12x growth in just over a year. pic.twitter.com/KZkG4hmEJd
— Bobby Ong (@bobbyong) February 14, 2025

Hyperliquid (HYPE) and Ripple (XRP) are among the best-performing altcoins in the past 90 days, rising 735% and 143% respectively. On the flip side, many AI tokens have taken a major hit despite AI attracting the largest mindshare from crypto communities. RENDER (RNDR), Artificial Superintelligence Alliance (FET), and Near Protocol (NEAR) are all down more than 40% in the past 90 days.
Historically, altcoin season typically follows Bitcoin’s consolidation or decline. The next big rise for altcoins will be determined in large part by macroeconomic factors, regulatory developments, and general market conditions.
Source link
bear market
Ethereum faces unprecedented short positioning as short interest spikes 500% since November 2024

Short interest in Ethereum has skyrocketed by 500% since Nov. 2024, raising questions about whether a looming short squeeze could close the widening performance gap with Bitcoin, despite regulatory support.
In the past week, short interest in Ethereum has surged by an eye-watering 40%, bringing the total increase to a staggering 500% since November 2024, according to The Kobeissi Letter, an industry leading commentary on the global capital markets.
For years, Ethereum has been under scrutiny, particularly around the fear that it could be classified as a security by the SEC. However, with the new regulatory environment under the Trump administration, experts believe that this is now unlikely. In fact, Eric Trump recently posted on X that “it’s a great time to add ETH,” causing a brief surge in Ethereum’s price. Despite this shift in regulatory tone, Ethereum (ETH) is now facing the highest short positioning it has ever seen.
The analysts at The Kobeissi Letter point to a particularly volatile period around Feb. 2, when Ethereum dropped by 37% in just 60 hours on the trade war headlines. They also highlight strong inflows into ETH during Dec. 2024, despite reports that hedge funds were increasing their short positions. In just three weeks, ETH saw over $2 billion in new funds, including a record-breaking weekly inflow of $854 million.
Additionally, they noted significant spikes in Ethereum trading volume, particularly on Jan. 21 (Inauguration Day) and during the Feb. 3 crash. Despite the high inflows, Ethereum’s price has struggled to recover, remaining about 45% below its ATH set in Nov. 2021, even after a week has passed.
What do hedge funds know is coming?
With all of this taken into consideration, The Kobeissi Letter analysts wonder, “What do hedge funds know is coming?” They speculate on possible explanations, ranging from market manipulation and routine crypto hedging strategies to a simple-and-plain bearish outlook on Ethereum’s future. “However, this is rather strange as the Trump Administration and new regulators have favored ETH,” they wrote in the X post.
To wrap it up, The Kobeissi Letter analysts suggest that the extreme positioning in Ethereum’s market is likely to lead to more significant price swings, similar to the one seen on Feb. 3. Furthermore, they question whether a short squeeze could help close the performance gap between Bitcoin and Ethereum. To put it into perspective, since the beginning of 2024, Bitcoin has outperformed Ethereum by about 12 times. Moreover, Ethereum’s market cap has shrunk in comparison to Bitcoin, which is now six times larger than ETH. This is the largest disparity between the two assets since 2020.

Source link

Ripple Token Zooms 5% Higher as Bitcoin Grapples With $84K Level

Bitcoin’s megaphone pattern, explained: How to trade it
Is Bitcoin Price Headed For $70,000 Or $300,000? What The Charts Are Saying

This Rare Bitcoin Buy Signal Could Ignite Next BTC Rally

There’s a Good Chance the Bull Cycle’s Over if Bitcoin Plunges to This Level, Warns Analyst Benjamin Cowen

Ethena overtakes PancakeSwap and Jupiter with $3.28m daily revenue

Gold ETFs Winning the Asset Race With Bitcoin Funds–for Now

BTC Regains $84K; ETH, XRP, SOL Pump

Court Approves 3AC’s $1.53B Claim Against FTX, Setting Up Major Creditor Battle

Sacks and his VC firm sold over $200M in crypto and stocks before WH role
Polkadot (DOT) Price Stability Fuels Hopes For Short-Term Recovery

Bitcoin Is A Strategic Asset, Not XRP

Bank of America Insider Helps Criminals and Illicit Businesses Launder Funds in Massive Global Conspiracy: US Department of Justice

U.S. government holds $16B in Bitcoin, eyes 1m BTC under new bill

Wales Man Loses Appeal to Dig Out Hard Drive Holding $676 Million in Bitcoin


 24/7 Cryptocurrency News4 months ago
Arthur Hayes, Murad’s Prediction For Meme Coins, AI & DeFi Coins For 2025

 Bitcoin2 months ago
Expert Sees Bitcoin Dipping To $50K While Bullish Signs Persist

 24/7 Cryptocurrency News2 months ago
Aptos Leverages Chainlink To Enhance Scalability and Data Access

 Bitcoin4 months ago
Bitcoin Could Rally to $80,000 on the Eve of US Elections

 Bitcoin4 months ago
Institutional Investors Go All In on Crypto as 57% Plan to Boost Allocations as Bull Run Heats Up, Sygnum Survey Reveals

 Altcoins1 month ago
Sonic Now ‘Golden Standard’ of Layer-2s After Scaling Transactions to 16,000+ per Second, Says Andre Cronje

 Opinion4 months ago
Crypto’s Big Trump Gamble Is Risky

 Price analysis4 months ago
Ripple-SEC Case Ends, But These 3 Rivals Could Jump 500x
