
Bitcoin price
Economist Explains What Could Fuel 2025 Bitcoin Price Rally

Alex Krüger, an economist and popular crypto analyst, explained how the US Federal Reserve’s stance in 2025 could serve as a tailwind for the ongoing Bitcoin rally. This comment from Krüger comes as BTC is up 4.34% from its January 1 swing low of $92,840. Bitcoin price today and trades at $3,456.1.

*bitcoin price updated as of 3 PM.
Economist Explains Key 2025 Tailwind For Bitcoin price Rally
As noted above, Alex Krüger, explained that the “timing of the Fed going back dovish” in 2025 could fuel Bitcoin price rally. A dovish Fed comment would mean that the interest rates could be slashed, triggering more borrowing and spending, aka a risk-on scenario. Such an outlook would mean that risky assets like Bitcoin, cryptocurrencies and stocks could shoot higher.
Krüger adds that Fed’s dovish comment in 2025 could disrupt crypto’s habit of forming a top around the end of first quarter. He supports this statement by adding that Bitcoin and cryptocurrency market would follow suit if “equities ramp up hard in March or April.”
He concludes his bullish X post by noting that the macro outlook “trumps” seasonality and Bitcoin’s popular four-year cycles.
Bitcoin Technical Analysis: Has BTC Price Rally Begun?
CME’s one-hour Bitcoin price chart shows a gap, extending from $94,495 to $94,970, created between December 31, 2024, and January 1, 2025. Typically, price fills these gaps via a retracement or pullback in an act of rebalancing. Hence, despite the recent run-up in the past 48 hours, Bitcoin could retrace lower to fill the aforementioned gap seen on the CME BTC price chart.
Moreover, the start and end of the day, week, quarter and year tend to witness added volatility, which is not just limited to cryptocurrencies but also the stock market. Hence, there is a high chance that Bitcoin retraces into the CME gap, stretching from $94,500 to $94,970.
This short-term retracement is unlikely to end the Bitcoin price recovery rally, which began at the start of a new year. Hence, investors can remain confident as the long-term bullish outlook and the recovery bounce remains intact.

However, if Bitcoin price fails to hold above the $93,000 support level, it could jeopardize the uptrend. If a daily candlestick closes below the said level, it would invalidate the bullish thesis and trigger a further correction. Bitcoin price prediction, in this instance, indicates a near-3% crash to $90,000.
Bitcoin Price Targets If BTC Dips Below $90,000
Over the past six months or so, the Bitcoin price has crashed at the start of every month. This correction sweeps the lows created at the end of the previous month. This drop is a great buying opportunity because every single sweep after the start of the new month has led to at least a 24% rally in the next three weeks or less. The highest rally BTC witnessed after such a deviation was in November, where the biggest crypto by market cap rose nearly 50%.
If history rhymes, then a drop below $90,000 is likely. Following this dip, if BTC rallies 24% from $90,000, investors can expect an all-time high of roughly $113,000. However, a 50% gain would put Bitcoin price at $135,000.

Bitcoin looks increasingly promising from a technical perspective. Economist Alex Krüger’s insights suggest that the US Federal Reserve’s stance could serve as a tailwind for the ongoing Bitcoin rally. The potential for a dovish Fed comment to disrupt crypto’s seasonal trends and fuel a risk-on scenario is a significant bullish indicator. Krüger notes that the macro outlook “trumps” seasonality and Bitcoin’s popular four-year cycles, making a strong case for a continued rally. From a technical analysis standpoint, Bitcoin price could hit $113K or $135K if history rhymes.
Source link


Reason to trust
![]()
Strict editorial policy that focuses on accuracy, relevance, and impartiality
Created by industry experts and meticulously reviewed
The highest standards in reporting and publishing
Strict editorial policy that focuses on accuracy, relevance, and impartiality
Morbi pretium leo et nisl aliquam mollis. Quisque arcu lorem, ultricies quis pellentesque nec, ullamcorper eu odio.
In a new publication titled The Mustard Seed, Joe Burnett—Director of Market Research at Unchained—outlines a thesis that envisions Bitcoin reaching $10 million per coin by 2035. This inaugural quarterly letter takes the long view, focusing on “time arbitrage” as it surveys where Bitcoin, technology, and human civilization could stand a decade from now.
Burnett’s argument revolves around two principal transformations that, he contends, are setting the stage for an unprecedented migration of global capital into Bitcoin: (1) the “Great Flow of Capital” into an asset with absolute scarcity, and (2) the “Acceleration of Deflationary Technology” as AI and robotics reshape entire industries.
A Long-Term Perspective On Bitcoin
Most economic commentary zooms in on the next earnings report or the immediate price volatility. In contrast, The Mustard Seed announces its mission clearly: “Unlike most financial commentary that fixates on the next quarter or next year, this letter takes the long view—identifying profound shifts before they become consensus.”
At the core of Burnett’s outlook is the observation that the global financial system—comprising roughly $900 trillion in total assets—faces ongoing risks of “dilution or devaluation.” Bonds, currencies, equities, gold, and real estate each have expansionary or inflationary components that erode their store-of-value function:
- Gold ($20 trillion): Mined at approximately 2% annually, increasing supply and slowly diluting its scarcity.
- Real Estate ($300 trillion): Expands at around 2.4% per year due to new development.
- Equities ($110 trillion): Company profits are constantly eroded by competition and market saturation, contributing to devaluation risk.
- Fixed Income & Fiat ($230 trillion): Structurally subject to inflation, which reduces purchasing power over time.
Burnett describes this phenomenon as capital “searching for a lower potential energy state,” likening the process to water cascading down a waterfall. In his view, all pre-Bitcoin asset classes were effectively “open bounties” for dilution or devaluation. Wealth managers could distribute capital among real estate, bonds, gold, or stocks, but each category carried a mechanism by which its real value could erode.
Related Reading
Enter Bitcoin, with its 21-million-coin hard cap. Burnett sees this digital asset as the first monetary instrument incapable of being diluted or devalued from within. Supply is fixed; demand, if it grows, can directly translate into price appreciation. He cites Michael Saylor’s “waterfall analogy”: “Capital naturally seeks the lowest potential energy state—just as water flows downhill. Before bitcoin, wealth had no true escape from dilution or devaluation. Wealth stored in every asset class acted as a market bounty, incentivizing dilution or devaluation.”
As soon as Bitcoin became widely recognized, says Burnett, the game changed for capital allocation. Much like discovering an untapped reservoir far below existing water basins, the global wealth supply found a new outlet—one that cannot be augmented or diluted.
To illustrate Bitcoin’s unique supply dynamics, The Mustard Seed draws a parallel with the halving cycle. In 2009, miners received 50 BTC per block—akin to Niagara Falls at full force. As of today, the reward dropped to 3.125 BTC, reminiscent of halving the Falls’ flow repeatedly until it is significantly reduced. In 2065, Bitcoin’s newly minted supply will be negligible compared to its total volume, mirroring a waterfall reduced to a trickle.
Though Burnett concedes that attempts to quantify Bitcoin’s global adoption rely on uncertain assumptions, he references two models: the Power Law Model which projects $1.8 million per BTC by 2035 and Michael Saylor’s Bitcoin model which suggests $2.1 million per BTC by 2035.
He counters that these projections might be “too conservative” because they often assume diminishing returns. In a world of accelerating technological adoption—and a growing realization of Bitcoin’s properties—price targets could overshoot these models significantly.
The Acceleration Of Deflationary Technology
A second major catalyst for Bitcoin’s upside potential, per The Mustard Seed, is the deflationary wave brought on by AI, automation, and robotics. These innovations rapidly increase productivity, lower costs, and make goods and services more abundant. By 2035, Burnett believes global costs in several key sectors could undergo dramatic reductions.
Adidas’ “Speedfactories” cut sneaker production from months to days. The scaling of 3D printing and AI-driven assembly lines could slash manufacturing costs by 10x. 3D-printed homes already go up 50x faster at far lower costs. Advanced supply-chain automation, combined with AI logistics, could make quality housing 10x cheaper. Autonomous ride-hailing can potentially reduce fares by 90% by removing labor costs and improving efficiency.
Burnett underscores that, under a fiat system, natural deflation is often “artificially suppressed.” Monetary policies—like persistent inflation and stimulus—inflate prices, masking technology’s real impact on lowering costs.
Bitcoin, on the other hand, would let deflation “run its course,” increasing purchasing power for holders as goods become more affordable. In his words: “A person holding 0.1 BTC today (~$10,000) could see its purchasing power increase 100x or more by 2035 as goods and services become exponentially cheaper.”
To illustrate how supply growth erodes a store of value over time, Burnett revisits gold’s performance since 1970. Gold’s nominal price from $36 per ounce to roughly $2,900 per ounce in 2025 appears substantial, but that price gain was continuously diluted by the annual 2% increase in gold’s overall supply. Over five decades, the global stock of gold almost tripled.
If gold’s supply had been static, its price would have hit $8,618 per ounce by 2025, according to Burnett’s calculations. This supply constraint would have bolstered gold’s scarcity, possibly pushing demand and price even higher than $8,618.
Related Reading
Bitcoin, by contrast, incorporates precisely the fixed supply condition that gold never had. Any new demand will not spur additional coin issuance and thus should drive the price upward more directly.
Burnett’s forecast for a $10 million Bitcoin by 2035 would imply a total market cap of $200 trillion. While that figure sounds colossal, he points out that it represents only about 11% of global wealth—assuming global wealth continues to expand at a ~7% annual rate. From this vantage point, allocating around 11% of the world’s assets into what The Mustard Seed calls “the best long-term store of value asset” might not be far-fetched. “Every past store of value has perpetually expanded in supply to meet demand. Bitcoin is the first that cannot.”
A key piece of the puzzle is the security budget for Bitcoin: miner revenue. By 2035, Bitcoin’s block subsidy will be down to 0.78125 BTC per block. At $10 million per coin, miners could earn $411 billion in aggregate revenue each year. Since miners sell the Bitcoin they earn to cover costs, the market would have to absorb $411 billion of newly mined BTC annually.
Burnett draws a parallel with the global wine market, which was valued at $385 billion in 2023 and is projected to reach $528 billion by 2030. If a “mundane” sector like wine can sustain that level of consumer demand, an industry securing the world’s leading digital store of value reaching similar scale, he argues, is well within reason.
Despite public perception that Bitcoin is becoming mainstream, Burnett highlights an underreported metric: “The number of people worldwide with $100,000 or more in bitcoin is only 400,000… that’s 0.005% of the global population—just 5 in 100,000 people.”
Meanwhile, studies might show around 39% of Americans have some level of “direct or indirect” Bitcoin exposure, but this figure includes any fractional ownership—such as holding shares of Bitcoin-related equities or ETFs through mutual funds and pension plans. Real, substantial adoption remains niche. “If Bitcoin is the best long-term savings technology, we would expect anyone with substantial savings to hold a substantial amount of bitcoin. Yet today, virtually no one does.”
Burnett emphasizes that the road to $10 million does not require Bitcoin to supplant all money worldwide—only to “absorb a meaningful percentage of global wealth.” The strategy for forward-looking investors, he contends, is simple but non-trivial: ignore short-term noise, focus on the multi-year horizon, and act before global awareness of Bitcoin’s properties becomes universal. “Those who can see past the short-term volatility and focus on the bigger picture will recognize bitcoin as the most asymmetric and overlooked bet in global markets.”
In other words, it is about “front-running the capital migration” while Bitcoin’s user base is still comparatively minuscule and the vast majority of traditional wealth remains in legacy assets.
At press time, BTC traded at $83,388.
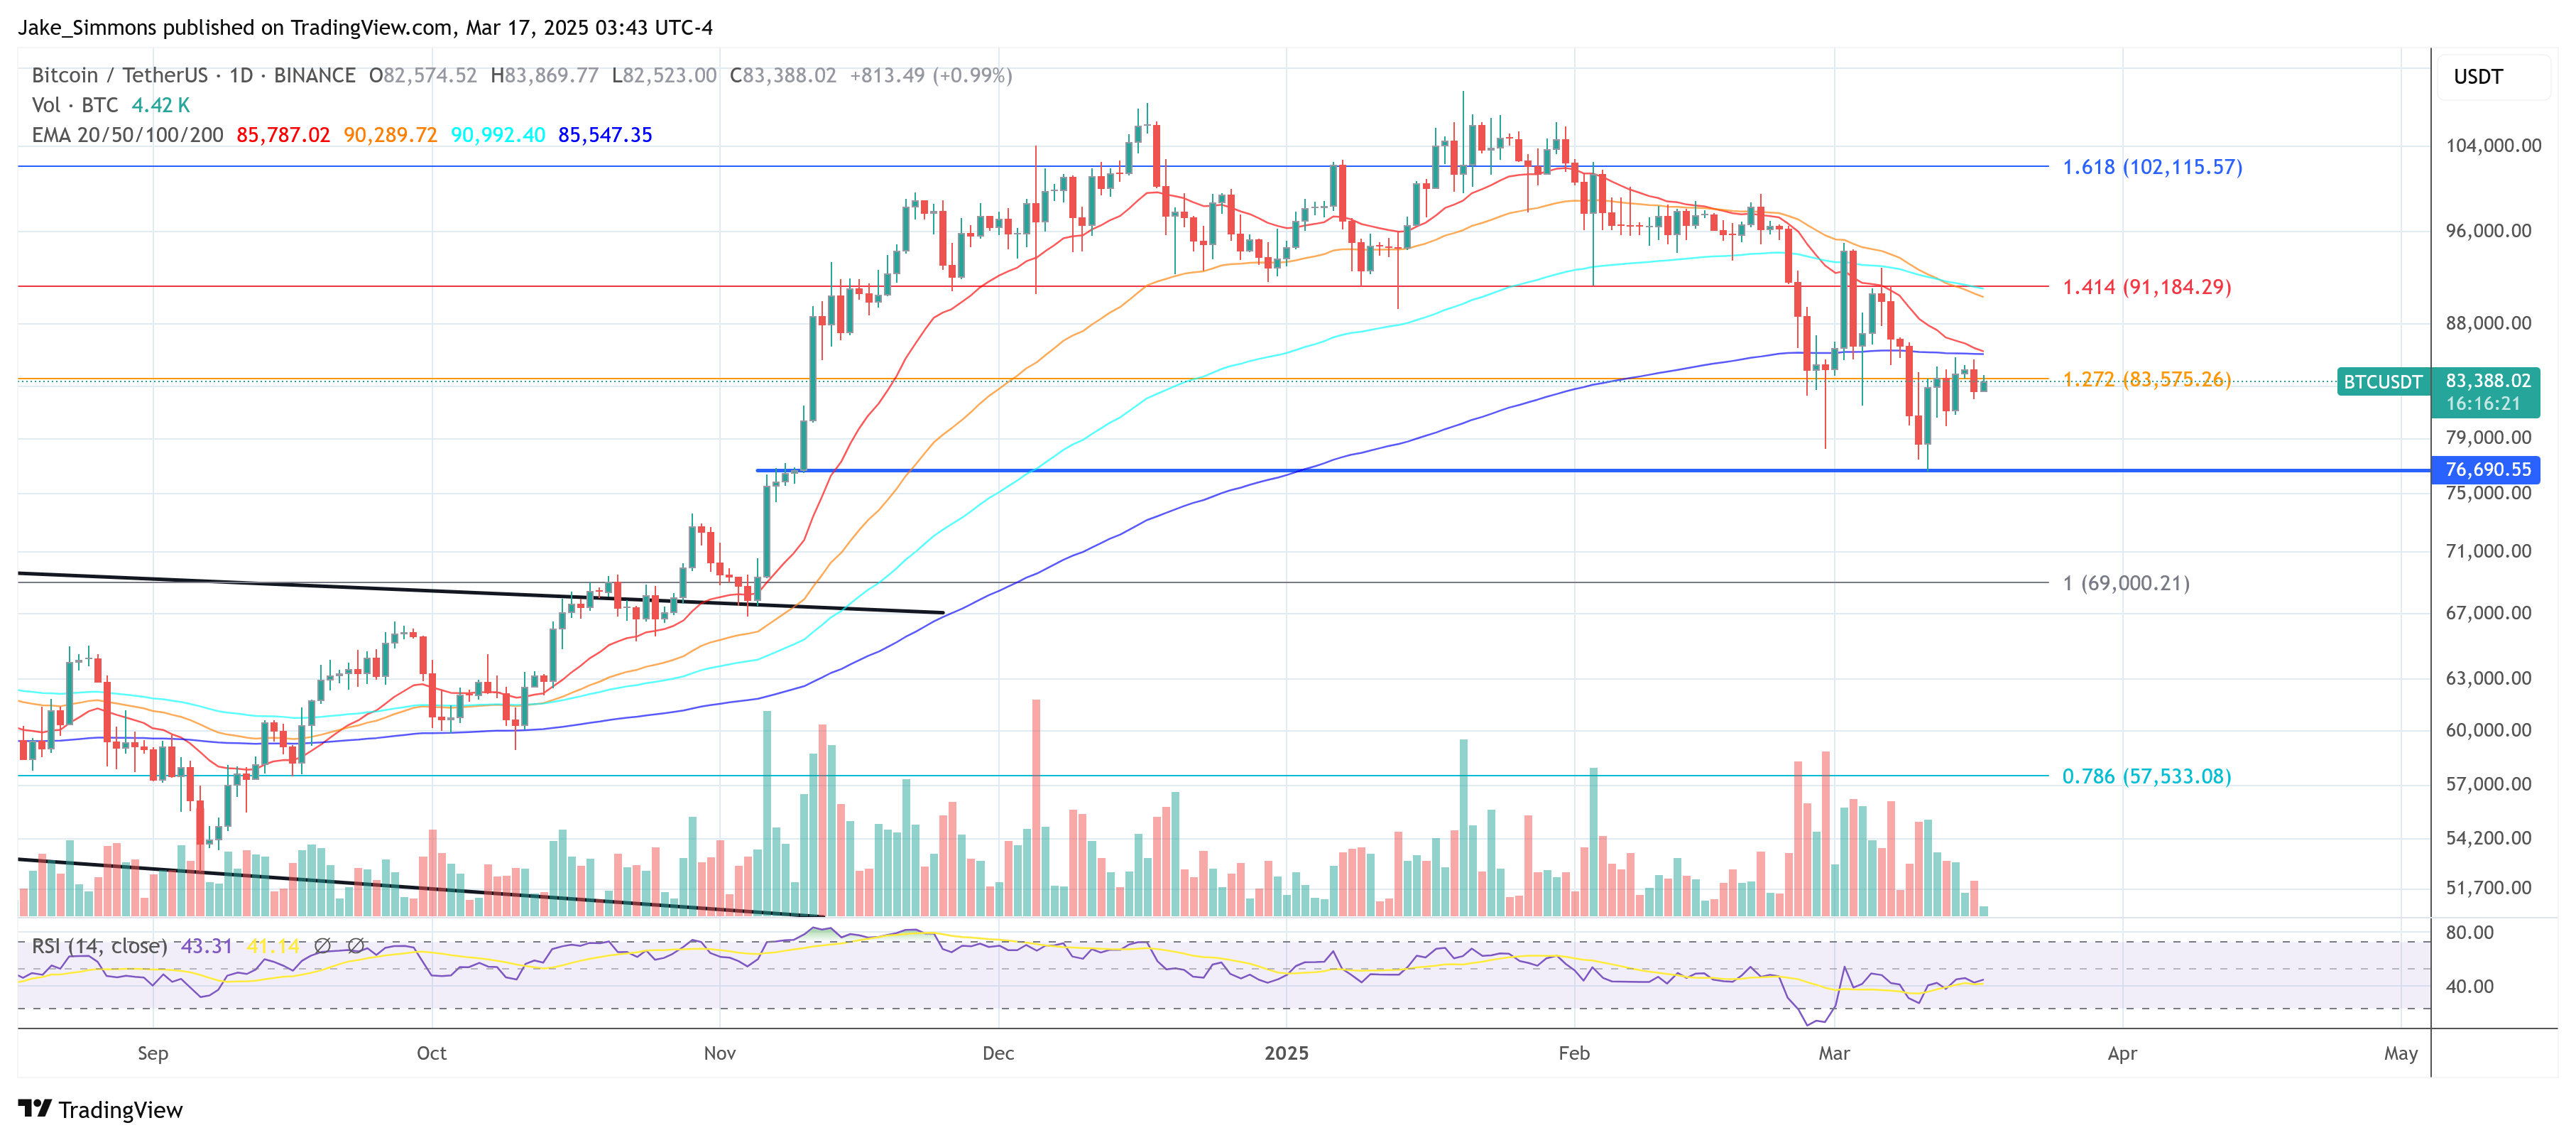
Featured image created with DALL.E, chart from TradingView.com
Source link
Reason to trust
![]()
Strict editorial policy that focuses on accuracy, relevance, and impartiality
Created by industry experts and meticulously reviewed
The highest standards in reporting and publishing
Strict editorial policy that focuses on accuracy, relevance, and impartiality
Morbi pretium leo et nisl aliquam mollis. Quisque arcu lorem, ultricies quis pellentesque nec, ullamcorper eu odio.
Bitcoin’s price trajectory has become a significant point of interest in light of the recent downtrend, which has disappointed many bullish traders. According to on-chain analytics platform IntoTheBlock, the recent price crash up to the current price has seen over 6.5 million BTC addresses falling into losses. Still, technical analysis suggests Bitcoin could experience further drops.
The question is whether Bitcoin will test the $70,000 mark before regaining strength or can rebound from here toward a $300,000 price target. Insights from price structure and historical patterns help provide a clearer picture of what’s next.
Bitcoin Price Decline: A Normal Cycle Within Uptrends
Despite concerns over Bitcoin’s recent price swings, crypto analyst Philip (BasicTradingTV) maintains that the market is behaving normally within a long-term bullish structure. He highlights that on the higher monthly timeframe, Bitcoin continues to create higher highs and higher lows and maintains a solid uptrend that dates back to 2017.
Related Reading
This technical outlook, which was noted on the TradingView platform, comes as a response to concerns about whether BTC is still bullish after the ongoing 25% correction from its recent all-time high.
Traders have been unsettled following the recent drop, but historical trends suggest this kind of movement is part of the market’s natural cycle. According to the analyst, Bitcoin is still forming a bullish market structure, and while short-term fluctuations may continue, the broader uptrend channel from 2017 is still in place. Furthermore, the analyst noted previous instances of 25% and 40% corrections during Bitcoin’s rallies from the lower trendline of this uptrend channel.
What’s Next For BTC? Possible Retest Of Resistance Before Rally To $300,000
With the notion of a long-term uptrend still intact, the analyst noted, however, that Bitcoin could continue its downtrend until it reaches $70,000. This level holds significant importance, as it previously marked Bitcoin’s all-time high before turning into resistance around mid-2024. After multiple attempts, Bitcoin eventually broke through this resistance toward the end of the year, leading to its new all-time high of $108,786 in January 2025.
Related Reading
As such, this $70,000 level is now a major psychological support zone, making it a key area to watch amidst the ongoing Bitcoin price correction. From here, the analyst predicted a rebound that would send BTC to reach as high as $300,000. “Levels to watch: 70.000, $300.000,” the analyst said.
At the time of writing, Bitcoin is trading at $82,555, having spent the majority of the past 24 hours trading between $79,947 and $83,436. This leaves Bitcoin still about 14% away from testing the $70,000 support level.
However, there is also the possibility that BTC may not drop as low as $70,000 before bullish sentiment takes over once again. If Bitcoin continues to follow the trajectory of past cycles, Fibonacci extensions point to price targets between $150,000 and $300,000.
Featured image from Unsplash, chart from Tradingview.com
Source link
Bitcoin has been struggling with lower lows in recent weeks, leaving many investors questioning whether the asset is on the brink of a major bear cycle. However, a rare data point tied to the US Dollar Strength Index (DXY) suggests that a significant shift in market dynamics may be imminent. This bitcoin buy signal, which has only appeared three times in BTC’s history, could point to a bullish reversal despite the current bearish sentiment.
For a more in-depth look into this topic, check out a recent YouTube video here:
Bitcoin: This Had Only Ever Happened 3x Before
BTC vs DXY Inverse Relationship
Bitcoin’s price action has long been inversely correlated with the US Dollar Strength Index (DXY). Historically, when the DXY strengthens, BTC tends to struggle, while a declining DXY often creates favorable macroeconomic conditions for Bitcoin price appreciation.


Despite this historically bullish influence, Bitcoin’s price has continued to retreat, recently dropping from over $100,000 to below $80,000. However, past occurrences of this rare DXY retracement suggest that a delayed but meaningful BTC rebound could still be in play.
Bitcoin Buy Signal Historic Occurrences
Currently, the DXY has been in a sharp decline, a decrease of over 3.4% within a single week, a rate of change that has only been observed three times in Bitcoin’s entire trading history.

To understand the potential impact of this DXY signal, let’s examine the three prior instances when this sharp decline in the US dollar strength index occurred:
- 2015 Post-Bear Market Bottom
The first occurrence was after BTC’s price had bottomed out in 2015. Following a period of sideways consolidation, BTC’s price experienced a significant upward surge, gaining over 200% within months.
The second instance occurred in early 2020, following the sharp market collapse triggered by the COVID-19 pandemic. Similar to the 2015 case, BTC initially experienced choppy price action before a rapid upward trend emerged, culminating in a multi-month rally.
- 2022 Bear Market Recovery
The most recent instance happened at the end of the 2022 bear market. After an initial period of price stabilization, BTC followed with a sustained recovery, climbing to substantially higher prices and kicking off the current bull cycle over the following months.
In each case, the sharp decline in the DXY was followed by a consolidation phase before BTC embarked on a significant bullish run. Overlaying the price action of these three instances onto our current price action we get an idea of how things could play out in the near future.

Equity Markets Correlation
Interestingly, this pattern isn’t limited to Bitcoin. A similar relationship can be observed in traditional markets, particularly in the Nasdaq and the S&P 500. When the DXY retraces sharply, equity markets have historically outperformed their baseline returns.

The all-time average 30-day return for the Nasdaq following a similar DXY decline stands at 4.29%, well above the standard 30-day return of 1.91%. Extending the window to 60 days, the Nasdaq’s average return increases to nearly 7%, nearly doubling the typical performance of 3.88%. This correlation suggests that Bitcoin’s performance following a sharp DXY retracement aligns with historical broader market trends, reinforcing the argument for a delayed but inevitable positive response.
Conclusion
The current decline in the US Dollar Strength Index represents a rare and historically bullish Bitcoin buy signal. Although BTC’s immediate price action remains weak, historical precedents suggest that a period of consolidation will likely be followed by a significant rally. Especially when reinforced by observing the same response in indexes such as the Nasdaq and S&P 500, the broader macroeconomic environment is setting up favorably for BTC.
Explore live data, charts, indicators, and in-depth research to stay ahead of Bitcoin’s price action at Bitcoin Magazine Pro.
Disclaimer: This article is for informational purposes only and should not be considered financial advice. Always do your own research before making any investment decisions.
Source link

Memecoin Insider Creates Wolf of Wall Street-Inspired Coin Despite Potential Interpol Warrant: Report

Bitfarms stock dips despite $110m acquisition

Police Arrest Four Teens Over Amouranth Home Invasion, Attempted Bitcoin Theft

MUBARAK Coin Price Soars 22% Amid This Binance Announcement, What’s Next?

Michael Saylor’s MSTR Purchases 130 Additional BTC

Michael Saylor’s Strategy makes smallest Bitcoin purchase on record
Bitcoin To $10 Million? Experts Predict Explosive Growth By 2035

Dormant whale sends 300 BTC to FalconX as Bitcoin nears $84k CME gap

Bitcoin Flashing Bullish Reversal Signal Amid Waning Sell-Pressure, According to Crypto Strategist

Bitcoin Price Mirrors Gold’s 1970 Rally – A Six-Figure BTC Target of $250k Next?

OKX Pauses DEX Aggregator to Address Security Concerns

Trump’s second ex-wife calls for end of prosecution against Roger Ver

SEC Commissioner Hester Peirce on the New Crypto Task Force
Solana Hits 400B Transactions, Nearly $1T in 5 Years

640,000 Chainlink (LINK) Withdrawn From Exchanges In 24 Hours – Bullish Accumulation?


 24/7 Cryptocurrency News4 months ago
Arthur Hayes, Murad’s Prediction For Meme Coins, AI & DeFi Coins For 2025

 Bitcoin2 months ago
Expert Sees Bitcoin Dipping To $50K While Bullish Signs Persist

 24/7 Cryptocurrency News2 months ago
Aptos Leverages Chainlink To Enhance Scalability and Data Access

 Bitcoin4 months ago
Bitcoin Could Rally to $80,000 on the Eve of US Elections

 Bitcoin4 months ago
Institutional Investors Go All In on Crypto as 57% Plan to Boost Allocations as Bull Run Heats Up, Sygnum Survey Reveals

 Altcoins2 months ago
Sonic Now ‘Golden Standard’ of Layer-2s After Scaling Transactions to 16,000+ per Second, Says Andre Cronje

 Opinion4 months ago
Crypto’s Big Trump Gamble Is Risky

 Price analysis4 months ago
Ripple-SEC Case Ends, But These 3 Rivals Could Jump 500x
