
ETH
ETH Accelerates Losses Amid Market Turmoil

Ethereum price started a fresh decline from the $2,350 resistance zone. ETH is now consolidating losses and might extend losses toward the $2,000 support.
- Ethereum is facing an increase in selling below the $2,350 zone.
- The price is trading below $2,250 and the 100-hourly Simple Moving Average.
- There is a key bearish trend line forming with resistance at $2,260 on the hourly chart of ETH/USD (data feed via Kraken).
- The pair could start a decent recovery wave if it settles above $2,250 and $2,350.
Ethereum Price Dips Further
Ethereum price failed to clear the $2,450 resistance zone and started a fresh decline, like Bitcoin. ETH gained pace below the $2,350 and $2,320 support levels to move further in a bearish zone.
The price declined over 5% and even traded below the $2,220 support zone. A low was formed at $2,123 and the price is now consolidating losses. It is showing many bearish signs below the 23.6% Fib retracement level of the downward wave from the $2,520 swing high to the $2,123 low.
Ethereum price is now trading below $2,250 and the 100-hourly Simple Moving Average. There is also a key bearish trend line forming with resistance at $2,260 on the hourly chart of ETH/USD.
On the upside, the price seems to be facing hurdles near the $2,220 level. The first major resistance is near the $2,250 level or the trend line and the 50% Fib retracement level of the downward wave from the $2,520 swing high to the $2,123 low.

The main resistance is now forming near $2,350. A clear move above the $2,360 resistance might send the price toward the $2,450 resistance. An upside break above the $2,450 resistance might call for more gains in the coming sessions. In the stated case, Ether could rise toward the $2,500 resistance zone or even $2,550 in the near term.
More Losses In ETH?
If Ethereum fails to clear the $2,250 resistance, it could start another decline. Initial support on the downside is near the $2,120 level. The first major support sits near the $2,050 zone.
A clear move below the $2,050 support might push the price toward the $2,000 support. Any more losses might send the price toward the $1,880 support level in the near term. The next key support sits at $1,750.
Technical Indicators
Hourly MACD – The MACD for ETH/USD is gaining momentum in the bearish zone.
Hourly RSI – The RSI for ETH/USD is now below the 50 zone.
Major Support Level – $2,120
Major Resistance Level – $2,260
Source link


ADA
Analyst Says Crypto Whales Loading Up on Ethereum, Accumulating $815,514,345 in ETH in Just Five Days

A crypto analyst says deep-pocketed investors are snapping up the top layer-1 platform Ethereum (ETH) amid the marketwide digital asset correction.
Trader Ali Martinez tells his 132,900 followers on the social media platform X that whales gobbled up more than $815.514 million worth of ETH in less than a week.
“Whales have bought more than 420,000 Ethereum ETH in [five days]!”

Martinez is also keeping a close watch on Ethereum’s In/Out of the Money Around Price (IOMAP) metric – which classifies crypto addresses as either profiting, breaking even, or losing money – to determine support and resistance levels for ETH.
According to Martinez, ETH is currently trading in a narrow range between stiff support and resistance zones.
“Ethereum ETH key levels to watch! On-chain data reveals $1,870 as the strongest support and $2,050 as its toughest resistance!”

At time of writing, ETH is trading for $1,941.
Turning to Bitcoin (BTC), the trader believes that the crypto king is poised to witness tactical rallies after breaching the horizontal resistance of an ascending triangle pattern.
“Bitcoin BTC is breaking out! The target is $90,000 as long as the $84,000 support holds.”
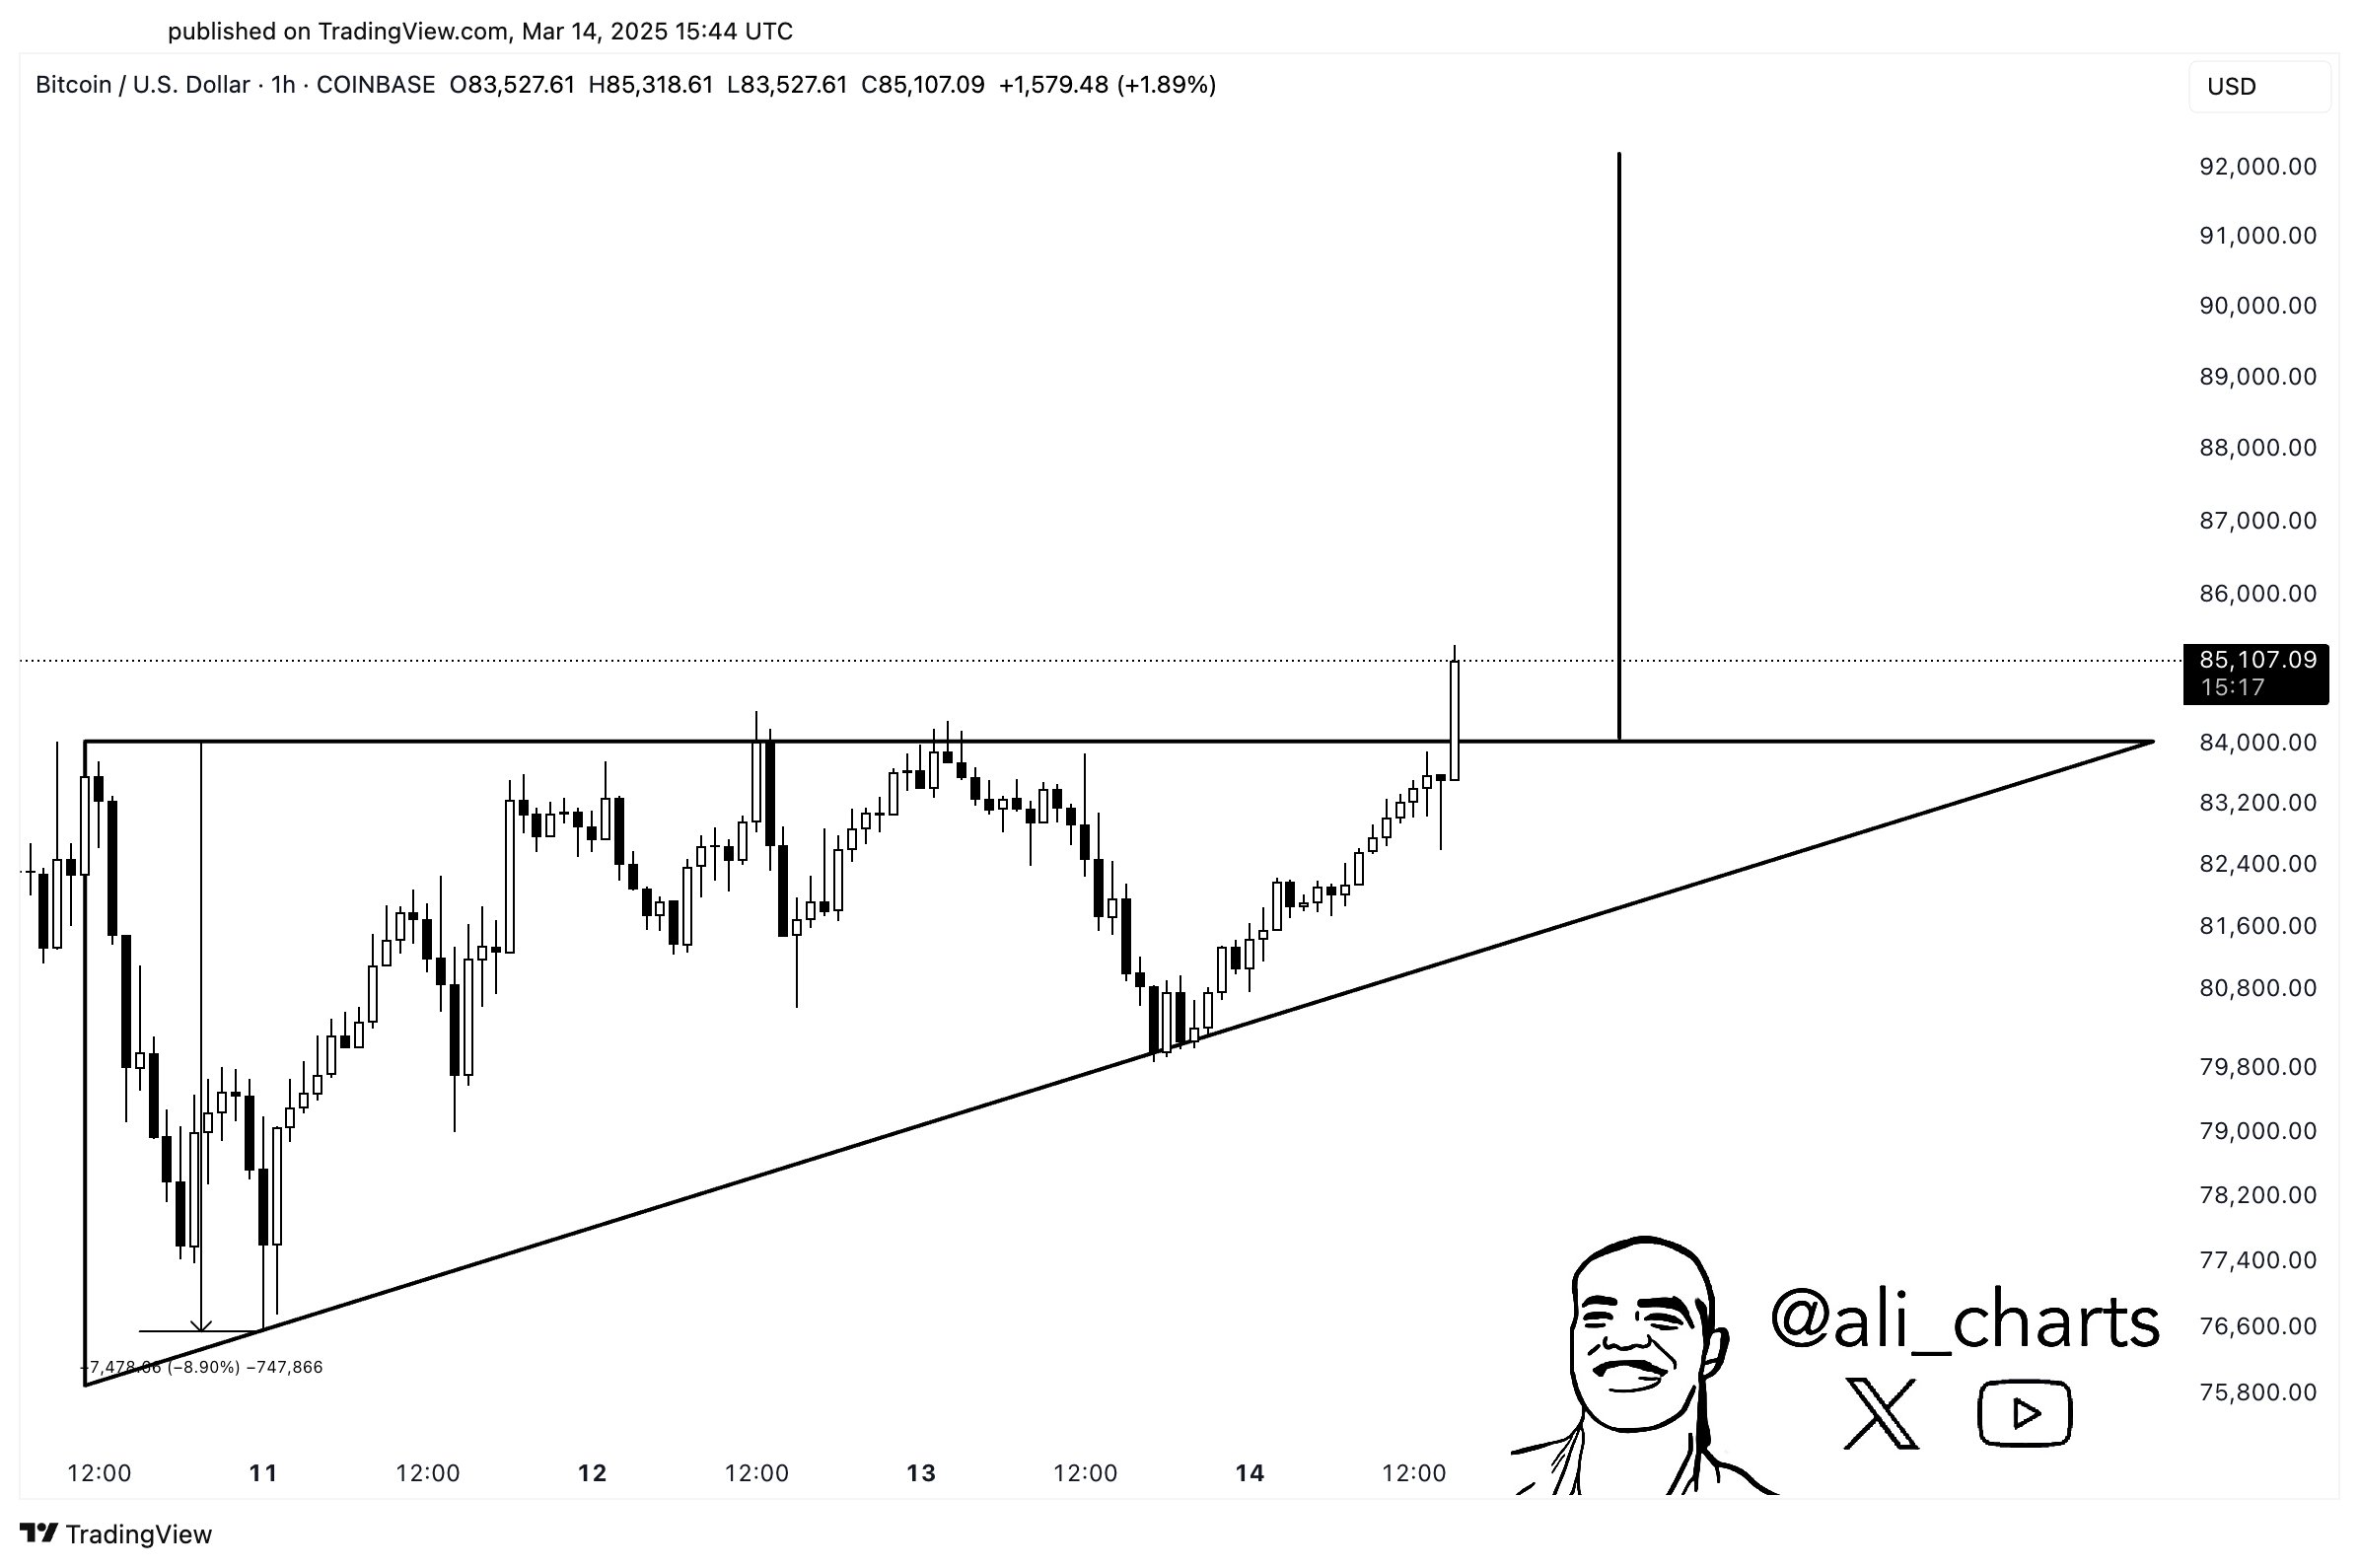
An ascending triangle pattern may be considered a bullish reversal structure if the asset soars above its horizontal resistance.
At time of writing, Bitcoin is trading for $84,288.
Turning to Ethereum rival Cardano, the analyst predicts rallies for ADA if the altcoin takes out the diagonal resistance of a triangle pattern at around $0.75.
“Cardano ADA is about to break free! Busting out of this triangle will trigger a 15% price move.”
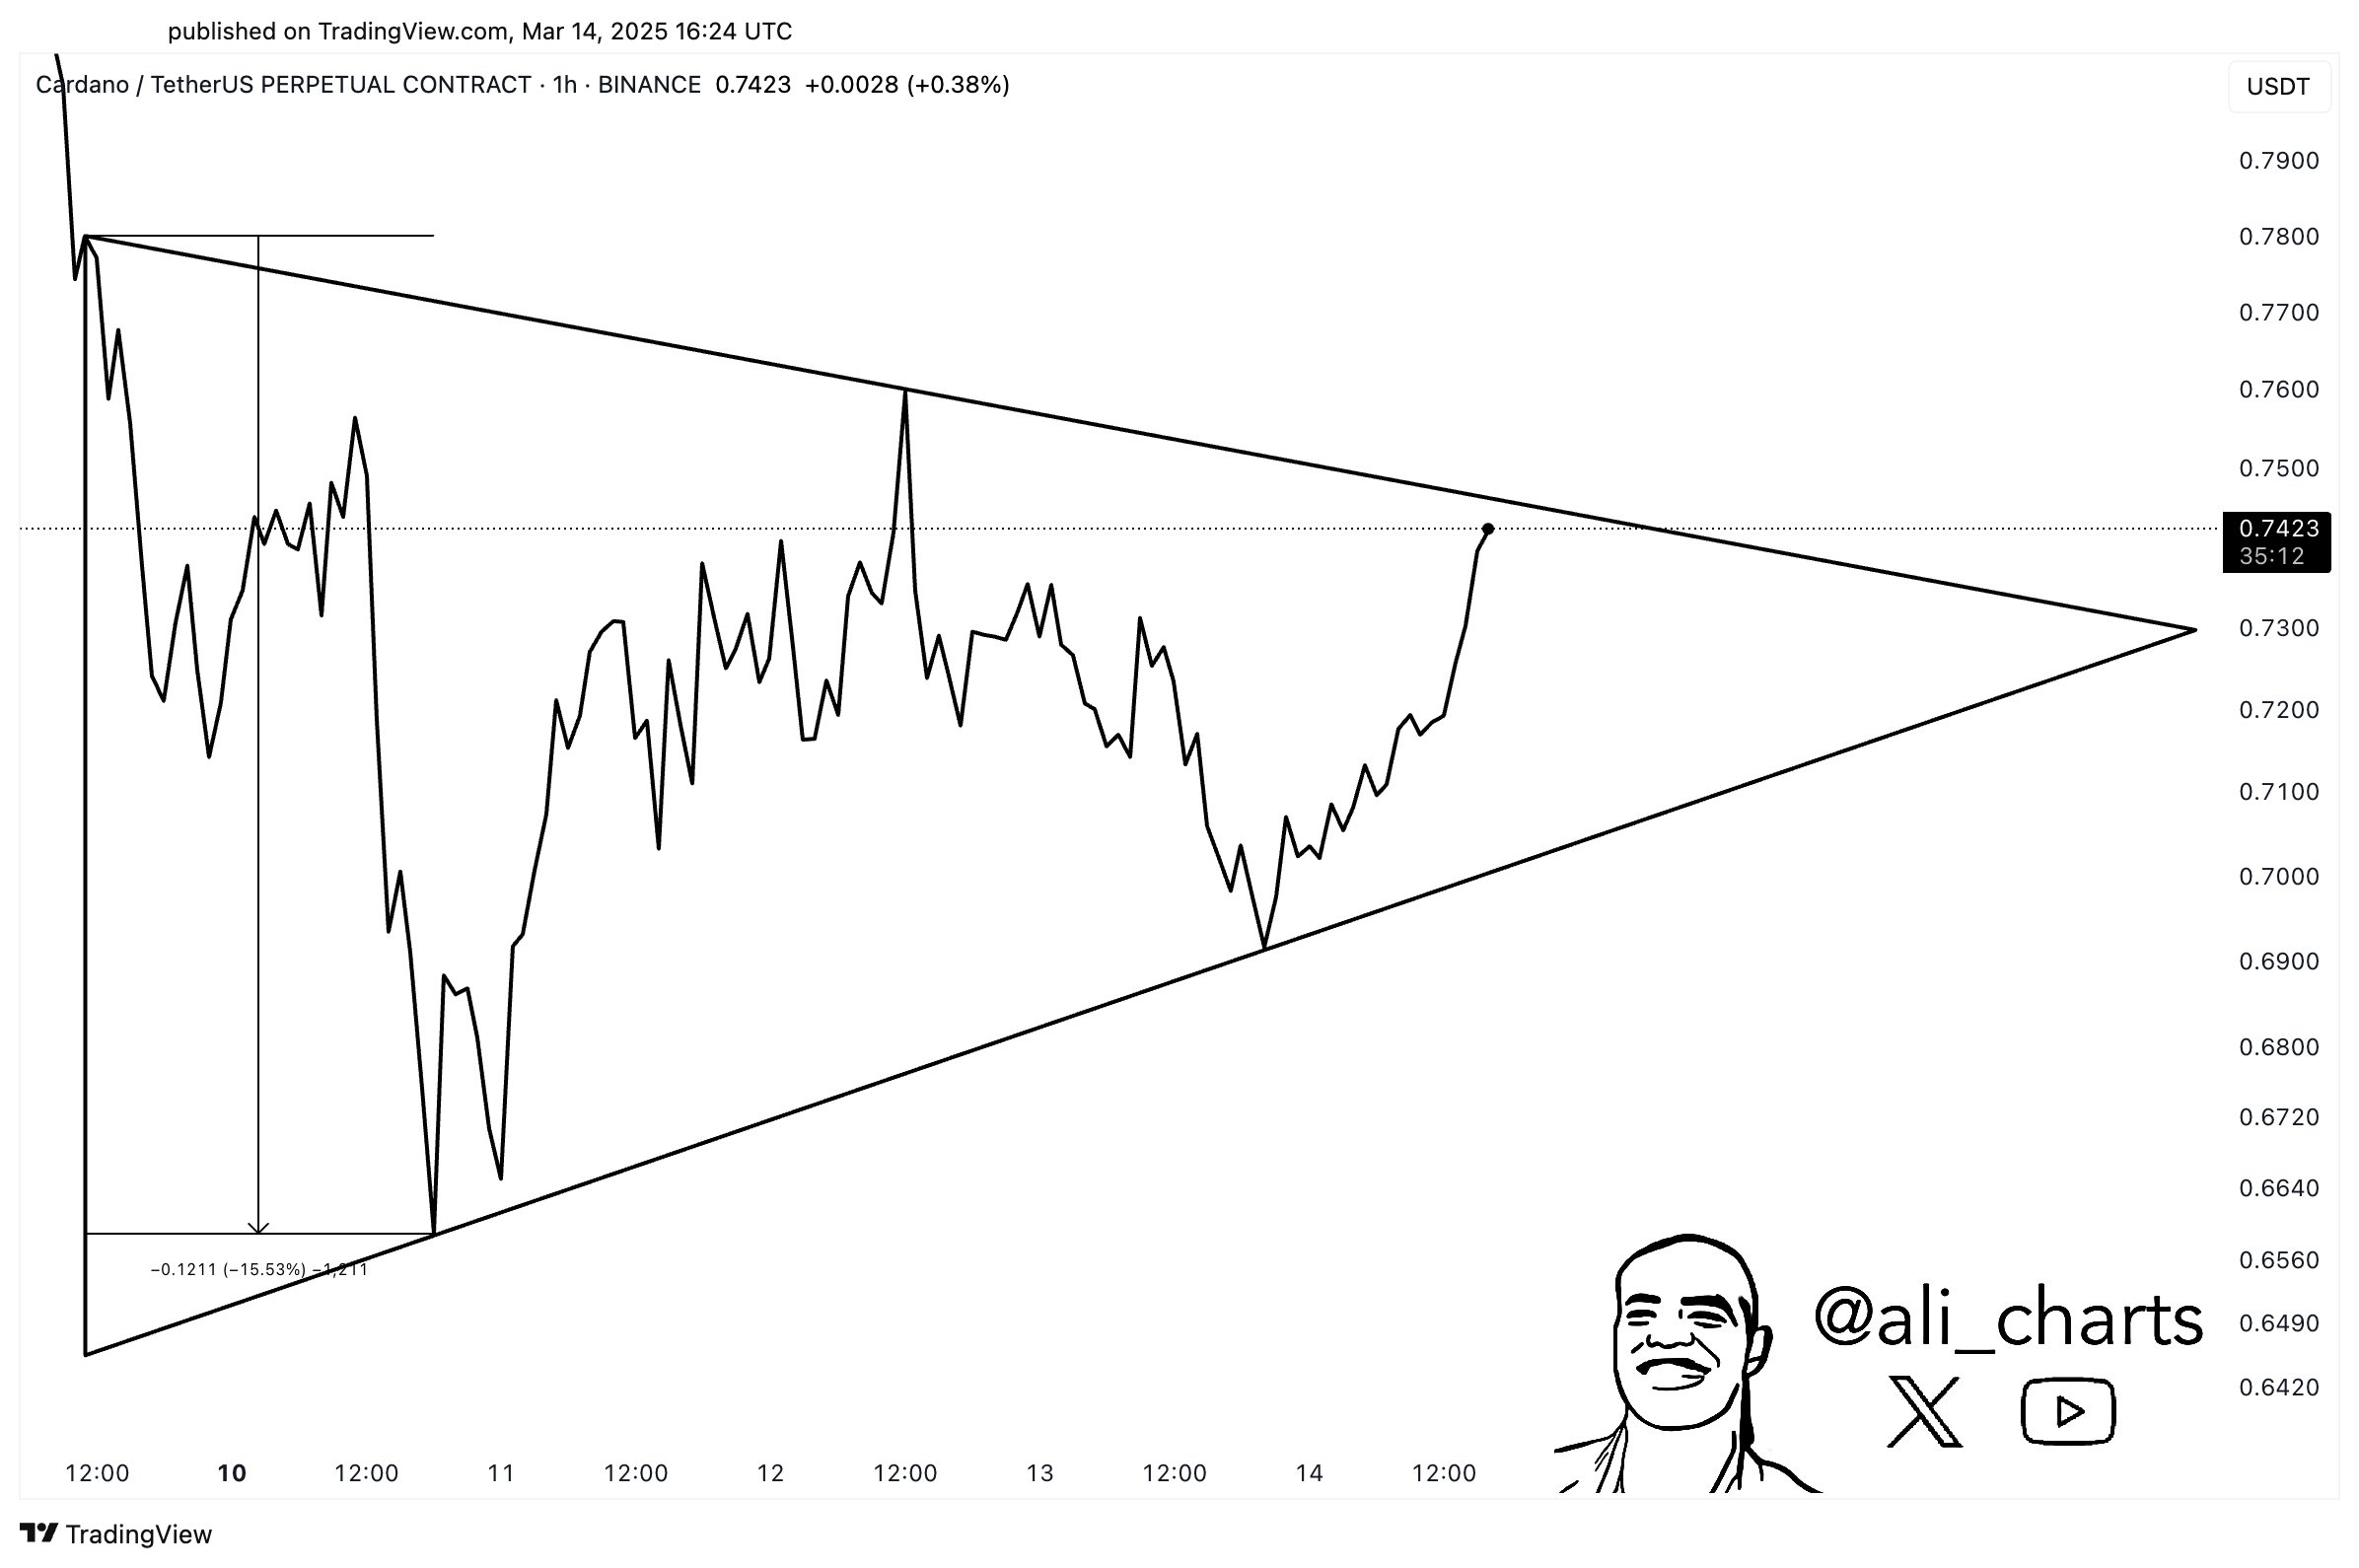
A triangle is typically viewed as a consolidation pattern as it signals a potential breakout in either direction. The asset is considered bullish if the price moves above the diagonal resistance and bearish if it tumbles below the diagonal trend line.
At time of writing, ADA is worth $0.744.
Follow us on X, Facebook and Telegram
Don’t Miss a Beat – Subscribe to get email alerts delivered directly to your inbox
Check Price Action
Surf The Daily Hodl Mix
 

Disclaimer: Opinions expressed at The Daily Hodl are not investment advice. Investors should do their due diligence before making any high-risk investments in Bitcoin, cryptocurrency or digital assets. Please be advised that your transfers and trades are at your own risk, and any losses you may incur are your responsibility. The Daily Hodl does not recommend the buying or selling of any cryptocurrencies or digital assets, nor is The Daily Hodl an investment advisor. Please note that The Daily Hodl participates in affiliate marketing.
Generated Image: Midjourney
Source link

A popular crypto analyst thinks Ethereum (ETH) will have to endure some “pain” before rebounding.
In a new YouTube video, Benjamin Cowen tells his 886,000 subscribers that there probably needs to be a change in monetary policy in order for ETH’s chart against Bitcoin (BTC) to bottom.
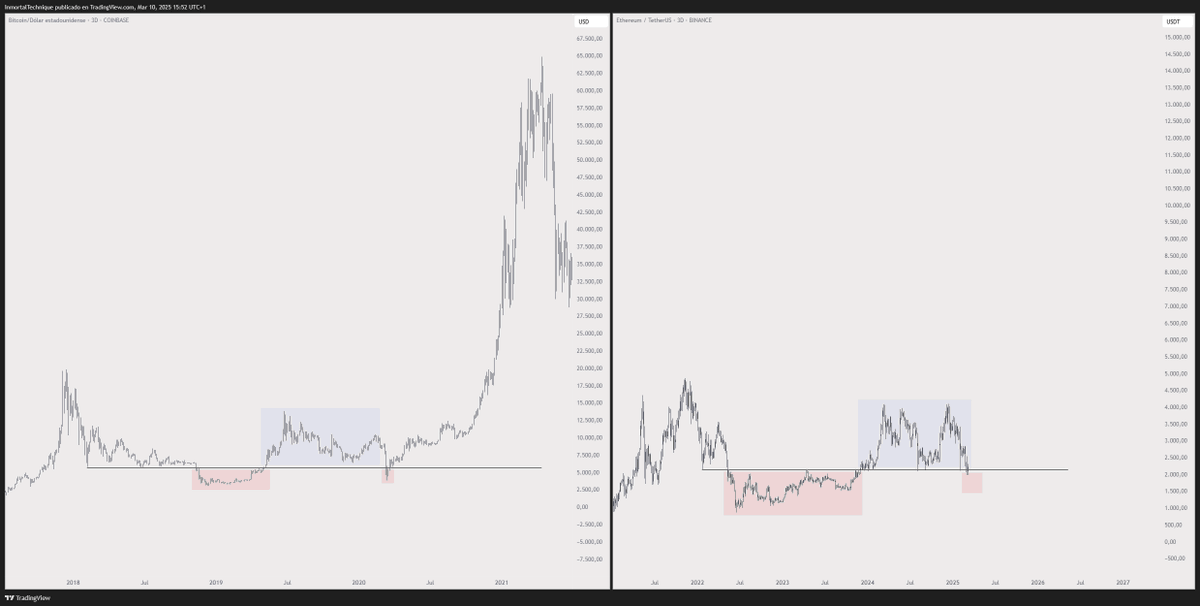
“But in order to have a change in monetary policy, you have to have pain. Welcome to the pain. This is the pain that you ultimately need. Remember last cycle [in 2019], ETH/Bitcoin bottomed after ETH/USD broke support.”
Cowen notes that ETH fell below its support level against the US dollar in 2019 right before the Federal Reserve ended quantitative tightening.
The analyst says that everything that happened in the previous cycle is “basically happening this cycle, it’s just taking place on a longer timeframe.” Cowen also notes that most of the price points of the current cycle are roughly 10x what they were in the 2019 market.
“The reason why people are having a hard time navigating this cycle and why it feels so different is because monetary policy never changed this cycle. In the last cycle, we saw a change in monetary policy in the pre-halving year. We’re now in the post-halving year and we still haven’t seen a change to the quantitative tightening. We’ve seen them taper it a little bit. They’ve slowed it down, but they’ve never actually stopped it.”
ETH is trading at $1,907 at time of writing. The second-ranked crypto asset by market cap is down more than 1% in the past 24 hours.
Don’t Miss a Beat – Subscribe to get email alerts delivered directly to your inbox
Check Price Action
Follow us on X, Facebook and Telegram
Surf The Daily Hodl Mix
 
Disclaimer: Opinions expressed at The Daily Hodl are not investment advice. Investors should do their due diligence before making any high-risk investments in Bitcoin, cryptocurrency or digital assets. Please be advised that your transfers and trades are at your own risk, and any losses you may incur are your responsibility. The Daily Hodl does not recommend the buying or selling of any cryptocurrencies or digital assets, nor is The Daily Hodl an investment advisor. Please note that The Daily Hodl participates in affiliate marketing.
Generated Image: Midjourney
Source link
Bitcoin
Bitcoin Ready To Rally After Hitting Same ‘Extreme Fear’ Levels of COVID Crash and 2022 Bear Market: Trader

A widely followed crypto analyst says that one metric suggests Bitcoin (BTC) is gearing up for a massive breakout.
In a new strategy session, pseudonymous crypto trader Inmortal tells his 230,900 followers on the social media platform X that the Crypto Fear and Greed Index is flashing bullish for digital assets as it has reached “extreme fear,” a level seen during historical market collapses.
The Crypto Fear and Greed Index is a metric that gauges the fear or greed levels in the market with a reading of extreme fear indicating oversold conditions and a reading of extreme greed suggesting overbought conditions.
“Fear is at same levels we saw during Covid-19 crash and 2022 bottom. All of this while US announced a Bitcoin reserve.”
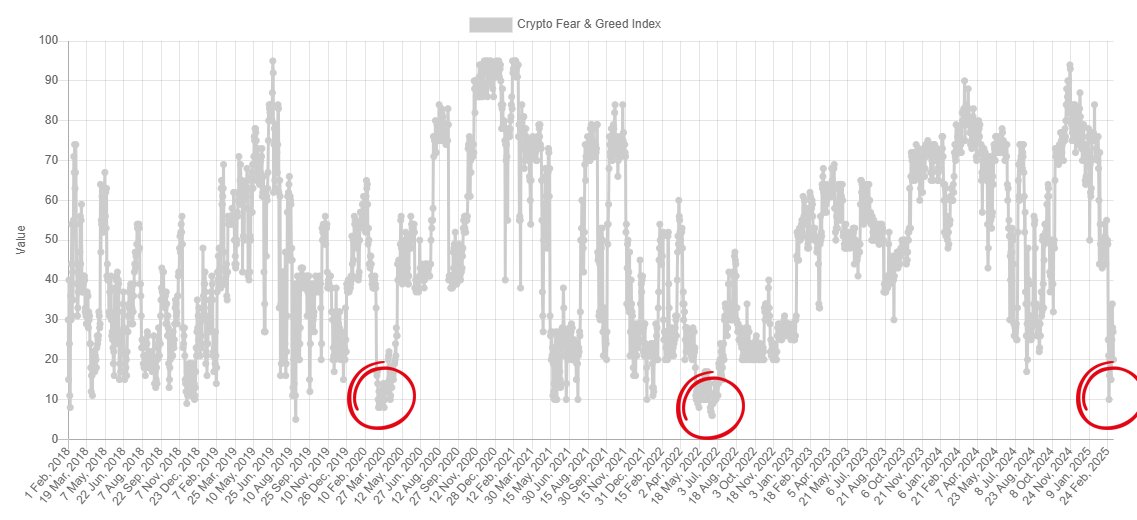
He also says that based on historic precedence market sentiment may remain in “extreme fear” anywhere from a month-and-a-half to about five months.
“Last cycle we visited extreme fear three times, and these periods lasted between 50 and 160 days.”

The analyst believes Bitcoin is repeating a similar pattern from 2024, when BTC retested a support level that erased gains from a bullish run before taking off to print new all-time highs.
“We doing this again.”
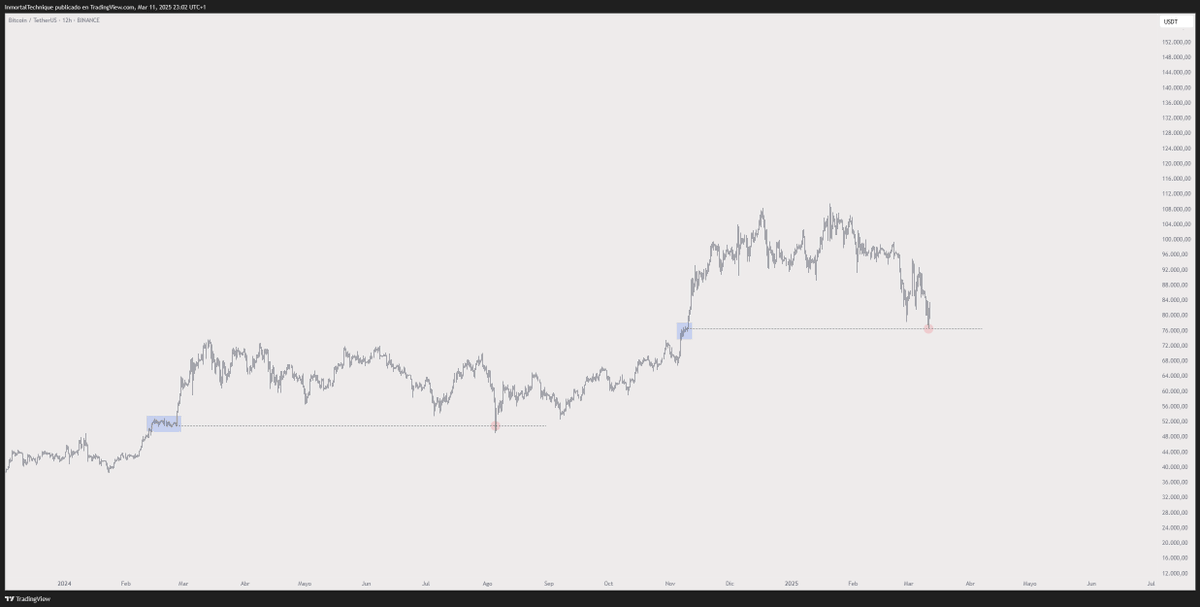
Lastly, the analyst says Ethereum (ETH) may be on the verge of a massive breakout similar to what Bitcoin did in 2020.
“I should accept that it’s all over, as others have already done. I’m not saying it will happen, but if the bull run is not finished, we should see something similar to this.”
Bitcoin is trading for $82,874 at time of writing, flat on the day. Meanwhile, ETH is trading for $1,881 at time of writing, down 3.5% in the last 24 hours.
Don’t Miss a Beat – Subscribe to get email alerts delivered directly to your inbox
Check Price Action
Follow us on X, Facebook and Telegram
Surf The Daily Hodl Mix
 
Disclaimer: Opinions expressed at The Daily Hodl are not investment advice. Investors should do their due diligence before making any high-risk investments in Bitcoin, cryptocurrency or digital assets. Please be advised that your transfers and trades are at your own risk, and any losses you may incur are your responsibility. The Daily Hodl does not recommend the buying or selling of any cryptocurrencies or digital assets, nor is The Daily Hodl an investment advisor. Please note that The Daily Hodl participates in affiliate marketing.
Generated Image: Midjourney
Source link

TokenPicks Launches Reward System to Incentivize Crypto Education

Ethereum leadership now eyes Solana-style growth, Dragonfly’s Qureshi says

SEC’s Uyeda Signals Possible Revisions to Crypto Custody Rule

Mubarak Meme Coin Trader Turns $232 Into $1.1 Million, Here’s How

Solana Protected Gender Identity Before Panning It in Anti-Queer Ad

Musk says he found ‘magic money computers’ printing money ‘out of thin air’

XRP To Triple Digits? Analyst Confident In $100 Price Goal

What Are They And What Do They Do?

Trader Predicts Crypto Rallies Amid Expectations of Fed Monetary Policy Shift – But There’s a Catch

Solana’s 5th birthday highlights explosive growth and trading activity: Mercuryo

Trump, Associates Net $390 Million Payday From World Liberty Token Sale

Bitcoin Price Eyes $200,000 Breakout If This History Aligns

Gold-Backed Tokens Outperform as ‘Bond King’ Gundlach Sees Precious Metal Hit $4,000

Ethena Labs, Securitize launch blockchain for DeFi and tokenized assets

Shiba Inu Gains Momentum: SHIB Price Breaks Above 100-Day Moving Average, What’s Next?


 24/7 Cryptocurrency News4 months ago
Arthur Hayes, Murad’s Prediction For Meme Coins, AI & DeFi Coins For 2025

 Bitcoin2 months ago
Expert Sees Bitcoin Dipping To $50K While Bullish Signs Persist

 24/7 Cryptocurrency News2 months ago
Aptos Leverages Chainlink To Enhance Scalability and Data Access

 Bitcoin4 months ago
Bitcoin Could Rally to $80,000 on the Eve of US Elections

 Altcoins2 months ago
Sonic Now ‘Golden Standard’ of Layer-2s After Scaling Transactions to 16,000+ per Second, Says Andre Cronje

 Bitcoin4 months ago
Institutional Investors Go All In on Crypto as 57% Plan to Boost Allocations as Bull Run Heats Up, Sygnum Survey Reveals

 Opinion4 months ago
Crypto’s Big Trump Gamble Is Risky

 Price analysis4 months ago
Ripple-SEC Case Ends, But These 3 Rivals Could Jump 500x
