
24/7 Cryptocurrency News
ETH is Down 1% But Whales Accumulate

Ethereum price today trades at $3,871.7 as of 11 PM. The drop comes after ETH hit a daily high of $3,944.4 after -0.79% move on December 15.
Ethereum Price Today: Why is ETH down?
Ethereum price faces rejection from the parallel channel’s midpoint. This weakness can be attributed to Bitcoin’s recent slump, which has affected altcoins, include ETH. Additionally, the end of the week is often leads to a drop in volume and liquidity.
Will Ether bounce or drop lower? Let’s explore.
Ethereum Price Chart Today

*Ethereum price updated as of 11 PM.
Ethereum’s innovative smart contract technology has made it a standout altcoin since its inception in 2015. Continuous major network upgrades ensure Ethereum stays ahead in smart contract innovation. The latest upgrade, Cancun, launched on March 13, 2024.
Ethereum Price Forecast & Outlook
ETH’s year-to-date (YTD) performance continues to increase and currently sits at 75.29%. This recent slump in Bitcoin price has affected the YTD gains, which have dropped from 50% since November 11.
Ethereum: The Second-Largest Crypto By Market Cap

Ethereum ranks second in market capitalization, valued at $466.8 billion, after Bitcoin’s $1.95 trillion. Together, BTC & ETH’s market capitalization constitutes 83% of the total crypto market cap.
Since its all-time high of $571 billion in November 2021, Ethereum’s value decreased by half in October, but has spiked recently due to Bitcoin’s new ATH. Still, Ethereum maintains a strong lead over other popular cryptocurrencies:
- Solana (SOL): $109 billion
- Ripple (XRP): $138 billion
- BNB (BNB): $104 billion
In addition to a massive market cap, Ethereum’s 24-hour trading volume sits at $28.6 billion.
Ethereum’s Crypto Trading Volume Soars
The 24-hour trading volume of Ethereum is $28.6 billion. Binance is the largest contributor to this trading volume – about 11% is contributed by spot trading and nearly 40% from futures trading. Exchanges like OKX, Bitget, and ByBit follow Binance.
Ethereum’s Proof-of-Stake Technology
The London hard fork is a significant Ethereum blockchain upgrade. It changed the network from Proof-of-Work (PoW) to Proof-of-Stake (PoS). Ethereum co-founder Vitalik Buterin recently shared his thoughts on X (formerly Twitter). He explained how Proof-of-Stake (PoS) is more decentralized than Proof-of-Work (PoW).
Important Upgrades to Ethereum Blockchain
Here are some key upgrades in the past five years that shaped Ethereum as the second-largest crypto by market capitalization.
Cancun-Deneb (“Dencun”): This upgrade aimed to improve Ethereum’s scalability, security, and usability, setting the stage for further enhancements.
2023:
2022:
2021:
London: Implemented the highly anticipated EIP-1559, which reformed the transaction fee market, making it more efficient and user-friendly.
2020:
ETH Gas’ Effect on Ether Prices
The blockchain upgrades Ethereum receives aim to solve the trilemma of blockchain, i.e., balancing decentralization, security, and scalability. The switch to Proof-of-Stake (PoS) enhanced these aspects. Ethereum’s transaction fees (gas fees) plummeted post-upgrade, drawing more investors. Gas fees are like taxes, measured in Gwei, required for secure transactions.
As of December 15, the gas fee for a transaction on the ETH network as of 11 PM is 14 Gwei.
When Ethereum’s on-chain value grows, presenting opportunities, investors flock, driving gas fees up. This typically occurs during market upswings, peaking at all-time highs.
Ethereum Price Forecast For The Next 7 Days
| Date | Price | Change |
|---|---|---|
| December 14, 2024 | 3873.35 | -1.43% |
| December 15, 2024 | 3876.29 | -1.35% |
| December 16, 2024 | 3878.41 | -1.3% |
| December 17, 2024 | 3890.85 | -0.98% |
| December 18, 2024 | 3928.84 | -0.01% |
| December 19, 2024 | 3925.03 | -0.11% |
| December 20, 2024 | 3932.95 | 0.09% |
| December 21, 2024 | 3926.91 | -0.06% |
| December 22, 2024 | 3907.58 | -0.56% |
| December 23, 2024 | 3899.74 | -0.75% |
| December 24, 2024 | 3897.59 | -0.81% |
| December 25, 2024 | 3878.41 | -1.3% |
| December 26, 2024 | 3901.36 | -0.71% |
| December 27, 2024 | 3912.61 | -0.43% |
| December 28, 2024 | 3937.11 | 0.2% |
| December 29, 2024 | 3986.24 | 1.45% |
| December 30, 2024 | 3982.79 | 1.36% |
| December 31, 2024 | 3995.28 | 1.68% |
| January 01, 2025 | 4002.47 | 1.86% |
| January 02, 2025 | 3998.53 | 1.76% |
| January 03, 2025 | 4007.53 | 1.99% |
| January 04, 2025 | 4093.78 | 4.18% |
| January 05, 2025 | 4214.33 | 7.25% |
| January 06, 2025 | 4249.69 | 8.15% |
| January 07, 2025 | 4313.27 | 9.77% |
| January 08, 2025 | 4377.11 | 11.39% |
| January 09, 2025 | 4363.26 | 11.04% |
| January 10, 2025 | 4382.38 | 11.53% |
| January 11, 2025 | 4439.84 | 12.99% |
| January 12, 2025 | 4261.57 | 8.45% |
Based on CoinGagpe’s Ethereum price predictions, investors can expect ETH to trade at around $3,373 in the next week. This is a considerate prediction and is in line with the lackluster performance seen since the start of 2024.
Ethereum Price Forecast Between 2025 & 2029
| January | $3,685.34 | $4,024.04 | $3,854.70 | 59.9% |
| February | $3,497.33 | $4,061.84 | $3,779.59 | 56.8% |
| March | $3,309.32 | $4,099.64 | $3,704.49 | 53.6% |
| April | $3,121.31 | $4,137.44 | $3,629.38 | 50.5% |
| May | $2,933.30 | $4,175.24 | $3,554.28 | 47.4% |
| June | $2,745.29 | $4,213.04 | $3,479.17 | 44.3% |
| July | $2,557.28 | $4,250.84 | $3,404.07 | 41.2% |
| August | $2,369.27 | $4,288.64 | $3,328.96 | 38.1% |
| September | $2,181.26 | $4,326.44 | $3,253.86 | 35% |
| October | $1,993.25 | $4,364.24 | $3,178.75 | 31.8% |
| November | $1,805.24 | $4,402.04 | $3,103.65 | 28.7% |
| December | $1,617.23 | $4,439.84 | $3,028.54 | 25.6% |
| All Time | $2,651.29 | $4,231.94 | $3,441.62 | 42.7% |
| January | $1,917.96 | $4,517.77 | $3,299.08 | 36.8% |
| February | $2,218.69 | $4,595.70 | $3,569.62 | 48.1% |
| March | $2,519.42 | $4,673.63 | $3,840.16 | 59.3% |
| April | $2,820.15 | $4,751.56 | $4,110.69 | 70.5% |
| May | $3,120.88 | $4,829.49 | $4,381.23 | 81.7% |
| June | $3,421.62 | $4,907.42 | $4,651.77 | 92.9% |
| July | $3,722.35 | $4,985.35 | $4,922.31 | 104.2% |
| August | $4,023.08 | $5,063.28 | $5,192.85 | 115.4% |
| September | $4,323.81 | $5,141.21 | $5,463.39 | 126.6% |
| October | $4,624.54 | $5,219.14 | $5,733.92 | 137.8% |
| November | $4,925.27 | $5,297.07 | $6,004.46 | 149% |
| December | $5,226 | $5,375 | $6,275 | 160.3% |
| All Time | $3,571.98 | $4,946.39 | $4,787.04 | 98.5% |
| January | $5,417.25 | $5,571.75 | $6,513.75 | 170.2% |
| February | $5,608.50 | $5,768.50 | $6,752.50 | 180.1% |
| March | $5,799.75 | $5,965.25 | $6,991.25 | 190% |
| April | $5,991 | $6,162 | $7,230 | 199.9% |
| May | $6,182.25 | $6,358.75 | $7,468.75 | 209.8% |
| June | $6,373.50 | $6,555.50 | $7,707.50 | 219.7% |
| July | $6,564.75 | $6,752.25 | $7,946.25 | 229.6% |
| August | $6,756 | $6,949 | $8,185 | 239.5% |
| September | $6,947.25 | $7,145.75 | $8,423.75 | 249.4% |
| October | $7,138.50 | $7,342.50 | $8,662.50 | 259.3% |
| November | $7,329.75 | $7,539.25 | $8,901.25 | 269.2% |
| December | $7,521 | $7,736 | $9,140 | 279.1% |
| All Time | $6,469.13 | $6,653.88 | $7,826.88 | 224.6% |
| January | $7,771.92 | $8,001.25 | $9,467.83 | 292.7% |
| February | $8,022.83 | $8,266.50 | $9,795.67 | 306.3% |
| March | $8,273.75 | $8,531.75 | $10,123.50 | 319.9% |
| April | $8,524.67 | $8,797 | $10,451.33 | 333.5% |
| May | $8,775.58 | $9,062.25 | $10,779.17 | 347.1% |
| June | $9,026.50 | $9,327.50 | $11,107 | 360.7% |
| July | $9,277.42 | $9,592.75 | $11,434.83 | 374.3% |
| August | $9,528.33 | $9,858 | $11,762.67 | 387.9% |
| September | $9,779.25 | $10,123.25 | $12,090.50 | 401.5% |
| October | $10,030.17 | $10,388.50 | $12,418.33 | 415.1% |
| November | $10,281.08 | $10,653.75 | $12,746.17 | 428.7% |
| December | $10,532 | $10,919 | $13,074 | 442.3% |
| All Time | $9,151.96 | $9,460.13 | $11,270.92 | 367.5% |
| January | $10,940 | $11,331.17 | $13,534.75 | 461.4% |
| February | $11,348 | $11,743.33 | $13,995.50 | 480.5% |
| March | $11,756 | $12,155.50 | $14,456.25 | 499.6% |
| April | $12,164 | $12,567.67 | $14,917 | 518.7% |
| May | $12,572 | $12,979.83 | $15,377.75 | 537.8% |
| June | $12,980 | $13,392 | $15,838.50 | 556.9% |
| July | $13,388 | $13,804.17 | $16,299.25 | 576% |
| August | $13,796 | $14,216.33 | $16,760 | 595.1% |
| September | $14,204 | $14,628.50 | $17,220.75 | 614.3% |
| October | $14,612 | $15,040.67 | $17,681.50 | 633.4% |
| November | $15,020 | $15,452.83 | $18,142.25 | 652.5% |
| December | $15,428 | $15,865 | $18,603 | 671.6% |
| All Time | $13,184 | $13,598.08 | $16,068.88 | 566.5% |
In the next year, Ethereum price could still be hovering in the current range. Based on the prediction data, ETH’s trade range extends from $3,001.19 to $4,651.84. This outlook is based on the previous data. However, if ETH breaks the trend, it could go much higher.
The long-term outlook extending from 2025 to 2029, Ethereum price could hit a high of $18,603 with the lowest point being $3,000.
Ethereum Price Outlook Between 2030 & 2050
2030
2031
2032
2033
2040
2050
| January | $16,092.58 | $16,559.25 | $19,264.08 | 699% |
| February | $16,757.17 | $17,253.50 | $19,925.17 | 726.4% |
| March | $17,421.75 | $17,947.75 | $20,586.25 | 753.8% |
| April | $18,086.33 | $18,642 | $21,247.33 | 781.3% |
| May | $18,750.92 | $19,336.25 | $21,908.42 | 808.7% |
| June | $19,415.50 | $20,030.50 | $22,569.50 | 836.1% |
| July | $20,080.08 | $20,724.75 | $23,230.58 | 863.5% |
| August | $20,744.67 | $21,419 | $23,891.67 | 890.9% |
| September | $21,409.25 | $22,113.25 | $24,552.75 | 918.4% |
| October | $22,073.83 | $22,807.50 | $25,213.83 | 945.8% |
| November | $22,738.42 | $23,501.75 | $25,874.92 | 973.2% |
| December | $23,403 | $24,196 | $26,536 | 1000.6% |
| All Time | $19,747.79 | $20,377.63 | $22,900.04 | 849.8% |
| January | $24,169.83 | $24,997.58 | $27,711.08 | 1049.4% |
| February | $24,936.67 | $25,799.17 | $28,886.17 | 1098.1% |
| March | $25,703.50 | $26,600.75 | $30,061.25 | 1146.8% |
| April | $26,470.33 | $27,402.33 | $31,236.33 | 1195.6% |
| May | $27,237.17 | $28,203.92 | $32,411.42 | 1244.3% |
| June | $28,004 | $29,005.50 | $33,586.50 | 1293.1% |
| July | $28,770.83 | $29,807.08 | $34,761.58 | 1341.8% |
| August | $29,537.67 | $30,608.67 | $35,936.67 | 1390.5% |
| September | $30,304.50 | $31,410.25 | $37,111.75 | 1439.3% |
| October | $31,071.33 | $32,211.83 | $38,286.83 | 1488% |
| November | $31,838.17 | $33,013.42 | $39,461.92 | 1536.7% |
| December | $32,605 | $33,815 | $40,637 | 1585.5% |
| All Time | $28,387.42 | $29,406.29 | $34,174.04 | 1317.4% |
| January | $33,881.25 | $35,131.33 | $42,063 | 1644.6% |
| February | $35,157.50 | $36,447.67 | $43,489 | 1703.8% |
| March | $36,433.75 | $37,764 | $44,915 | 1762.9% |
| April | $37,710 | $39,080.33 | $46,341 | 1822.1% |
| May | $38,986.25 | $40,396.67 | $47,767 | 1881.2% |
| June | $40,262.50 | $41,713 | $49,193 | 1940.4% |
| July | $41,538.75 | $43,029.33 | $50,619 | 1999.5% |
| August | $42,815 | $44,345.67 | $52,045 | 2058.6% |
| September | $44,091.25 | $45,662 | $53,471 | 2117.8% |
| October | $45,367.50 | $46,978.33 | $54,897 | 2176.9% |
| November | $46,643.75 | $48,294.67 | $56,323 | 2236.1% |
| December | $47,920 | $49,611 | $57,749 | 2295.2% |
| All Time | $40,900.63 | $42,371.17 | $49,906 | 1969.9% |
| January | $49,768.50 | $51,484 | $59,820.33 | 2381.1% |
| February | $51,617 | $53,357 | $61,891.67 | 2467.1% |
| March | $53,465.50 | $55,230 | $63,963 | 2553% |
| April | $55,314 | $57,103 | $66,034.33 | 2638.9% |
| May | $57,162.50 | $58,976 | $68,105.67 | 2724.8% |
| June | $59,011 | $60,849 | $70,177 | 2810.7% |
| July | $60,859.50 | $62,722 | $72,248.33 | 2896.6% |
| August | $62,708 | $64,595 | $74,319.67 | 2982.5% |
| September | $64,556.50 | $66,468 | $76,391 | 3068.4% |
| October | $66,405 | $68,341 | $78,462.33 | 3154.3% |
| November | $68,253.50 | $70,214 | $80,533.67 | 3240.3% |
| December | $70,102 | $72,087 | $82,605 | 3326.2% |
| All Time | $59,935.25 | $61,785.50 | $71,212.67 | 2853.7% |
| January | $72,550.17 | $75,090.58 | $85,513 | 3446.8% |
| February | $74,998.33 | $78,094.17 | $88,421 | 3567.4% |
| March | $77,446.50 | $81,097.75 | $91,329 | 3688% |
| April | $79,894.67 | $84,101.33 | $94,237 | 3808.6% |
| May | $82,342.83 | $87,104.92 | $97,145 | 3929.2% |
| June | $84,791 | $90,108.50 | $100,053 | 4049.9% |
| July | $87,239.17 | $93,112.08 | $102,961 | 4170.5% |
| August | $89,687.33 | $96,115.67 | $105,869 | 4291.1% |
| September | $92,135.50 | $99,119.25 | $108,777 | 4411.7% |
| October | $94,583.67 | $102,122.83 | $111,685 | 4532.3% |
| November | $97,031.83 | $105,126.42 | $114,593 | 4652.9% |
| December | $99,480 | $108,130 | $117,501 | 4773.5% |
| All Time | $86,015.08 | $91,610.29 | $101,507 | 4110.2% |
| January | $102,603.75 | $110,953.42 | $120,084.17 | 4880.7% |
| February | $105,727.50 | $113,776.83 | $122,667.33 | 4987.8% |
| March | $108,851.25 | $116,600.25 | $125,250.50 | 5095% |
| April | $111,975 | $119,423.67 | $127,833.67 | 5202.1% |
| May | $115,098.75 | $122,247.08 | $130,416.83 | 5309.2% |
| June | $118,222.50 | $125,070.50 | $133,000 | 5416.4% |
| July | $121,346.25 | $127,893.92 | $135,583.17 | 5523.5% |
| August | $124,470 | $130,717.33 | $138,166.33 | 5630.7% |
| September | $127,593.75 | $133,540.75 | $140,749.50 | 5737.8% |
| October | $130,717.50 | $136,364.17 | $143,332.67 | 5844.9% |
| November | $133,841.25 | $139,187.58 | $145,915.83 | 5952.1% |
| December | $136,965 | $142,011 | $148,499 | 6059.2% |
| All Time | $119,784.38 | $126,482.21 | $134,291.58 | 5470% |
Between 2023 and 2050, Ethereum’s price will most likely follow the bullish outlook and aim for the six-digit territory. The lowest price point is $16,092.58, and the highest price of Ether is $145,915.83.
Ethereum Price Analysis: ETH Fundamentals Remain Strong
As explained in a previous article, Ethereum treads in a parallel channel. However, ETH is facing rejection at the channel’s midpoint unlike the expectation of a breakout to the upside. This development comes as BTC hovers around $100,000 without a directional bias. As BTC continues to tread lower, Ethereum and other altcoins are also likely to follow suit.
The rejection has pushed Ethereum closer to the $3,866 support level. A breakdown of this could send ETH down to the channel’s lower limit around $3,700, which is shaky at best. So investors should keep an eye on $3,371, a stable support level.

Interestingly, the network activity and daily active addresses are stable at six-month highs. This shows strength and investor interest.

Fruther supporting a strong fundamental development for ETH is the recent spot ETF inflow. Since Novmeber 22, Ethereum ETF inflows have been positive, indicating a strong demand from institutions.

All in all, the long-term outlook for Ethereum price continues to remain strong, but the short-term outlook remains bearish with price retracing due to volatility.
Source link


Tron’s native cryptocurrency TRX is up by 7% today after founder Justin Sun announced plans to double down on building the meme ecosystem on the blockchain. this announcement was enough to push the Tron price higher with daily trading volumes surging 62% to more than $1.23 billion. Over the last two days. TRX has seen a sharp recovery of 15%, bouncing back from the support of $0.21.
Tron Price Rally to $1 Coming?
As Justin Sun prepares for the comeback of the meme coin ecosystem on the Tron blockchain network, analysts are predicting a Tron price rally to $1 and above. Popular crypto analyst Javon Marks has projected a bullish outlook for TRON (TRX) stating that the altcoin is preparing to hit its logarithmic-measured breakout target at $1.11.

Marks highlighted that TRON price trajectory suggests significant potential for gains, with an estimated 516% upside from current levels required to reach the predicted target. Last week Justin Sun also stated that TRX will hit new all-time highs very soon.
On the other hand, social analytics platform LunarCrush stated that the social and market activity on the Tron blockchain network has surged significantly following the TRX price surge. Tron now accounts for 1.05% of all crypto-related discussions, reflecting heightened community interest. TRON’s robust metrics highlight its growing prominence as both investors and the community focus on its upward momentum.

Tron DAO Meme Coin Frenzy Heating Up
Tron’s meme token ecosystem is experiencing a resurgence, fueled by confidence from Justin Sun, founder of the Tron blockchain. Yesterday alone, 122 new tokens were launched on the SunPump.meme platform, marking the first time in four months that daily launches exceeded 100.
To date, 95,573 tokens have been created, generating 36,374,191 $TRX in fees, equivalent to $5.74 million. Furthermore, the activity on the TRON DAO continues to soar, signaling a strong and growing interest in Tron’s meme token ecosystem.

Commenting on this development, Justin Sun wrote: The first rule of making memes on Tron: I will not personally profit a single cent from memes. Any losses will be fully covered by myself, and all proceeds will be donated.
Getting TRX to Solana
In another announcement, Justin Sun revealed plans to bring TRX, Tron’s native cryptocurrency, to Solana’s blockchain in the coming weeks. Although the announcement lacked specific details or a definitive timeline, it has sparked excitement among both TRX and Solana communities.
Bhushan Akolkar
Bhushan is a FinTech enthusiast with a keen understanding of financial markets. His interest in economics and finance has led him to focus on emerging Blockchain technology and cryptocurrency markets. He is committed to continuous learning and stays motivated by sharing the knowledge he acquires. In his free time, Bhushan enjoys reading thriller fiction novels and occasionally explores his culinary skills.
Disclaimer: The presented content may include the personal opinion of the author and is subject to market condition. Do your market research before investing in cryptocurrencies. The author or the publication does not hold any responsibility for your personal financial loss.
Source link
Executive Director of the Presidential Working Group on Digital Assets Bo Hines has issued a timeline for stablecoin regulation in the US. Hines is predicting a two-month window for legislators to wrap up existing bills for final assent by the President.
Bo Hines Eyes Stablecoin Legislation In The Coming Weeks
American journalist Eleanor Terrett disclosed that Bo Hines has his eyes on May as a tentative date for stablecoin legislation in the US. Hines stated in a panel discussion that stablecoin legislation can be on President Trump’s desk within two months.
The Executive Director shared his predictions at the Digital Asset Summit 2025 in New York. Hines reiterated the government’s stance on digital currencies, particularly stablecoins while reeling out his projection for a possible rollout.
Barring any eventualities, Hines expects President Trump to sign a stablecoin regulation into law in two months. The most plausible bill is Senator Bill Hagerty’s Guiding and Establishing National Innovation for US Stablecoins Act (GENIUS Act).
At the moment, the US Senate Banking Committee has approved the GENIUS Act, setting it up for a full vote on the floor of the House. Experts are tipping the bill to scale through the legislative process citing bipartisan support and the scope of its provision.
The bill will also have to pass through the House of Representatives before final assent by the US President.
Stablecoin Issuers Are Angling For Top Spot In The US
Currently, stablecoin issuers are jostling for places as the US turns its sights toward the industry. US Treasury Secretary Scott Bessent noted that the US is keen on exploring stablecoins to maintain the dollar’s position as the global reserve currency.
“We will keep the US the dominant reserve currency and use stablecoins to do that,” remarked Bessent.
Given the changing stance, experts are tapping XRP’s RLUSD to lead America’s stablecoin charge. On the other hand, Circle is positioning USDC to become the stablecoin of choice by the government. Tether CEO Paulo Ardoino has also indicated a keen interest in playing an increased role in America’s stablecoin ambition.
The OCC has since announced that US banks can dabble in stablecoin transactions as global banks launch stablecoins to get skin in the game.
Aliyu Pokima
Disclaimer: The presented content may include the personal opinion of the author and is subject to market condition. Do your market research before investing in cryptocurrencies. The author or the publication does not hold any responsibility for your personal financial loss.
Source link

Nasdaq has filed Form 19b-4 with the U.S. Securities and Exchange Commission (SEC), seeking approval to list 21Shares’ spot Polkadot ETF. This move would allow investors to gain exposure to Polkadot’s native cryptocurrency, DOT, without directly holding the asset.
Nasdaq Files 19b-4 For 21Shares Polkadot ETF
According to a recent filing, Nasdaq has filed Form 19b-4 for a spot Polkadot ETF on behalf of 21Shares. The proposed ETF will track the spot price of Polkadot’s DOT token, the 27th largest cryptocurrency by market capitalization.
The filing follows 21Shares’ earlier submission of an S-1 amendment, in which the company detailed its plan to provide a regulated investment vehicle for digital asset exposure.
As the sponsor of the fund, 21Shares aims to provide a secure and accessible means for investors to participate in the growth of Polkadot without the need for direct ownership of DOT. In addition to the Polkadot ETF, the company is seeking approval for other ETFs related to digital assets such as Solana and XRP.
This Is A Developing News, Please Check Back For More
Kelvin Munene Murithi
Kelvin is a distinguished writer with expertise in crypto and finance, holding a Bachelor’s degree in Actuarial Science. Known for his incisive analysis and insightful content, he possesses a strong command of English and excels in conducting thorough research and delivering timely cryptocurrency market updates.
Disclaimer: The presented content may include the personal opinion of the author and is subject to market condition. Do your market research before investing in cryptocurrencies. The author or the publication does not hold any responsibility for your personal financial loss.
Source link

Bitcoin Hoarder Metaplanet Issues Fresh Bonds To Increase Holdings to 3,200 BTC

Pi Network coin to $10? 4 catalysts that may make it possible

XRP Jumps as Ripple CEO Brad Garlinghouse Says SEC ‘Case Has Ended’

3 Voting Polls Show Why Ripple’s XRP Price Could Hit $10 Soon

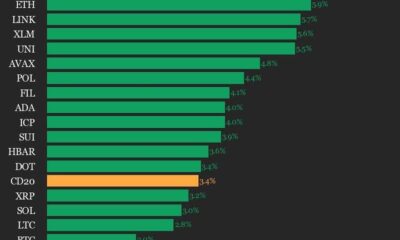
Index Rises 3.4% as All Assets Trade Higher

Sophisticated crypto address poisoning scams drain $1.2M in March
Dogecoin Shark & Whale Population Rises—Price Turnaround Incoming?

ECB Prepping The Ground For Digital Euro Launch

One Indicator Could Soon Signal New Bitcoin Breakout, According to Crypto Analyst

BMT crypto soars nearly 30% a day after Binance listing

EOS Token Spikes 30% as Network Rebrands to ‘Vaulta’

Why Is Tron Price Up 7% Today?
Lessons from the Bybit Hack

North Dakota Senate passes crypto ATM bill limiting daily transactions to $2K

Ethereum To $4,000? Standard Chartered Lowers Expectations


 24/7 Cryptocurrency News4 months ago
Arthur Hayes, Murad’s Prediction For Meme Coins, AI & DeFi Coins For 2025

 Bitcoin2 months ago
Expert Sees Bitcoin Dipping To $50K While Bullish Signs Persist

 24/7 Cryptocurrency News2 months ago
Aptos Leverages Chainlink To Enhance Scalability and Data Access

 Bitcoin4 months ago
Bitcoin Could Rally to $80,000 on the Eve of US Elections

 Altcoins2 months ago
Sonic Now ‘Golden Standard’ of Layer-2s After Scaling Transactions to 16,000+ per Second, Says Andre Cronje

 Bitcoin4 months ago
Institutional Investors Go All In on Crypto as 57% Plan to Boost Allocations as Bull Run Heats Up, Sygnum Survey Reveals

 Opinion4 months ago
Crypto’s Big Trump Gamble Is Risky

 Price analysis4 months ago
Ripple-SEC Case Ends, But These 3 Rivals Could Jump 500x

✓ Share: