
ETH
Ethereum Price Declines Again: Will the Downtrend Continue?

Ethereum price failed to continue higher above the $2,880 resistance. ETH is now moving lower and might slip further toward the $2,320 support.
- Ethereum started a fresh decline below the $2,700 level.
- The price is trading below $2,700 and the 100-hourly Simple Moving Average.
- There is a connecting bearish trend line forming with resistance at $2,680 on the hourly chart of ETH/USD (data feed via Kraken).
- The pair could start a fresh decline if it stays below the $2,700 level.
Ethereum Price Recovery Fades
Ethereum price started a recovery wave above the $2,650 level, like Bitcoin. ETH was able to surpass the $2,700 and $2,750 resistance levels to move into a short-term positive zone.
However, the bears were active above $2,800 and the price started another decline. There was a move below the $2,720 and $2,700 levels. The price dipped and tested the 50% Fib retracement level of the upward move from the $2,127 swing low to the $2,923 high.
Ethereum price is now trading below $2,700 and the 100-hourly Simple Moving Average. There is also a connecting bearish trend line forming with resistance at $2,680 on the hourly chart of ETH/USD.
On the upside, the price seems to be facing hurdles near the $2,680 level and the 100-hourly Simple Moving Average. The first major resistance is near the $2,700 level. The main resistance is now forming near $2,880 or $2,920. A clear move above the $2,920 resistance might send the price toward the $3,000 resistance.

An upside break above the $3,000 resistance might call for more gains in the coming sessions. In the stated case, Ether could rise toward the $3,050 resistance zone or even $3,120 in the near term.
More Losses In ETH?
If Ethereum fails to clear the $2,700 resistance, it could start another decline. Initial support on the downside is near the $2,525 level. The first major support sits near the $2,440 zone.
A clear move below the $2,440 support might push the price toward the $2,320 support. Any more losses might send the price toward the $2,250 support level in the near term. The next key support sits at $2,120.
Technical Indicators
Hourly MACD – The MACD for ETH/USD is gaining momentum in the bearish zone.
Hourly RSI – The RSI for ETH/USD is now below the 50 zone.
Major Support Level – $2,525
Major Resistance Level – $2,440
Source link


Tron (TRX) founder Justin Sun has staked $100 million worth of Ethereum (ETH), according to the blockchain analytics platform Arkham.
Arkham notes that Sun’s staked ETH will yield $3 million worth of Ethereum per year in passive income.
In addition to staking ETH, Sun also teased that Tron’s native asset, TRX, would soon be available on the Ethereum competitor Solana (SOL).
Sun, a polarizing figure in the crypto community, says it is currently “Tron meme szn [season].” He also notes that the issuance of top stablecoin USDT on Tron recently reached a new all-time high of $64.7 billion.
The U.S. Securities and Exchange Commission (SEC) recently paused its civil case against Sun. According to recent court filings, the Tron founder and the regulatory agency jointly asked United States District Judge Edgardo Ramos if they could “move to stay [the] case to allow the parties to explore a potential resolution.” Ramos granted the application a day later.
In 2023, the SEC accused Sun – who went on to invest millions of dollars into President Donald Trump’s decentralized finance platform World Liberty Financial – and his crypto firms of fraud, selling unregistered securities and manipulating the price of the digital asset TRX via wash trading.
TRX, a layer-1 asset, is trading at $0.23 at time of writing. The 10th-ranked crypto asset by market cap is down nearly 1% in the past day but up nearly 3% in the past week.
ETH is trading at $2,033 at time of writing. The second-ranked crypto asset by market cap is up nearly 7% in the past 24 hours and more than 8% in the past seven days.
Follow us on X, Facebook and Telegram
Don’t Miss a Beat – Subscribe to get email alerts delivered directly to your inbox
Check Price Action
Surf The Daily Hodl Mix
 

Disclaimer: Opinions expressed at The Daily Hodl are not investment advice. Investors should do their due diligence before making any high-risk investments in Bitcoin, cryptocurrency or digital assets. Please be advised that your transfers and trades are at your own risk, and any losses you may incur are your responsibility. The Daily Hodl does not recommend the buying or selling of any cryptocurrencies or digital assets, nor is The Daily Hodl an investment advisor. Please note that The Daily Hodl participates in affiliate marketing.
Featured Image: Shutterstock/Design Projects
Source link

Reason to trust
![]()
Strict editorial policy that focuses on accuracy, relevance, and impartiality
Created by industry experts and meticulously reviewed
The highest standards in reporting and publishing
Strict editorial policy that focuses on accuracy, relevance, and impartiality
Morbi pretium leo et nisl aliquam mollis. Quisque arcu lorem, ultricies quis pellentesque nec, ullamcorper eu odio.
Ethereum, like the broader crypto market, has experienced a sharp drop in price in recent weeks. From a high of $3,352 at the start of 2025, Ether now trades around $1,800 and $1,900, reflecting a sharp drop to the world’s second-biggest crypto by market cap. Looking at Ether’s bigger picture, it’s down 47% from last year’s value.
Related Reading
If we go by the latest analyses and observations from commentators, Ether’s price correction will likely be extended. The altcoin is facing a huge bearish wave, with plenty of market factors undermining its price performance.
One significant factor is Standard Chartered’s recent decision to cut its price prediction by 60%, confirming market expectations.
News: Standard Chartered slashes ETH price target!
The bank cuts its 2025 ETH forecast from $10K to $4K, blaming Layer-2 networks like Base, which they say has drained $50B from Ethereum’s market value.#Ethereum #ETH #Crypto #Layer2 #Base #Blockchain
— Andres Meneses (@andreswifitv) March 17, 2025

Ethereum Faces A Descending Channel
Ethereum is currently in a price slump, and many experts expect a much deeper dive in the next few weeks. Ether’s price is currently floating above the $1,900 level as it continues its bearish price movements.
Analysts use the MACD indicator to verify and confirm the asset’s bearish sentiment. Also, the asset’s moving averages suggest a neutral trend and possible price consolidation.
Ethereum (ETH) remains in the correction zone today, trading around $1,874. The price continues to move in a descending channel, indicating a possible continuation of consolidation. Moving averages confirm the neutral trend: the price is holding below the 50-day and 200-day MA,… pic.twitter.com/R3vNqFBDkZ
— LVelarde (@0xvelarde) March 17, 2025
According to a crypto user named “LVelarde,” Ether’s price continues to follow the descending channel, suggesting price consolidation. The asset’s price is consolidating below its 5-day and 200-day moving averages, with traders looking for possible rejection or breakout. Since it fell below $2k, sentiments have been generally bearish, with many questioning its future price trends.
Standard Chartered Cuts Price Estimates For Ethereum
Even some of the biggest banks, like Standard Chartered Bank, are lowering their expectations of Ethereum. From a high of $10,000, the bank is reducing its price target to just $4,000, explaining that the Layer 2s are impacting its bottom line.
The bank added that changes and improvements to the blockchain affected its overall value, like its shift to the proof-of-stake and scaling roadmap.
Standard Chartered used Coinbase’s Base Layer 2 as an example, suggesting that the project has cost Ethereum $50 billion from its market cap. According to Geoff Kendrick, Standard Chartered analyst, Ethereum’s losses will continue as Base’s dominance in the industry continues.
Kendrick calls this the blockchain’s “midlife crisis”, adding that Ethereum’s chain has become a commodity with its Layer 2 framework.
Related Reading
Things Ethereum Can Do To Address Its Slide
According to Kendrick, Ethereum can address its downturn in two ways. First, it can leverage its security-based dominance in the context of the tokenization of real-world assets (RWA). If Ethereum focuses on security, it can maintain its 80% market share.
Second, it can charge taxes for its Layer 2s, but it’s highly unlikely. Kendrick expects Ethereum to continue its underperformance in the short term.
Featured image from Bloomberg, chart from TradingView
Source link

Reason to trust
![]()
Strict editorial policy that focuses on accuracy, relevance, and impartiality
Created by industry experts and meticulously reviewed
The highest standards in reporting and publishing
Strict editorial policy that focuses on accuracy, relevance, and impartiality
Morbi pretium leo et nisl aliquam mollis. Quisque arcu lorem, ultricies quis pellentesque nec, ullamcorper eu odio.
Ethereum is currently consolidating below the $2,000 mark, trading within a narrow range between $1,800 and $1,900 as market uncertainty persists. Bulls have lost control, and speculation about a potential continuation of the bear trend is growing among analysts and investors. With macroeconomic instability, rising trade war fears, and erratic policy decisions from US President Trump, both crypto and U.S. stock markets remain highly volatile, adding to Ethereum’s struggles.
Related Reading
To highlight Ethereum’s fragile position, top analyst Mister Crypto shared a technical analysis revealing that ETH is currently testing a 5-year-long trendline, a crucial level that has historically acted as strong support during major corrections. If Ethereum fails to hold this trendline, the market could see a deeper decline, reinforcing bearish sentiment and potentially pushing ETH toward lower demand zones.
On the other hand, if Ethereum holds above this trendline, it could trigger a strong recovery, offering hope for bulls looking for a reversal. Over the coming days, Ethereum’s reaction at this level will determine its next major move, making this a pivotal moment for the second-largest cryptocurrency.
Ethereum Faces Crucial Test as It Trades Below Multi-Year Support
Ethereum has been under massive selling pressure, driven by macroeconomic uncertainty and trade war fears that have rattled both the crypto and U.S. stock markets. With risk assets struggling to find stability, ETH has lost key price levels and now trades below a critical multi-year support around $2,000, which could flip into strong resistance if bulls fail to reclaim it.
Related Reading
Analysts warn that Ethereum’s downtrend may continue as broader economic conditions show no signs of improvement. Investors remain cautious, with global trade tensions, inflation concerns, and U.S. regulatory uncertainties weighing on market sentiment. However, despite these bearish factors, some experts believe Ethereum could be preparing for a long-term recovery.
Mister Crypto’s technical analysis on X highlights that Ethereum is currently testing a 5-year-long support trendline, an even stronger level than the $2,000 demand zone. According to his insights, this trendline has historically held during major corrections and served as a key turning point for bullish reversals. If Ethereum maintains support above this level, it could trigger a significant recovery rally, pushing ETH back above $2,000 and beyond.
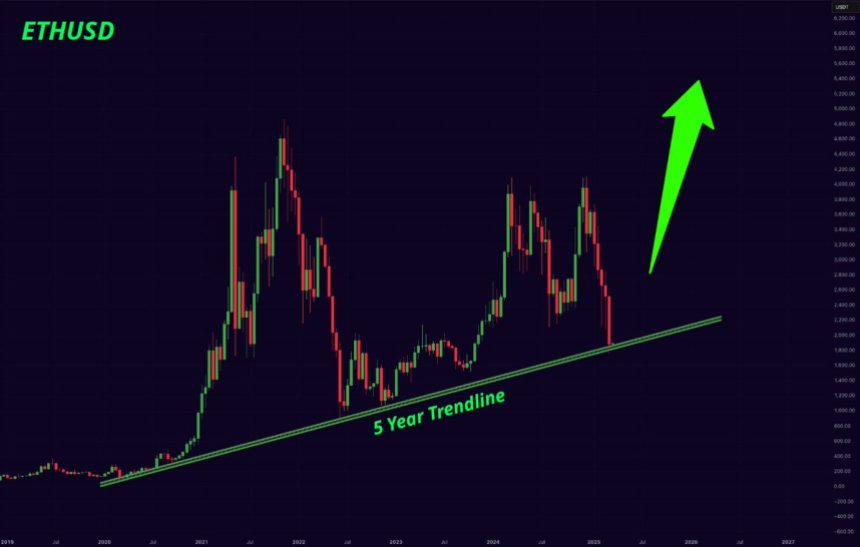
Over the coming weeks, Ethereum’s price reaction at this crucial trendline will determine whether a reversal is on the horizon or if the bearish trend will extend further.
ETH Bulls And Bears Battle For Control
Ethereum is now at a crucial crossroads, with bulls struggling to reclaim the $2,000 mark, while bears fail to push ETH below $1,800. This prolonged consolidation phase has left investors uncertain about the next major move for ETH.
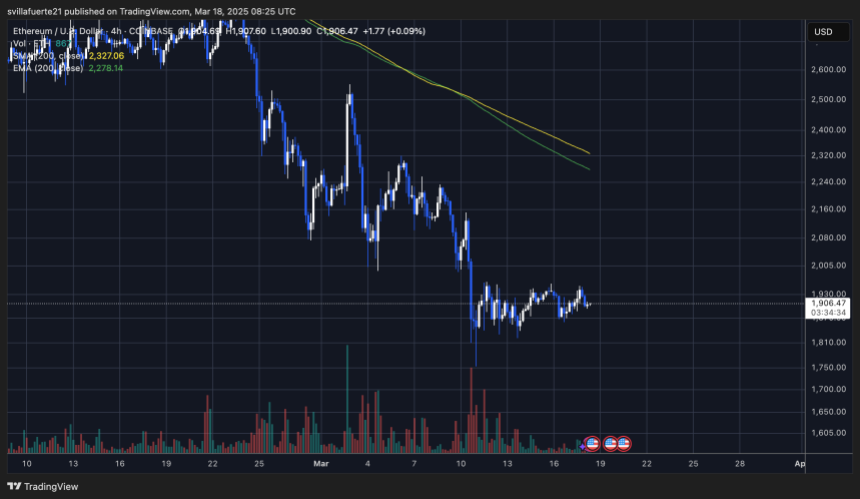
For a recovery rally to take shape, bulls must reclaim the $2,300 level, which aligns with the 4-hour 200 moving average (MA) and exponential moving average (EMA). Breaking above this level would signal a shift in momentum and pave the way for further upside toward key resistance zones.
However, failure to reclaim the $2,000 mark and hold above crucial moving averages could trigger another wave of selling pressure. A decisive drop below $1,800 would put Ethereum in dangerous territory, opening the door for a potential retest of lower demand zones around $1,600-$1,700.
Related Reading
With macroeconomic uncertainty and market-wide volatility still in play, ETH traders should watch for a breakout or breakdown from the current range, as the next few sessions will determine the short-term trend for Ethereum.
Featured image from Dall-E, chart from TradingView
Source link

SUI Drops 5.1% as Index Trades Lower From Thursday

South Korea to block non-compliant crypto exchanges
1.5M Holders, 10M Blocks on Shibarium

Pakistan Plans To Legalise Bitcoin And Crypto

‘This Is a Good Sign’: Crypto Analyst Says Bitcoin at a Key Inflection Point, Unveils Breakout Targets for BTC

Meteora shares two proposals on MET token allocation

Trump Aides Look To Reform USAID With Blockchain For ‘Transparency’: Report

Ethereum Price Eyes 50% Drop Amid Heavy ETH Whale Profit Booking
Polymarket is Over 90% Accurate in Predicting World Events: Research

Bad news Bitcoin bulls, the long-hoped-for retail is already here: CryptoQuant
Top 6 Important Fed Decisions To Know After SEC Drops Ripple Lawsuit Appeal

Leaders In Adoption And Innovation

Trader Issues Urgent XRP Alert, Says the Top-Five Altcoin at Risk of Sharp Correction – Here’s His Target

This coin could see a $10b market cap and double-digit price before SHIB gains its 2021 mojo

Can a Meme Coin Fund the Future of Scientific Research?


 24/7 Cryptocurrency News4 months ago
Arthur Hayes, Murad’s Prediction For Meme Coins, AI & DeFi Coins For 2025

 Bitcoin2 months ago
Expert Sees Bitcoin Dipping To $50K While Bullish Signs Persist

 24/7 Cryptocurrency News2 months ago
Aptos Leverages Chainlink To Enhance Scalability and Data Access

 Bitcoin5 months ago
Bitcoin Could Rally to $80,000 on the Eve of US Elections

 Altcoins2 months ago
Sonic Now ‘Golden Standard’ of Layer-2s After Scaling Transactions to 16,000+ per Second, Says Andre Cronje

 Bitcoin4 months ago
Institutional Investors Go All In on Crypto as 57% Plan to Boost Allocations as Bull Run Heats Up, Sygnum Survey Reveals

 Opinion5 months ago
Crypto’s Big Trump Gamble Is Risky

 Price analysis5 months ago
Ripple-SEC Case Ends, But These 3 Rivals Could Jump 500x
