
Uncategorized
GM,
Here is my 15 year “seal of approval” from a popular LLM.
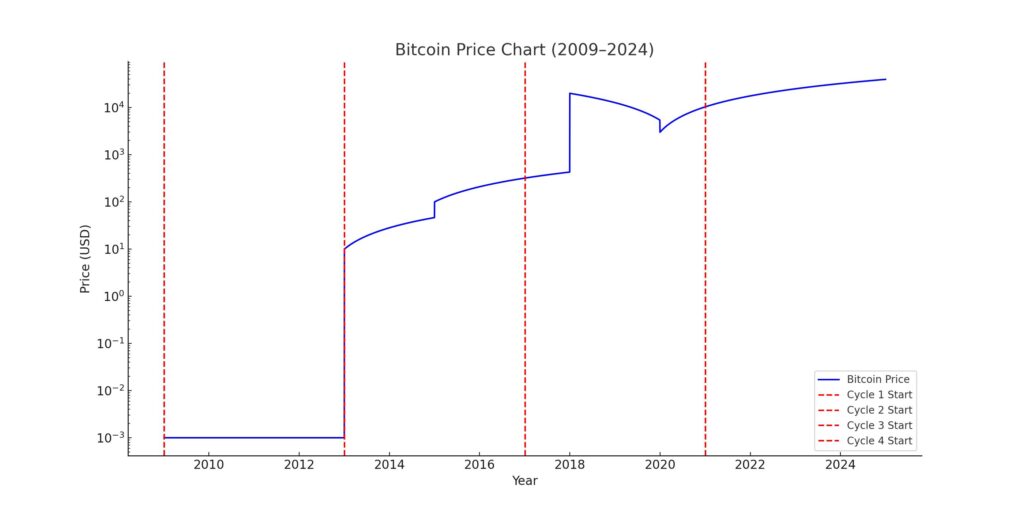
Bitcoin’s price history exhibits notable cyclical patterns, often aligned with its approximately four-year halving events. Halving’s reduce the reward for mining new blocks by half, effectively decreasing the rate at which new bitcoins are introduced into circulation. This mechanism has historically influenced Bitcoin’s supply-demand dynamics, contributing to its price cycles.
Bitcoin’s Price Evolution and 4-Year Cycles:
- 2009–2012: Genesis and Early Growth
- 2009: Bitcoin was introduced by Satoshi Nakamoto, with the genesis block mined in January. Initially, Bitcoin had negligible monetary value.
- 2010: The first recorded Bitcoin transaction established its value at $0.00099 per coin.
- 2011: Bitcoin reached parity with the U.S. dollar in February, later peaking at around $30 in June.
- 2012: The first halving event occurred in November, reducing the block reward from 50 BTC to 25 BTC.
- 2013–2016: First Major Bull and Bear Cycle
- 2013: Bitcoin’s price surged to over $1,100 in December, marking its first significant bull run.
- 2014–2015: A bear market ensued, with prices declining by approximately 84% from the peak, bottoming around $150.
- 2016: The second halving in July further reduced the block reward to 12.5 BTC.
- 2017–2020: Renewed Surge and Correction
- 2017: Bitcoin experienced a meteoric rise, reaching an all-time high near $20,000 in December.
- 2018: The market corrected sharply, with Bitcoin’s price dropping about 84% to lows around $3,200.
- 2020: The third halving in May decreased the block reward to 6.25 BTC.
- 2021–2024: Recent Trends and Projections
- 2021: Bitcoin achieved a new all-time high of approximately $68,789 in November.
- 2022: A significant downturn followed, with prices falling to around $15,495 by November.
- 2023: The market showed recovery, with Bitcoin’s price reaching $42,265 by December 31.
- 2024: The fourth halving occurred in April, reducing the block reward to 3.125 BTC.
Visualizing the 4-Year Cycles:
To illustrate these cycles, analysts often use logarithmic charts with vertical lines marking each halving event, effectively segmenting the chart into four-year intervals. These visualizations highlight the correlation between halving events and subsequent price movements. For example, a chart from TradingView delineates these cycles, showing price trends relative to each halving.
Understanding the Impact of Halving Events:
Each halving reduces the rate at which new bitcoins are generated, tightening supply. Historically, this scarcity effect, combined with sustained or increasing demand, has led to substantial price appreciation in the periods following each halving. However, these bullish phases are typically followed by corrections, leading to the observed cyclical pattern in Bitcoin’s price history.
Conclusion:
Bitcoin’s approximately four-year cycles, influenced by its halving events, have played a significant role in its price dynamics. Understanding these cycles provides valuable insights into Bitcoin’s historical performance and potential future trends.


Solana’s native token SOL (SOL) failed to maintain its bullish momentum after reaching the $134 level on April 14, but an assortment of data points suggest that the altcoin’s rally is not over. SOL price is currently 57% down from its all-time high, partially due to a sharp decline in its DApps activity, but some analysts cite the growth in deposits on the Solana network as a catalyst for sustained price upside in the short term.

Solana has established itself as the second-largest blockchain by total value locked (TVL), with $6.9 billion. After gaining 12% over the seven days ending April 16, Solana has pulled ahead of competitors such as Tron, Base, and Berachain. Positive signs include a 30% increase in deposits on Sanctum, a liquid staking application, and 20% growth on Jito and Jupiter.
Solana’s DEX volume surpasses Ethereum layer-2s
One could argue that Solana’s TVL roughly matches the Ethereum layer-2 ecosystem in deposits. However, this comparison overlooks Solana’s strong position in decentralized exchange (DEX) volumes. For example, in the seven days ending April 16, trading activity on Solana DApps totaled $15.8 billion, exceeding the combined volume of Ethereum scaling solutions by more than 50% during the same period.

Solana reclaimed the top spot in DEX activity, surpassing Ethereum after a 16% gain over seven days. This was supported by a 44% increase in volume on Pump-fun and a 28% rise on Raydium. In contrast, volumes declined on the three largest Ethereum DApps—Uniswap, Fluid, and Curve Finance. A similar trend occurred on BNB Chain, where PancakeSwap, Four-Meme, and DODO saw reduced volumes compared to the previous week.
It would be unfair to measure Solana’s growth only by DEX performance, as other DApps handle much smaller volumes. For example, Ondo Finance tokenized a total of $250 million worth of assets on the Solana network. Meanwhile, Exponent, a yield farm protocol, doubled its TVL over the past 30 days. Similarly, the yield aggregator platform Synatra experienced a 43% jump in TVL during the past week.

Analysts are confident that a Solana spot exchange-traded fund (ETF) will be approved in the United States in 2025. However, expectations for significant inflows are limited due to a general lack of interest from institutional investors and the recent poor performance of similar Ethereum ETF instruments. If the spot ETF is approved, it could strengthen Solana’s presence—especially if the US government’s Digital Asset Stockpile plans come to fruition.
Related: Real estate fintech Janover doubles Solana holdings with $10.5M buy
Investors are eagerly awaiting the full audit of US federal agencies’ crypto holdings, initially expected by April 7. However, after missing this deadline, some journalists suggest that the executive order signed on March 7 did not require the findings to be made public. Regardless of whether SOL appears on that list, there are currently no plans from the government to acquire cryptocurrencies other than Bitcoin (BTC).
Currently, there are few catalysts to justify a rally to $180, a level last seen 45 days ago on March 2. Without external factors causing a large influx of new participants into the crypto ecosystem, the increase in TVL and DEX market share alone is unlikely to push SOL’s price to outperform the broader market.
This article is for general information purposes and is not intended to be and should not be taken as legal or investment advice. The views, thoughts, and opinions expressed here are the author’s alone and do not necessarily reflect or represent the views and opinions of Cointelegraph.
Local governments in China are reportedly seeking ways to offload seized crypto while facing challenges due to the country’s ban on crypto trading and exchanges. The lack of rules around how authorities should handle seized crypto has spawned “inconsistent and opaque approaches” that some fear could foster corruption, lawyers told Reuters for an April 16 report. Chinese local governments are using private companies to sell seized cryptocurrencies in offshore markets in exchange for cash to replenish public coffers, Reuters reported, citing transaction and court documents. The local governments reportedly held approximately 15,000 Bitcoin (BTC) worth $1.4 billion at the end of 2023, and the sales have been a significant source of income. China holds an estimated 194,000 BTC worth approximately $16 billion and is the second largest nation Bitcoin holder behind the US, according to Bitbo. Zhongnan University of Economics and Law professor Chen Shi told Reuters that these sales are a “makeshift solution that, strictly speaking, is not fully in line with China’s current ban on crypto trading.” Countries and governments that hold BTC. Source: Bitbo The issue has been exacerbated by a rise in crypto-related crime in China, ranging from online fraud to money laundering to illegal gambling. Additionally, the state sued more than 3,000 people involved in crypto-related money laundering in 2024. Shenzhen-based lawyer Guo Zhihao opined that the central bank is better positioned to deal with seized digital assets and should either sell them overseas or build a crypto reserve. Ru Haiyang, co-CEO at Hong Kong crypto exchange HashKey, echoed the suggestion saying that China may want to keep forfeited Bitcoin as a strategic reserve as US President Donald Trump is doing. Related: Bitcoin rebounds as traders spot China ‘weaker yuan’ chart, but US trade war caps $80K BTC rally Creating a crypto sovereign fund in Hong Kong, where crypto trading is legal, has also been proposed. This issue has gained attention amid rising US-China trade tensions and Trump’s plans to regulate stablecoins and foster growth and innovation in the crypto industry. Several industry observers have suggested that China’s tariff response could result in a devaluation of the local currency, which may result in a flight to crypto. Magazine: Illegal arcade disguised as … a fake Bitcoin mine? Soldier scams in China: Asia Express CleanSpark will start selling a portion of the Bitcoin earned from its mining operations each month in a bid to become financially self-sufficient, the US Bitcoin miner said on April 15. In addition, CleanSpark secured a $200 million credit facility backed by Bitcoin (BTC) through an agreement with Coinbase Prime, the institutional brokerage division of the crypto exchange, according to a statement. Together, the Bitcoin sales and credit line mean CleanSpark has “achieved escape velocity — the ability to self-fund operations, augment our bitcoin treasury, and contribute to expansion capital through operational cash flow,” Zach Bradford, CEO of CleanSpark, said. CleanSpark has opened an institutional Bitcoin trading desk to facilitate the cryptocurrency sales, it added. Crypto mining stocks are down sharply in 2025. Source: Morningstar Related: Bitdeer turns to self-mining Bitcoin, US operations amid tariff tumult — Report The Bitcoin miner’s emphasis on self-funding comes as mining stocks reel from across-the-board selloffs in the first quarter of 2025. Shares of CoinShares Crypto Miners ETF (WGMI) — a publicly traded fund tracking a diverse basket of Bitcoin mining stocks — are down more than 40% since the start of the year, according to data from Morningstar. “[W]e believe this is the right time to evolve from a nearly 100% hold strategy adopted in mid-2023 and move back using a portion of our monthly production to support operations,” Bradford said. Cheaper stock prices effectively increase Bitcoin miners’ cost of capital and can potentially cause creditors to demand faster loan repayments. Analysts at JP Morgan attributed the downturn to eroding cryptocurrency prices, which added pressure to business models already strained by the Bitcoin network’s April 2024 halving. Halvings occur roughly every four years when the Bitcoin network automatically cuts mining rewards in half. Price per Bitcoin versus network hashrate. Source: JPMorgan In April, pressure on mining stocks worsened when US President Donald Trump announced plans for sweeping tariffs on US imports. US Bitcoin miners are especially vulnerable to trade wars because they rely on specialized mining hardware, often sourced from foreign manufacturers. Bradford said he expects CleanSpark’s financial self-sufficiency to differentiate it from peers “who continue to rely on equity dilution to fund operating costs or increased leverage to grow their Bitcoin reserves.” Other miners are taking similarly aggressive measures to adapt to the changing market. Bitdeer, a Singapore-based crypto miner, has reportedly touted plans to start manufacturing mining hardware in the United States to mitigate the impact of Trump’s planned import tariffs. Magazine: Illegal arcade disguised as … a fake Bitcoin mine? Soldier scams in China: Asia Express Arthur Hayes, Murad’s Prediction For Meme Coins, AI & DeFi Coins For 2025 Expert Sees Bitcoin Dipping To $50K While Bullish Signs Persist Aptos Leverages Chainlink To Enhance Scalability and Data Access Bitcoin Could Rally to $80,000 on the Eve of US Elections Crypto’s Big Trump Gamble Is Risky Institutional Investors Go All In on Crypto as 57% Plan to Boost Allocations as Bull Run Heats Up, Sygnum Survey Reveals Sonic Now ‘Golden Standard’ of Layer-2s After Scaling Transactions to 16,000+ per Second, Says Andre Cronje 3 Voting Polls Show Why Ripple’s XRP Price Could Hit $10 Soon
Source link 
China crypto reserve floated as solution
Source link 
Navigating market volatility
Source link 
Now On Sale For $70,000: The World’s First Factory Ready Open-Source Humanoid Robot

What Next for ETH as Traders Swap $86M into Solana DeFi protocols ?

Why Did Bitcoin Price (BTC) Fall on Wednesday Afternoon

Solana price is up 36% from its crypto market crash lows — Is $180 SOL the next stop?

Solana Retests Bearish Breakout Zone – $65 Target Still In Play?

How Expanding Global Liquidity Could Drive Bitcoin Price To New All-Time Highs

Apple Delists 14 Crypto Apps in South Korea Including KuCoin and MEXC Exchanges Amid Regulatory Crackdown

Athens Exchange Group eyes first onchain order book via Sui

Futureverse Acquires Candy Digital, Taps DC Comics and Netflix IP to Boost Metaverse Strategy
![]()
Court Grants Ripple And SEC’s Joint Motion To Suspend Appeal

AVAX Falls 2.1% as Nearly All Assets Trade Lower

What is a VTuber, and how do you become one in 2025?

Top Expert’s Update Sets $10 Target

How Academia Interacts With The Bitcoin Ecosystem

AB DAO and Bitget Launch Dual Reward Campaign, Distributing $2.6M Worth of $AB Globally

Arthur Hayes, Murad’s Prediction For Meme Coins, AI & DeFi Coins For 2025

Expert Sees Bitcoin Dipping To $50K While Bullish Signs Persist

Aptos Leverages Chainlink To Enhance Scalability and Data Access

Bitcoin Could Rally to $80,000 on the Eve of US Elections

Crypto’s Big Trump Gamble Is Risky

Institutional Investors Go All In on Crypto as 57% Plan to Boost Allocations as Bull Run Heats Up, Sygnum Survey Reveals

Sonic Now ‘Golden Standard’ of Layer-2s After Scaling Transactions to 16,000+ per Second, Says Andre Cronje

3 Voting Polls Show Why Ripple’s XRP Price Could Hit $10 Soon

Ripple-SEC Case Ends, But These 3 Rivals Could Jump 500x

Has The Bitcoin Price Already Peaked?

The Future of Bitcoin: Scaling, Institutional Adoption, and Strategic Reserves with Rich Rines

A16z-backed Espresso announces mainnet launch of core product

Xmas Altcoin Rally Insights by BNM Agent I

Blockchain groups challenge new broker reporting rule

I’m Grateful for Trump’s Embrace of Bitcoin


