
Cryptocurrency Market News
How High Can It Go?

Solana (SOL) has delivered a dramatic shift in market structure, breaking above a descending parallel channel that had dominated its price action for several weeks. Ali Martinez (@ali_charts), who shared the attached four-hour chart, suggests that this breakout could position the token for a potential climb toward $213.
Solana Bulls Regain Momentum
The chart, which spans from January into early March, shows a steadily declining pattern where price repeatedly tested and respected both the upper and lower boundaries of the channel before the latest bullish push propelled SOL beyond the channel’s resistance.
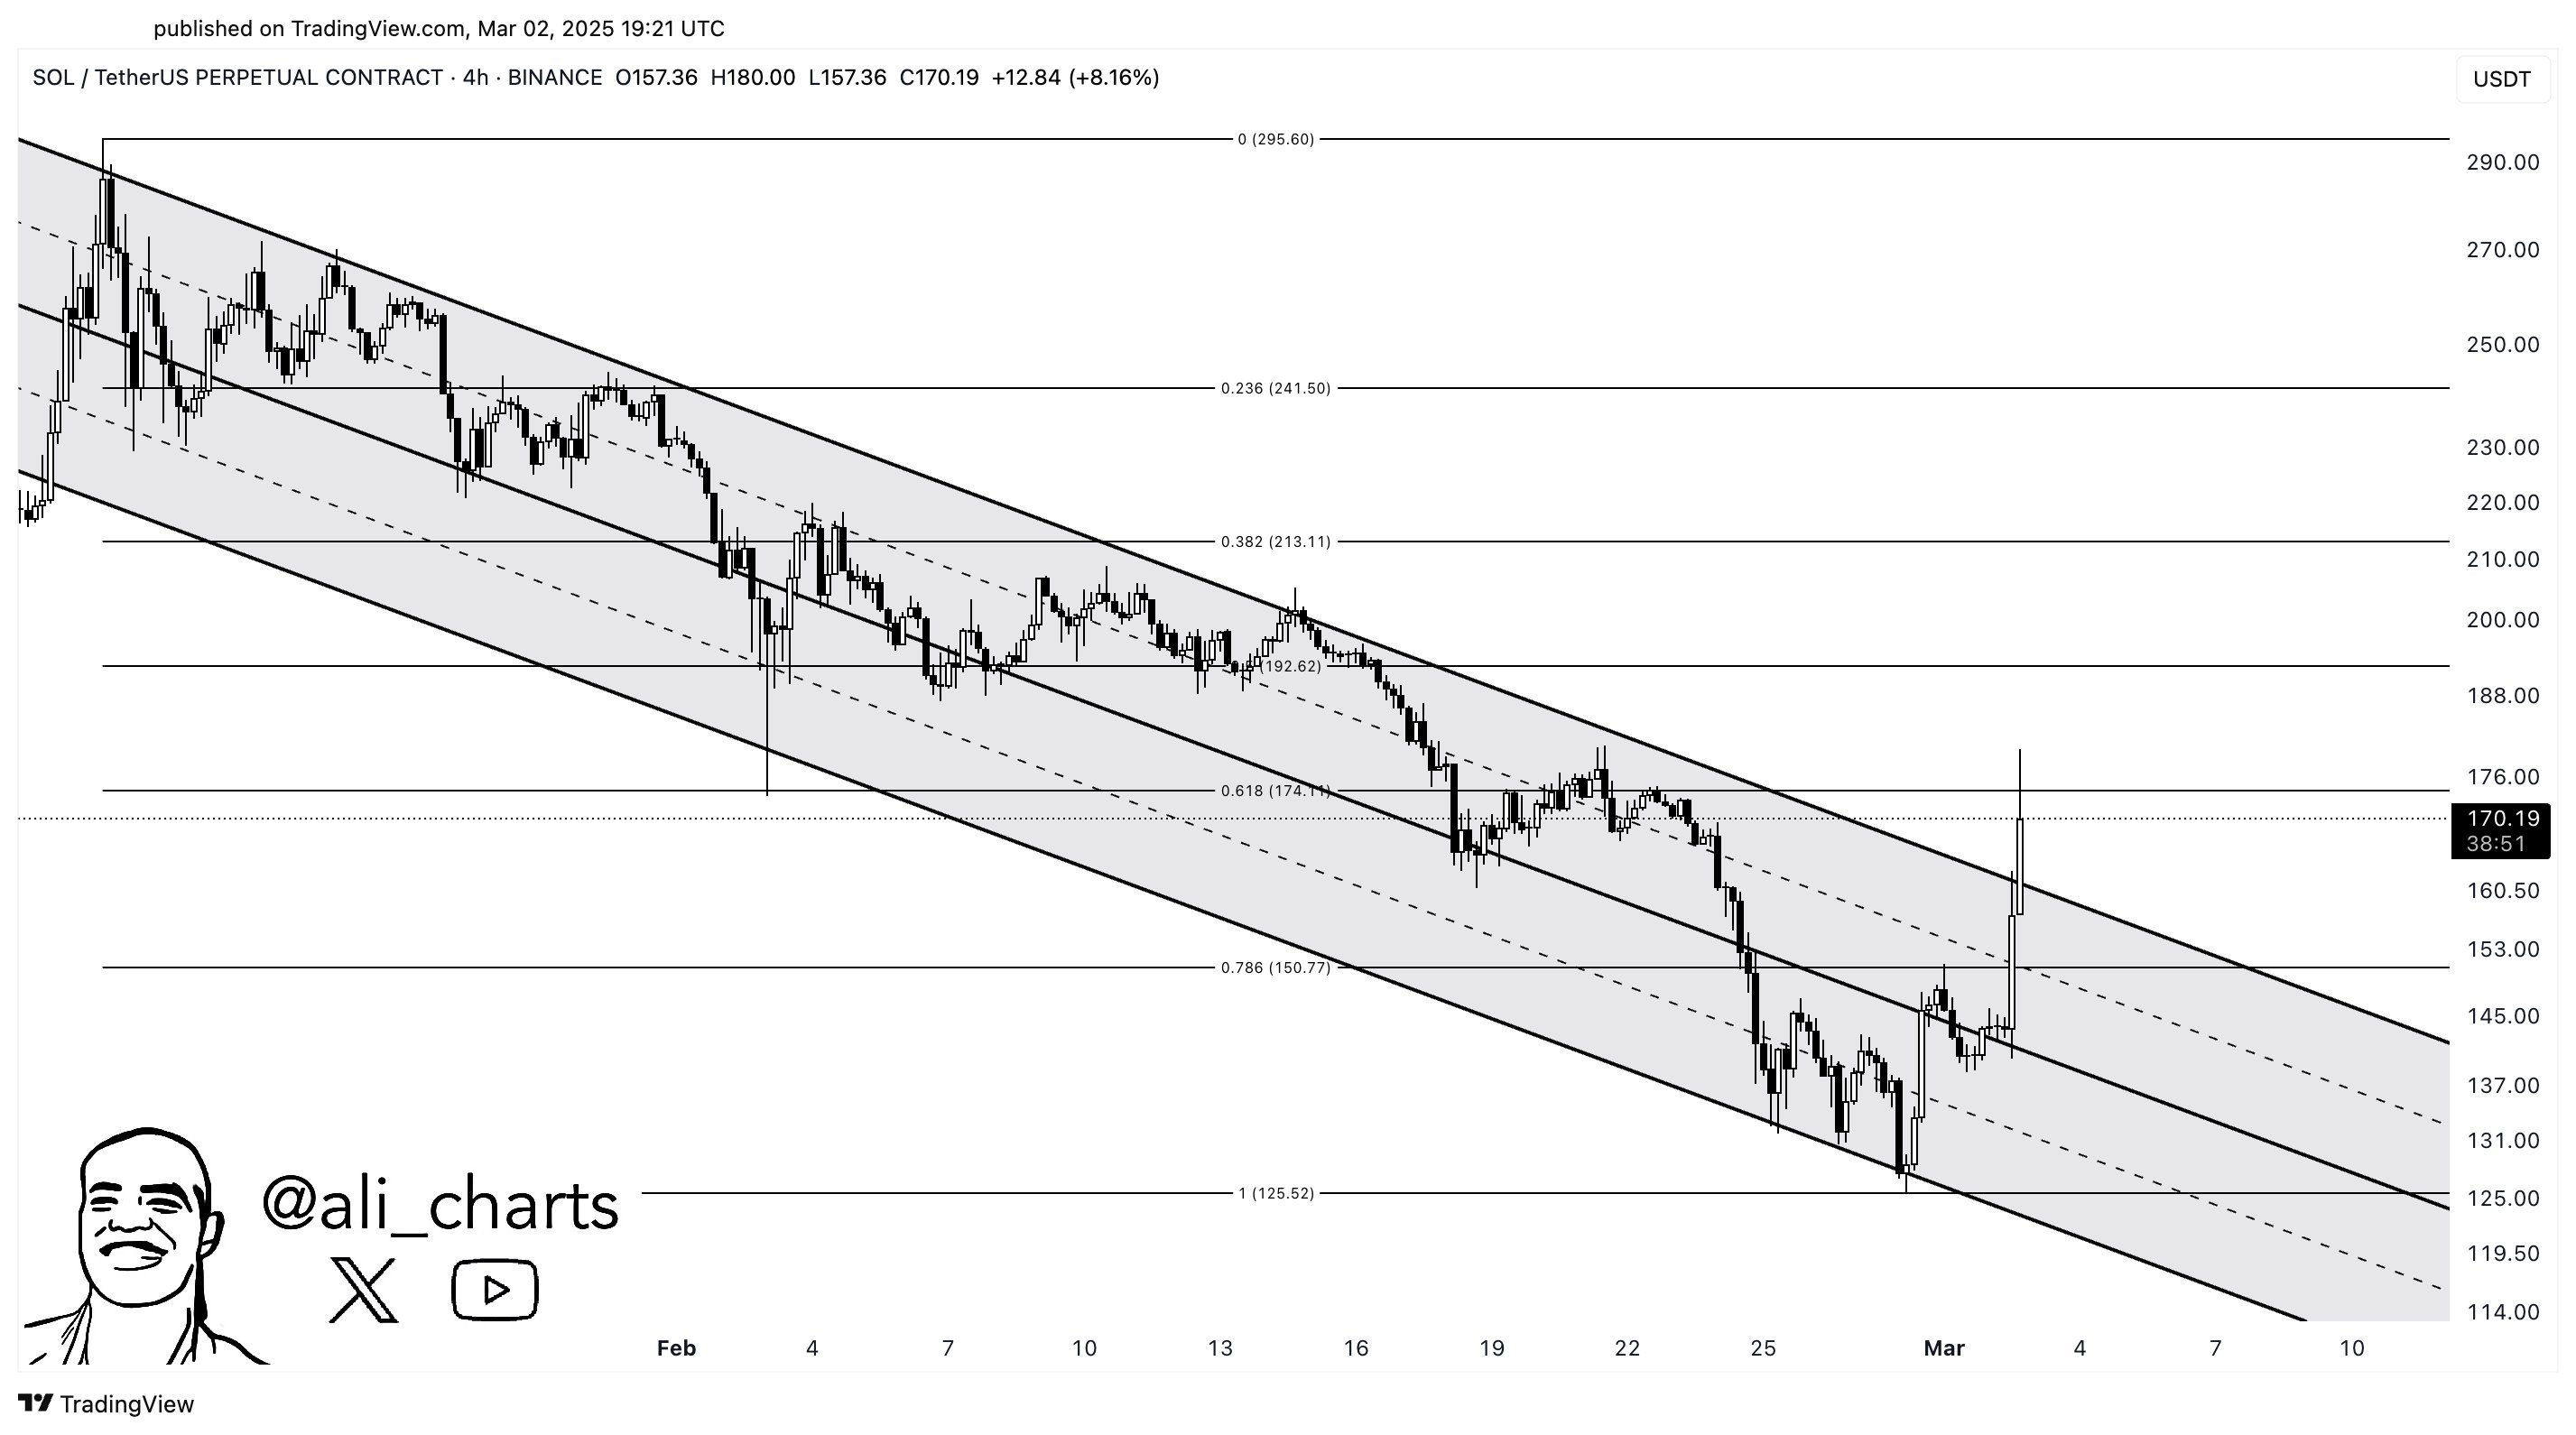
The descending parallel channel highlighted in Martinez’s analysis is visually evident from a series of lower highs and lower lows, forming a consistent downward slope. Each brief recovery in previous weeks failed to clear the channel’s midline, reinforcing bearish pressure. However, once SOL’s price managed to rise above this midline, bullish momentum began to build, culminating in a decisive move through the upper boundary. This kind of channel breakout often suggests that sellers have been exhausted, allowing buyers to take control of the market.
Related Reading
Notably, the breakout comes with two major catalysts for Solana. First, the massive Solana unlock by the FTX estate is done (March 1). Second, yesterday, US President Donald Trump announced the inclusion of Bitcoin, Ethereum, XRP, Cardano and Solana in the United States’ Strategic Crypto Reserve.
One of the most critical elements in Martinez’s forecast is the $213 target, which is derived from the channel’s height from the breakout point in combination with 0.382 Fibonacci retracement level. Currently, in the aftermath of a breakout, a retest of the broken resistance is taking place —to turn it into support. The $160-165 zone is the area where buyers might attempt to defend the token’s new uptrend.
To the upside, the key Fibonacci retracement levels above Solana’s current price of $170.19 are $174.11 (0.618), $192.62 (0.5), $213.11 (0.382), and $241.50 (0.236), with the full retracement level at $295.60 (0.0) serving as the ultimate bullish target based on the chart’s structure.
Related Reading
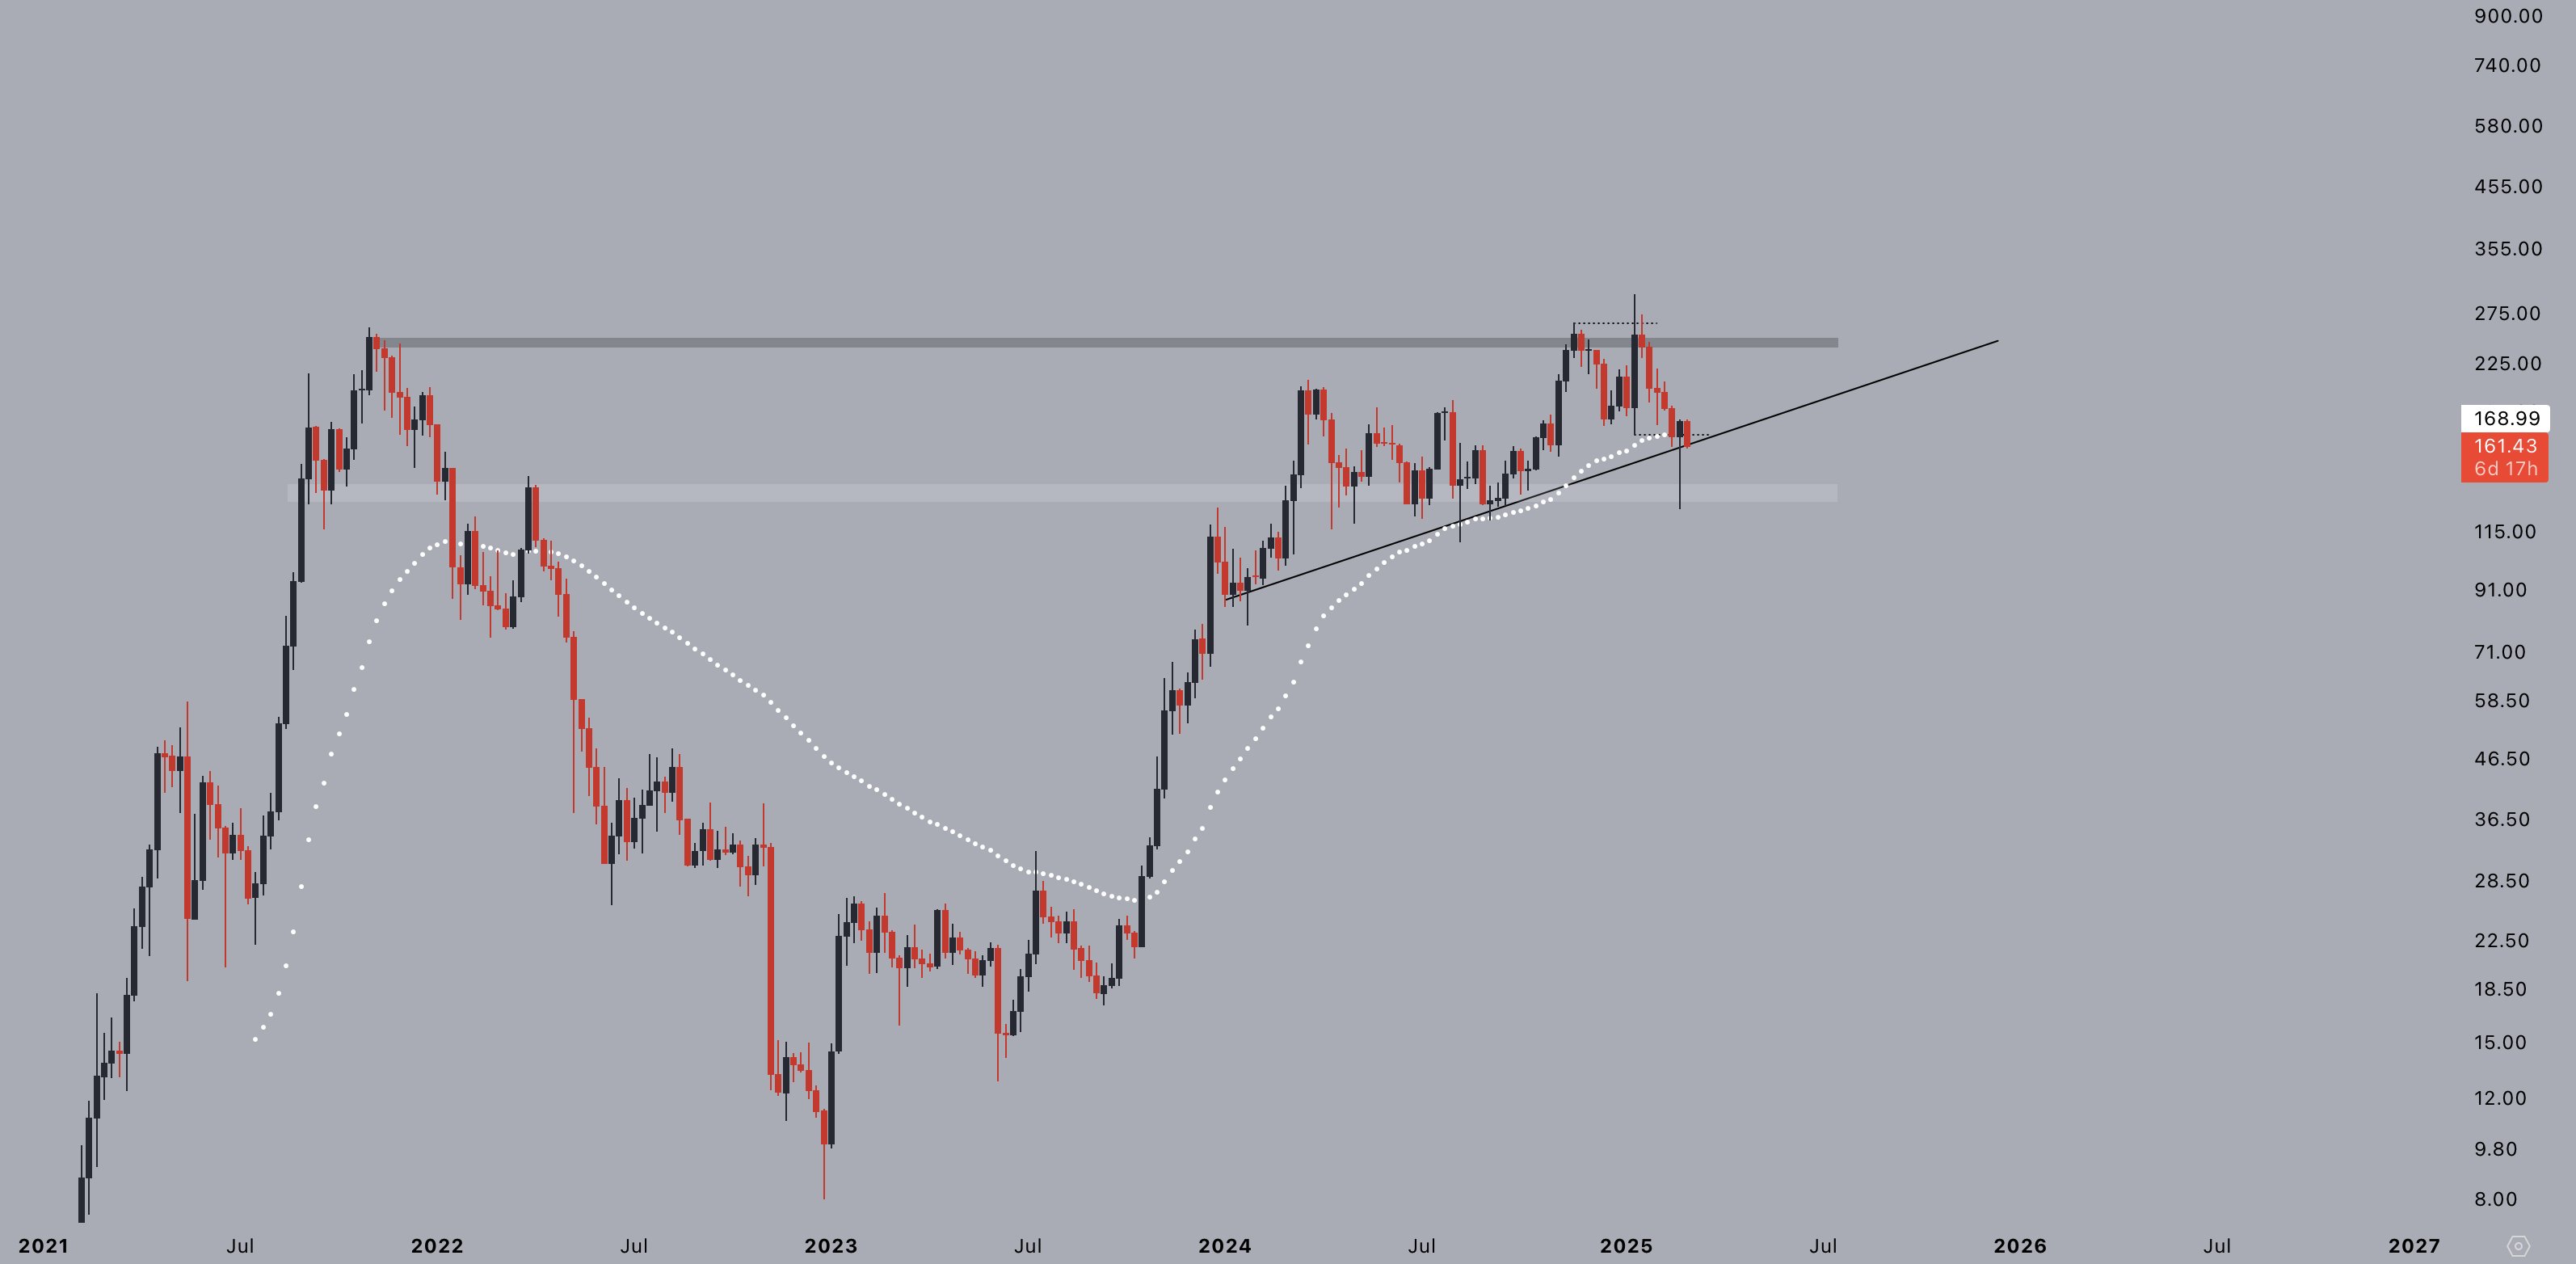
The overall sentiment among analysts supports Martinez’s bullish outlook. Jelle (@CryptoJelleNL) pointed to the significant Solana unlock event that is now behind us and underscored the fact that the weekly candle closed in the green. According to his observations, SOL has reclaimed crucial support after taking out its lows, with a trendline that continues to hold firmly.
“Massive $SOL unlock behind us, and the weekly candle closed in the green. Lows taken out, support retested, trendline holding. Pretty sure the next SOL push sends it into price discovery – hard,” he writes via X.
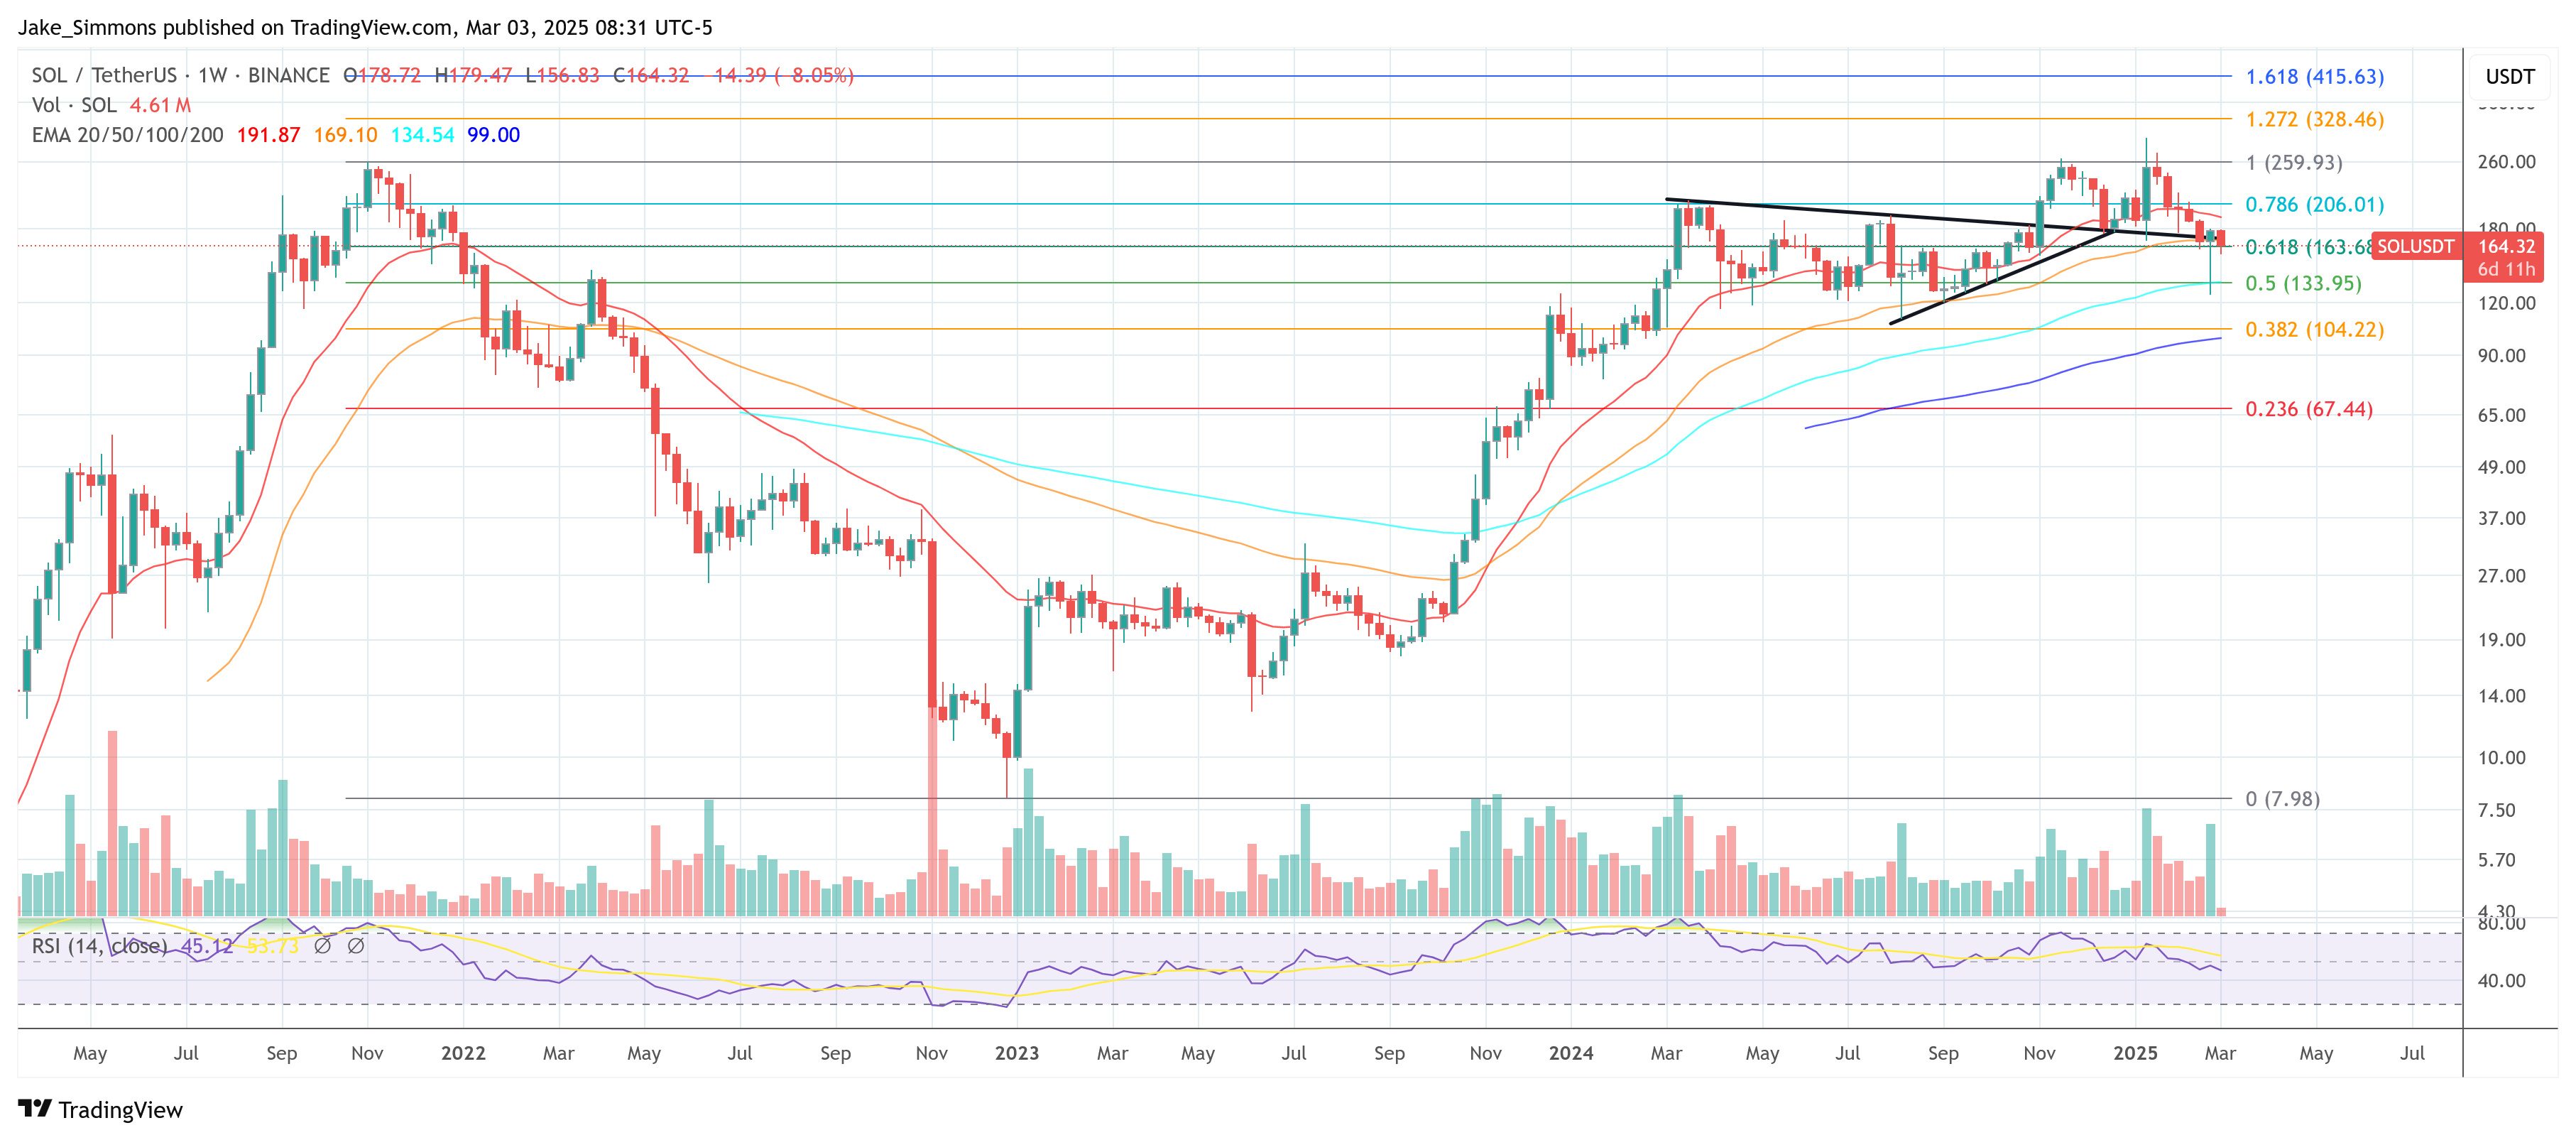
Adding to the positive market narrative, Chris Burniske, a partner at Placeholder VC, remarked via X that BTC, ETH, and SOL all posted favorable weekly closes and that the long-term trend across these leading cryptocurrencies remains to the upside. “BTC ETH and SOL couldn’t have asked for better closes on the weeklies. The long term trend remains: UP,” Burniske says.
From a technical perspective, much hinges on Solana’s ability to sustain its breakout. The descending channel had functioned as a clear reference for bearish sentiment, and breaching it suggests a significant change in the market’s psychology.
At press time, SOL traded at $164.
Featured image created with DALL.E, chart from TradingView.com
Source link


Reason to trust
![]()
Strict editorial policy that focuses on accuracy, relevance, and impartiality
Created by industry experts and meticulously reviewed
The highest standards in reporting and publishing
Strict editorial policy that focuses on accuracy, relevance, and impartiality
Morbi pretium leo et nisl aliquam mollis. Quisque arcu lorem, ultricies quis pellentesque nec, ullamcorper eu odio.
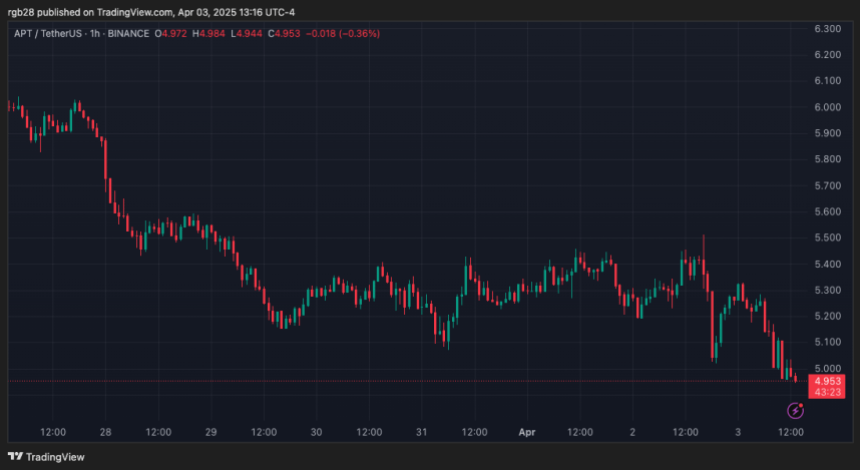
Amid the market retrace, Aptos (APT) has seen an 8% decline in the past 24 hours, falling below a key support zone for the second time this week. Despite the correction, some analysts consider that the cryptocurrency could be poised for a breakout soon.
Related Reading
Aptos Loses Macro Range Lows
During the March retraces, Aptos fell below a crucial support level for the first time since August 2024 but recovered 24% near the end of the month. However, APT followed the rest of the market and dumped 11% to close the March below key levels.
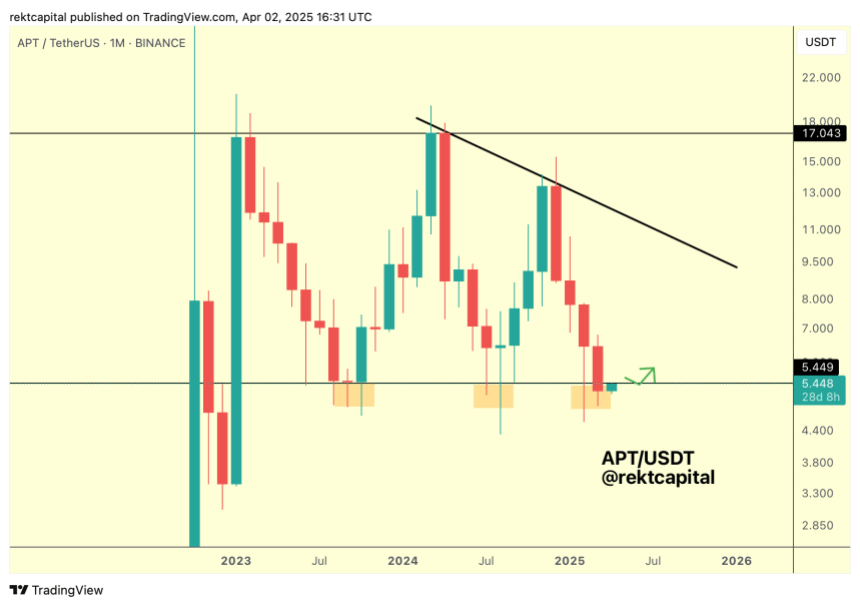
Analyst Rekt Capital noted that APT closed last month below its Macro Range Low of $5.44 for the first time. The cryptocurrency has been trading within the $5.45-$17 price range since 2023, retesting the range lows two times before.
Historically, “APT tends to develop bases here in the form of downside wicks for three-month periods,” he explained, adding that the cryptocurrency seems to be developing a third three-month base, with the difference that it has closed below this range for the first time in the monthly timeframe.
Following this performance, Aptos will need to reclaim the $5.44 level as support “to end this Monthly close as a downside deviation” and “avoid a bearish retest here.”
Previously, the analyst suggested that holding this level could reverse ATP’s price action in the coming months, as it has done with the other clusters. Additionally, he pointed out the previous consolidations included a “downside wicking below support.”
In his recent analysis, Rekt Capital considers that APT’s daily bullish divergence “is still something worth watching” as the cryptocurrency’s Relative Strength Index (RSI) continues to form Higher Lows despite the recent downside deviation, and its price “is trying to transition away from Lower Lows into a new Higher Low.”
According to the analyst, “a clear market structure is developing here, and a breakout from it would validate the Bull Div and set APT up for a reclaim of the Macro Range Low of $5.44,” which is key for a bullish rally.
APT To Reclaim $6.5 Resistance?
Analyst Sjuul from AltCryptoGems highlighted Aptos’ strength amid the market volatility, which saw Bitcoin (BTC) drop from $88,000 to $81,000 in the past 24 hours. APT dropped from the $5.40 mark to the $4.95 support.
The analyst considers that a retest of the local range lows could be necessary before the cryptocurrency aims for the next crucial level, as the current price zone has been tested many times.
Related Reading
Moreover, a reclaim of the $5.44 range could see the APT surge another 20% to the $6.5 resistance lost two months ago. Another market watcher suggested that Aptos is “showing potential for a bullish breakout as it trades within a descending channel.”
Per the chart, the cryptocurrency has been trading within a descending channel since early February, testing the channel’s lower and upper boundaries throughout March. “After testing the lower trendline, it may be finding support, and a break above the upper resistance will signal a significant rally,” the analyst concluded.
As of this writing, Aptos trades at $5.02, a 16.1% decline in the weekly timeframe.
Featured Image from Unsplash.com, Chart from TradingView.com
Source link
Reason to trust
![]()
Strict editorial policy that focuses on accuracy, relevance, and impartiality
Created by industry experts and meticulously reviewed
The highest standards in reporting and publishing
Strict editorial policy that focuses on accuracy, relevance, and impartiality
Morbi pretium leo et nisl aliquam mollis. Quisque arcu lorem, ultricies quis pellentesque nec, ullamcorper eu odio.
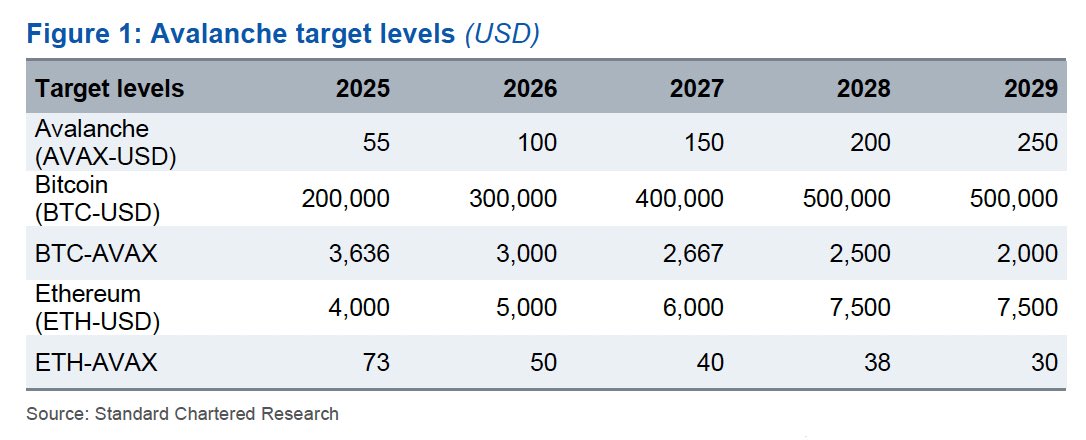
Global banking giant Standard Chartered published new five-year price projections for three leading cryptocurrencies: Avalanche (AVAX), Bitcoin (BTC), and Ethereum (ETH). According to these forecasts, Avalanche is poised to gain significant ground on both Bitcoin and Ethereum by 2029.
Ryan Rasmussen, Head of Research at Bitwise, drew attention to these ambitious targets via X. “Global banking giant Standard Chartered just published 5yr price targets for Bitcoin, Ethereum, and Avalanche,” Rasmussen wrote, pointing to a chart that outlined the bank’s estimates.
Standard Chartered expects Avalanche (AVAX) to reach $55 by the end of 2025, $100 by 2026, $150 by 2027, $200 by 2028, and ultimately $250 by the end of 2029. This projected growth represents a more than 1,200% increase from its current trading level of around $20.
Meanwhile, Bitcoin (BTC) updated its forecast and now projects BTC to appreciate from $200,000 in 2025 to $300,000 in 2026, followed by $400,000 in 2027, and finally hitting $500,000 in 2028—a level it is expected to maintain through 2029.
For Ethereum (ETH), Standard Chartered projects the token to hit $4,000 in 2025, $5,000 in 2026, $6,000 in 2027, and $7,500 by 2028, with no change anticipated in 2029. The forecast indicates steady but less dramatic growth relative to Avalanche.
Related Reading
In terms of comparative valuation, the bank provided ratio metrics to show how AVAX might perform against BTC and ETH. The BTC-to-AVAX ratio, which measures how many AVAX tokens equal one BTC, is expected to drop from 3,636 in 2025 to 2,000 in 2029.
This decreasing trend implies that AVAX will appreciate faster than Bitcoin over the period. Similarly, the ETH-to-AVAX ratio is projected to decline from 73 to 30 during the same timeframe, pointing to a similar outperformance against Ethereum.
Standard Chartered’s Bullish Case For Avalanche
Standard Chartered has initiated coverage of Avalanche, stating it expects AVAX to rise from its current price of roughly $20 to $250 by the end of 2029. “One positive of the tariff noise is that it gives us a chance to re-set and pick winners for the next upswing in digital asset prices,” said Geoffrey Kendrick, the bank’s global head of digital assets research, in an email to The Block on Wednesday, referencing his latest report. “And I think Avalanche will be another winner, perhaps the winner in EVM [Ethereum Virtual Machine] chains.”
Related Reading
Kendrick emphasized that Avalanche’s approach to scaling—particularly after its Etna upgrade, also known as Avalanche9000—positions the network for long-term success. Activated in December 2024, the Etna upgrade dramatically reduced the cost of launching subnets (which Avalanche now calls Layer 1 blockchains), slashing setup expenses from up to $450,000 to nearly zero.
Kendrick noted that these changes appear to be attracting new developer activity: “A quarter of Avalanche’s active subnets are now Etna-compatible, and developer numbers have jumped 40% since the upgrade.”
He also mentioned that some developers are migrating from Ethereum Layer 2 solutions to Avalanche due to its compatibility with Ethereum code and the lower overhead for launching new subnets or L1 chains. While fees on Avalanche can still run higher than certain Ethereum L2s like Arbitrum, Kendrick believes attracting completely new applications—especially in fields such as gaming and consumer-focused tools—will be critical to Avalanche’s growth.
“As a result, we see AVAX outperforming both Bitcoin and Ethereum in terms of relative price gains in the coming years,” Kendrick remarked, while noting Avalanche’s higher volatility levels compared to BTC.
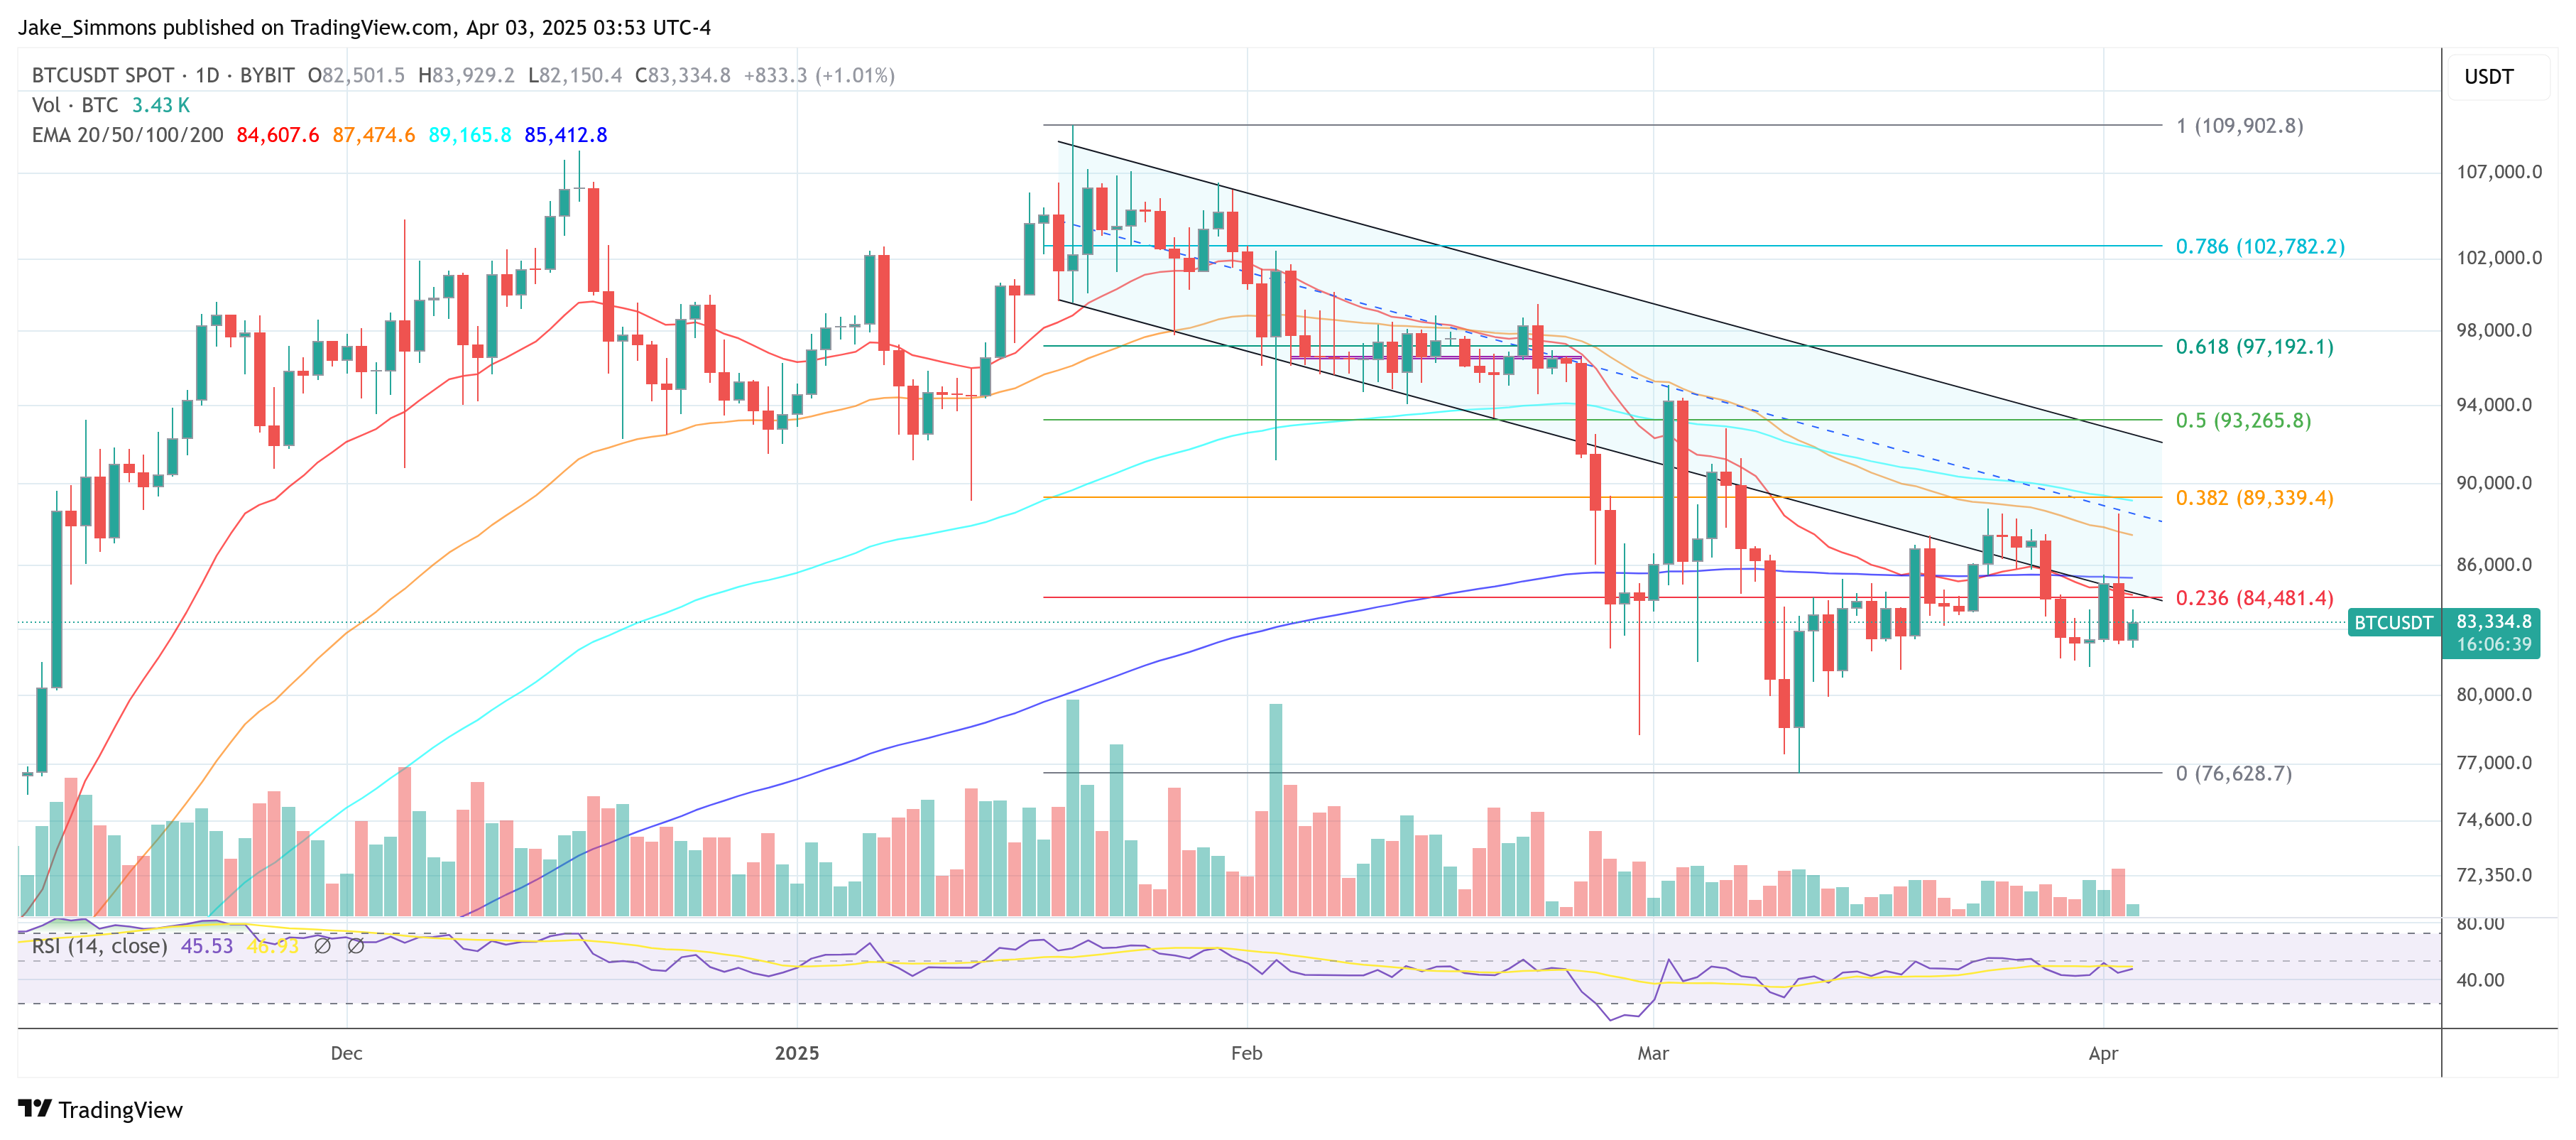
At press time, BTC traded at $83,334.
Featured image created with DALL.E, chart from TradingView.com
Source link
Reason to trust
![]()
Strict editorial policy that focuses on accuracy, relevance, and impartiality
Created by industry experts and meticulously reviewed
The highest standards in reporting and publishing
Strict editorial policy that focuses on accuracy, relevance, and impartiality
Morbi pretium leo et nisl aliquam mollis. Quisque arcu lorem, ultricies quis pellentesque nec, ullamcorper eu odio.
Shares of Coinbase (COIN), the largest crypto exchange in the US, have faced significant declines during the first quarter (Q1) of the year, primarily due to escalating concerns about the US economy and its impact on digital assets.
Coinbase And Others Face Increased Volatility
According to Bloomberg, Coinbase’s stock has dropped more than 30% since the beginning of the quarter, marking its worst performance since the collapse of the FTX exchange in late 2022.
This decline is reflective of a broader trend affecting nearly all major crypto-linked stocks, including companies like Galaxy Digital Holdings (GLXY.TO), Riot Platforms (RIOT), and Core Scientific (CORZ).
Related Reading
The cryptocurrency market itself is experiencing turmoil, with Bitcoin (BTC) falling over 20% from its all-time high and Ethereum (ETH) plummeting more than 45% in value.
These shifts come amid President Donald Trump’s escalation of a “global trade war,” which has stirred fears about the health of the country’s economy. Economic data has exacerbated these concerns, pushing the S&P 500 Index (GSPC) toward its worst quarter since mid-2022.
Oppenheimer analyst Owen Lau noted that many within the cryptocurrency community recognize that the current market conditions are not primarily driven by fundamental factors. Instead, Lau emphasized that macroeconomic issues—such as tariffs and the potential trade war—are influencing investor sentiment significantly.
The looming threat of a recession has reportedly added to the unease, causing higher-risk crypto-linked stocks to be even more volatile than Bitcoin itself.
Lau explains that investments in companies like Coinbase carry additional risks, including the potential for bankruptcy, allegedly making them particularly susceptible to swift sell-offs.
Cryptocurrency Market Struggles To Rebound
The current state of the cryptocurrency market is a stark contrast to the optimism that prevailed at the start of the year, following Trump’s election. Bitcoin reached a record high of over $109,000 on Inauguration Day.
Earlier this month, Bitcoin prices fell after Trump announced a strategic reserve for the market’s leading crypto, but did not allocate taxpayer funds to expand it. As of now, Bitcoin trades around $83,000, still above pre-election levels but far from its peak.
Related Reading
While shares of various crypto-related companies surged following the election, Coinbase and crypto miners have since relinquished those gains. Notably, Michael Saylor’s Strategy (MSTR) is among the few stocks in the sector that has managed to remain in positive territory since November 5.
Despite the downturn, the cryptocurrency industry continues to gain influence in Washington and is moving closer to integration with traditional financial systems. However, this growing power has yet to translate into a market rebound.
Connor Loewen, a cryptocurrency analyst at 3iQ, expressed skepticism about the current state of investor sentiment, stating, “What we saw a couple of months ago, I don’t know how much crazier it can get than that. I think we’re going to have to be looking for new catalysts.”
Featured image from DALL-E, chart from TradingView.com
Source link

Trump Ally Bill Ackman Calls for 90-Day Pause on US Tariffs as Crypto Sinks

Ethereum price Tags $1,500 As Global Stock Market Crash Triggers Circuit Breakers

Bitcoin Trades Above $79K as Asia Markets React to Trump Tariffs

Memecoin platform Pump.fun brings livestream feature back to 5% of users

Bitcoin Price On The Verge Of Explosive 15% Breakout As Analyst Spots Triangle Formation

Strategy CEO Makes The Case For Corporate Bitcoin Adoption In MIT Keynote

Hackers Hammer Android and iPhone Users As Bank Account Attacks Surge 258% in One Year: Kaspersky

Cryptocurrencies to watch this week: Aptos, XRP, Solana

This Week in Crypto Games: ‘Off the Grid’ Token Live, Logan Paul ‘CryptoZoo’ Lawsuit Continues

Crypto Liquidations hit $600M as BTC Plunges Below $80K First Time in 25-days

Bitcoin (BTC) Price Posts Worst Q1 in a Decade, Raising Questions About Where the Cycle Stands

Stablecoins are the best way to ensure US dollar dominance — Web3 CEO

Chainlink (LINK) Targets Rebound To $19 — But Only If This Key Support Holds

NFT industry in trouble as activity slows, market collapses

US Tech Sector About To Witness ‘Economic Armageddon’ Amid Trump’s Tariffs, According to Wealth Management Exec


 24/7 Cryptocurrency News5 months ago
Arthur Hayes, Murad’s Prediction For Meme Coins, AI & DeFi Coins For 2025

 Bitcoin3 months ago
Expert Sees Bitcoin Dipping To $50K While Bullish Signs Persist

 24/7 Cryptocurrency News3 months ago
Aptos Leverages Chainlink To Enhance Scalability and Data Access

 Bitcoin5 months ago
Bitcoin Could Rally to $80,000 on the Eve of US Elections

 Altcoins2 months ago
Sonic Now ‘Golden Standard’ of Layer-2s After Scaling Transactions to 16,000+ per Second, Says Andre Cronje

 Bitcoin5 months ago
Institutional Investors Go All In on Crypto as 57% Plan to Boost Allocations as Bull Run Heats Up, Sygnum Survey Reveals

 Opinion5 months ago
Crypto’s Big Trump Gamble Is Risky

 Price analysis5 months ago
Ripple-SEC Case Ends, But These 3 Rivals Could Jump 500x
