
Bitcoin
Introducing the Bitcoin Everything Indicator

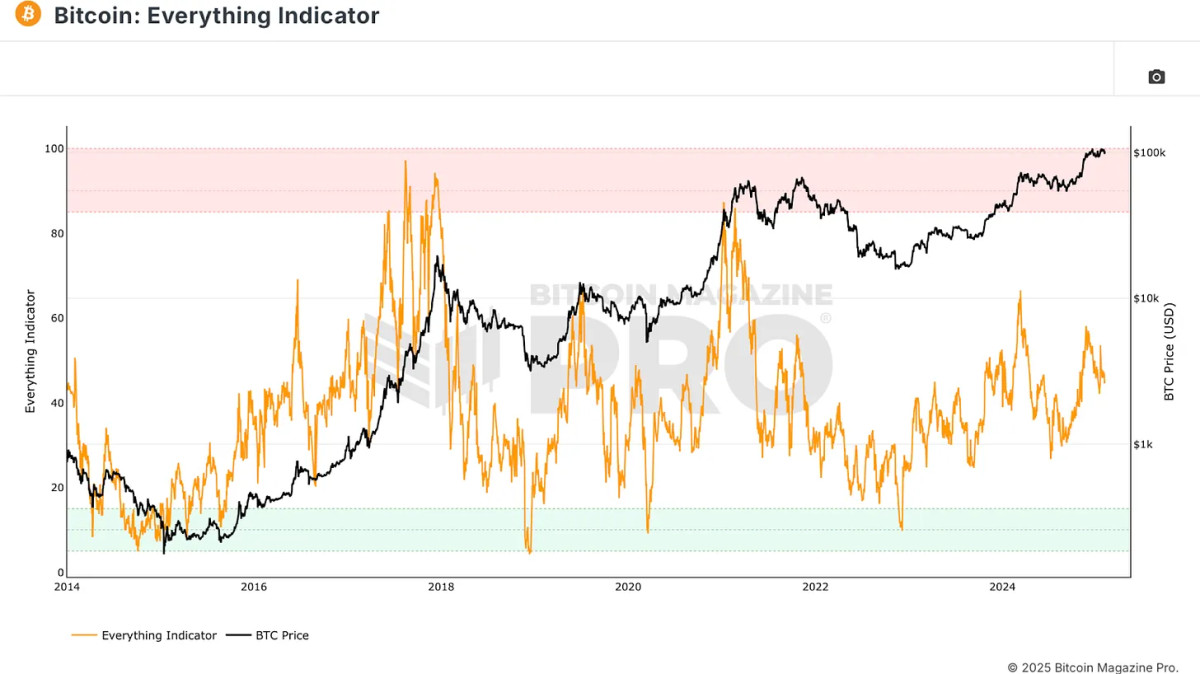
Wouldn’t it be great if we had one all-encompassing metric to guide our Bitcoin investing decisions? That’s precisely what has been created, the Bitcoin Everything Indicator. Recently added to Bitcoin Magazine Pro, this indicator aims to consolidate multiple metrics into a single framework, making Bitcoin analysis and investment decision-making more streamlined.
For a more in-depth look into this topic, check out a recent YouTube video here: The Official Bitcoin EVERYTHING Indicator
Why We Need a Comprehensive Indicator
Investors and analysts typically rely on various metrics, such as on-chain data, technical analysis, and derivative charts. However, focusing too much on one aspect can lead to an incomplete understanding of Bitcoin’s price movements. The Bitcoin Everything Indicator attempts to solve this by integrating key components into one clear metric.

The Core Components of the Bitcoin Everything Indicator
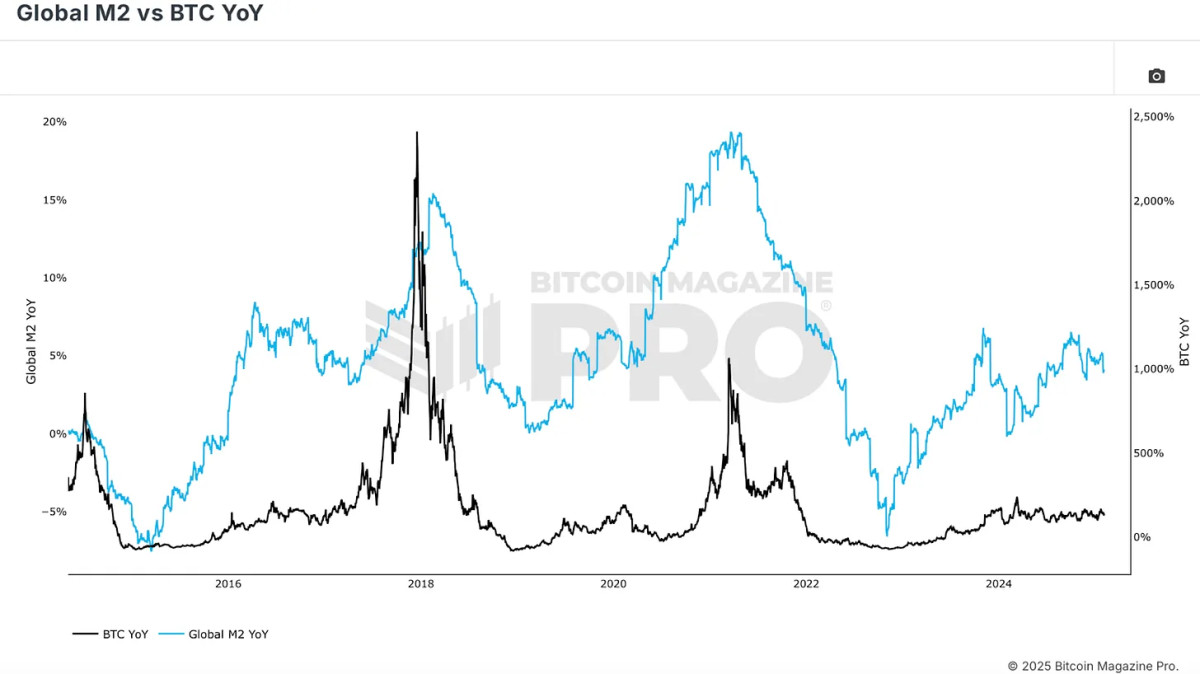
Bitcoin’s price action is deeply influenced by global liquidity cycles, making macroeconomic conditions a fundamental pillar of this indicator. The correlation between Bitcoin and broader financial markets, especially in terms of Global M2 money supply, is clear. When liquidity expands, Bitcoin typically appreciates.
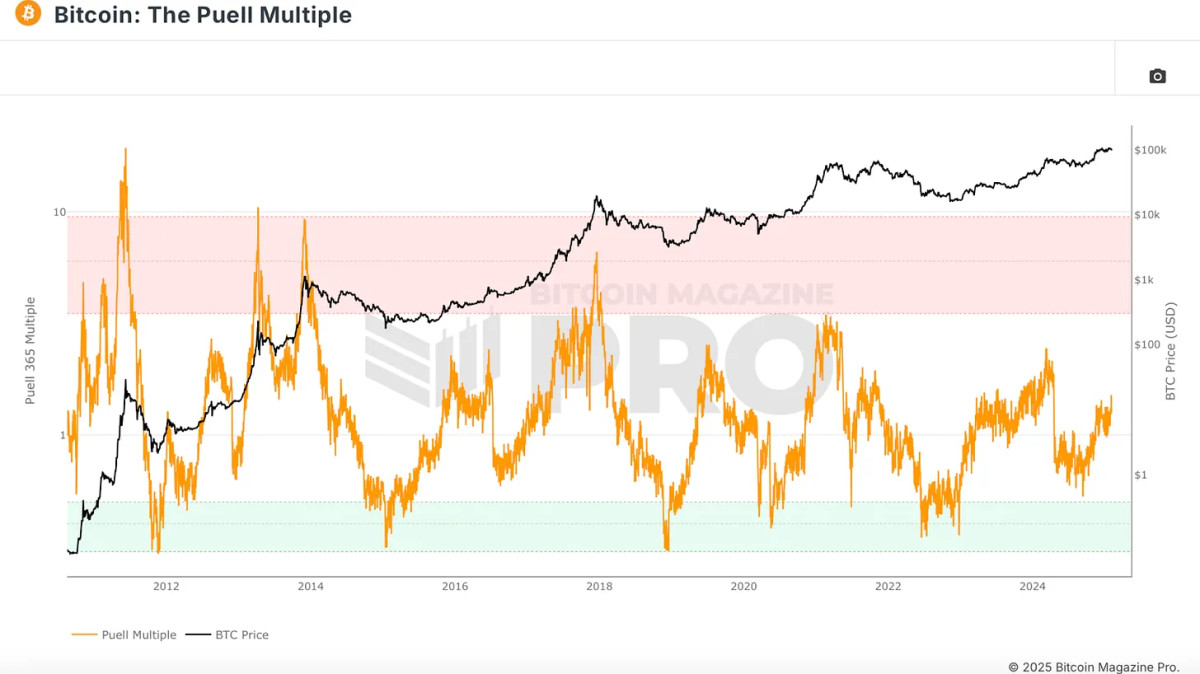
Fundamental factors like Bitcoin’s halving cycles and miner strength play an essential role in its valuation. While halvings decrease new Bitcoin supply, their impact on price appreciation has diminished as over 94% of Bitcoin’s total supply is already in circulation. However, miner profitability remains crucial. The Puell Multiple, which measures miner revenue relative to historical averages, provides insights into market cycles. Historically, when miner profitability is strong, Bitcoin tends to be in a favorable position.
On-chain indicators help assess Bitcoin’s supply and demand dynamics. The MVRV Z-Score, for example, compares Bitcoin’s market cap to its realized cap (average purchase price of all coins). This metric identifies accumulation and distribution zones, highlighting when Bitcoin is overvalued or undervalued.

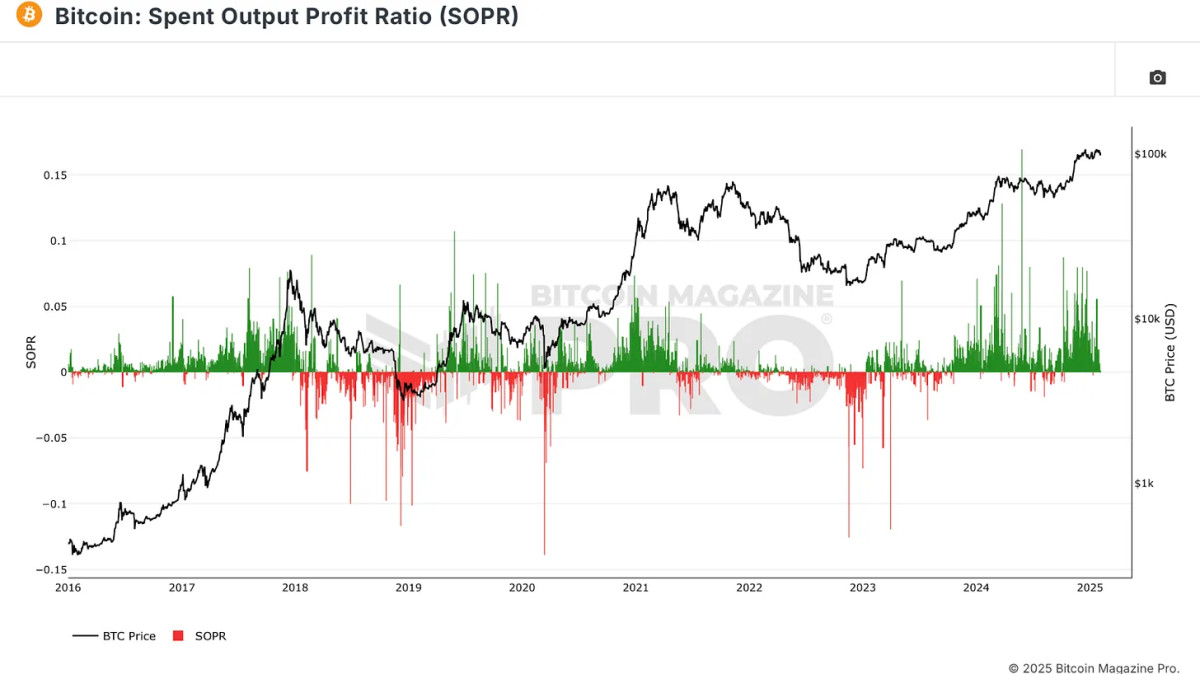
Another critical on-chain metric is the Spent Output Profit Ratio (SOPR), which examines the profitability of coins being spent. When Bitcoin holders realize massive profits, it often signals a market peak, whereas high losses indicate a market bottom.
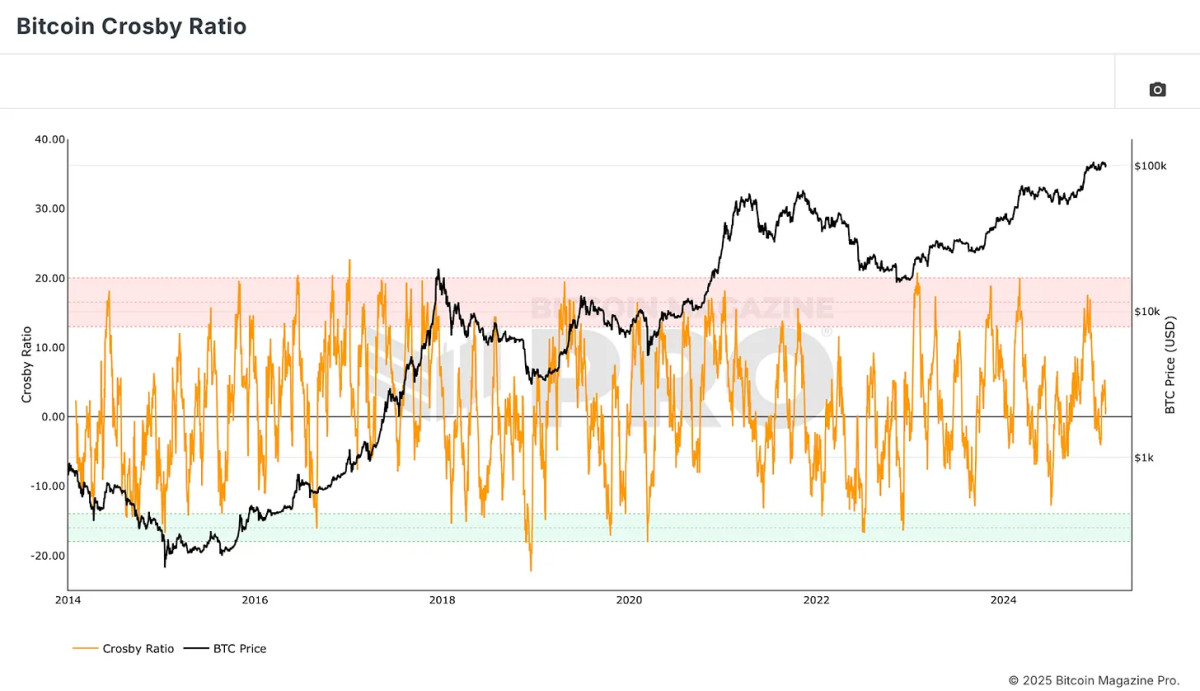
The Bitcoin Crosby Ratio is a technical metric that assesses Bitcoin’s overextended or discounted conditions purely based on price action. This ensures that market sentiment and momentum are also accounted for in the Bitcoin Everything Indicator.
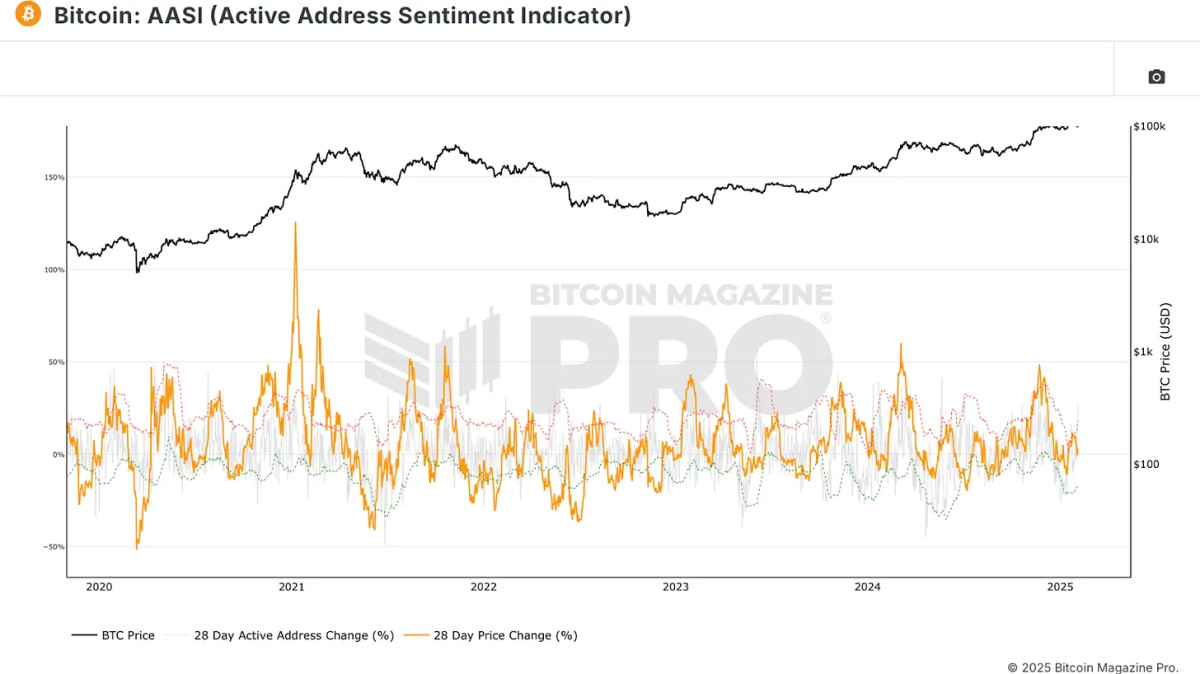
Network usage can offer vital clues about Bitcoin’s strength. The Active Address Sentiment Indicator measures the percentage change in active addresses over 28 days. A rise in active addresses generally confirms a bullish trend, while stagnation or decline may signal price weakness.
How the Bitcoin Everything Indicator Works
By blending these various metrics, the Bitcoin Everything Indicator ensures that no single factor is given undue weight. Unlike models that rely too heavily on specific signals, such as the MVRV Z-Score or the Pi Cycle Top, this indicator distributes influence equally across multiple categories. This prevents overfitting and allows the model to adapt to changing market conditions.

Historical Performance vs. Buy-and-Hold Strategy
One of the most striking findings is that the Bitcoin Everything Indicator has outperformed a simple buy-and-hold strategy since Bitcoin was valued at under $6. Using a strategy of accumulating Bitcoin during oversold conditions and gradually selling in overbought zones, investors using this model would have significantly increased their portfolio’s performance with lower drawdowns.
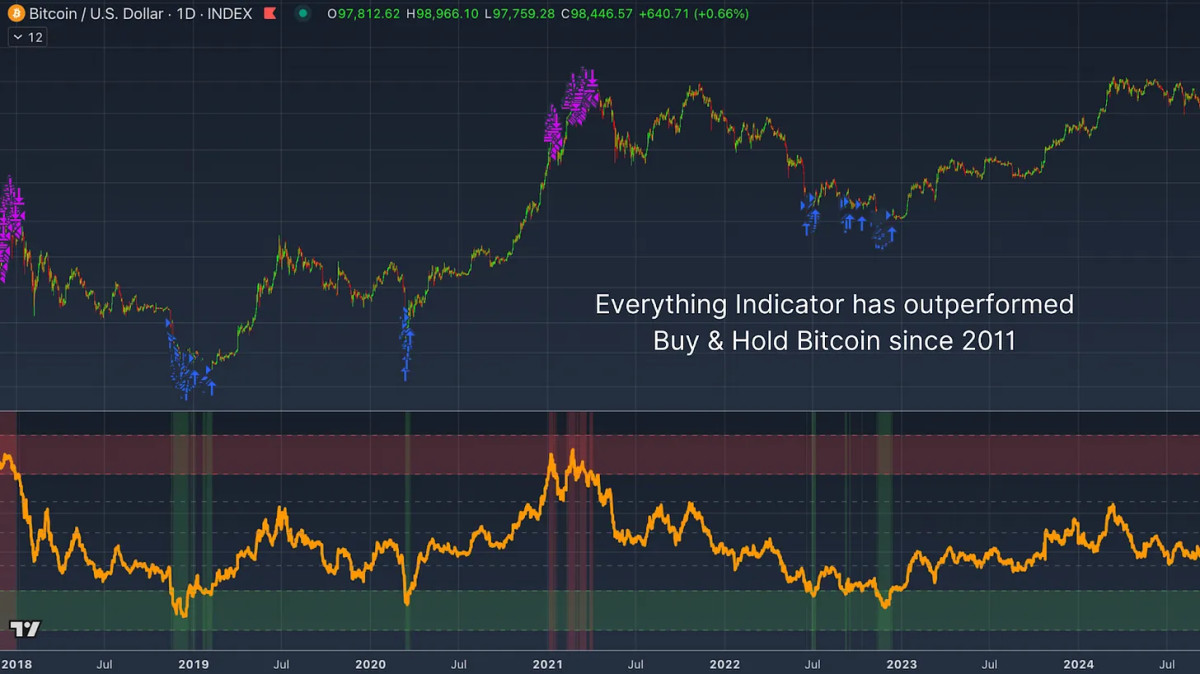
For instance, this model maintains a 20% drawdown compared to the 60-90% declines typically seen in Bitcoin’s history. This suggests that a well-balanced, data-driven approach can help investors make more informed decisions with reduced downside risk.
Conclusion
The Bitcoin Everything Indicator simplifies investing by merging the most critical aspects influencing Bitcoin’s price action into a single metric. It has historically outperformed buy-and-hold strategies while mitigating risk, making it a valuable tool for both retail and institutional investors.
For more detailed Bitcoin analysis and to access advanced features like live charts, personalized indicator alerts, and in-depth industry reports, check out Bitcoin Magazine Pro.
Disclaimer: This article is for informational purposes only and should not be considered financial advice. Always do your own research before making any investment decisions.
Source link


Bitcoin (BTC) fell early in the U.S. trading session, but mostly held firm as poor macroeconomic news rolled in.
The top cryptocurrency late in the day was trading just below $95,000, up 0.5% over the past 24 hours. The CoinDesk 20 — an index of the top 20 largest cryptocurrencies by market capitalization excluding memecoins, exchange coins and stablecoins — was roughly flat over the same time frame.
Crypto stocks like Coinbase (COIN), Strategy (MSTR) and the miners were losing modest ground after big gains last week. Notable exceptions included Janover (JNVR) and DeFi Technologies (DFTF), ahead 24% and 6.5%, respectively even as SOL — the token which both companies are aggressively accumulating — fell about 3% during the U.S. day.
Meanwhile, gold rose almost 1% and the dollar index fell 0.6%. The S&P 500 and Nasdaq each peaked into the green late in the session after earlier dipping more than 1%.
The Dallas Fed Manufacturing Index, a typically little-noticed economic data point, plunged to -35.8 from -16.3 last month — much worse than analysts’ expectations of a -14.1 print and the worst performance since COVID upended the world economy.
“Pretty horrible Dallas Fed Manufacturing Survey. Level hits the lowest since May 2020,” Joe Weisenthal, co-host of the Odd Lots podcast, posted on X. “All the comments are about tariffs and policy uncertainty. Add it to the list of bad soft/survey data.”
Hostilities between India and Pakistan might also have added to market jitters, with Pakistani Defense Minister Khawaja Muhammad Asif claiming that an Indian military incursion into Pakistan was imminent. Last week 26 people were killed in a terrorist attack in Pahalgam, a popular tourist destination in Indian-controlled Kashmir. The two countries have exchanged fire since.
Source link

A widely followed crypto analyst and trader is forecasting that Bitcoin (BTC) will start outperforming gold.
In a new video update, the host of InvestAnswers tells his 565,000 YouTube subscribers that the top crypto asset by market cap should outpace gold over the coming months, as he says the precious metal looks overextended following its parabolic rally to $3,500.
“If you look at the steady correlation between Bitcoin and Nasdaq, it is extremely tight because Bitcoin is considered a risk asset, [while] gold is considered a risk-off asset. But here, if you look at the Bitcoin/gold correlation, it fluctuates very heavily. Half the time, not correlated; half the time, it is correlated.
So there’s no signal of direct correlation and Bitcoin has already had a great post-halving, and in fact, we had hit a new all-time high before the halving, which has never happened before with Bitcoin. But its correlation with gold remains low.
Now, if I look at this chart and just like a caveman would, what do I interpret? I expect the correlation to increase with gold as the broader dynamics of the market will shift as well. I also believe gold is overbought, so I see gold mean-reverting and I see Bitcoin going up versus gold over the next six months.”

InvestAnswers says a summarized interpretation of his analysis would be that the flagship digital asset is lagging behind gold and will start to outpace the precious metal during the next six months.
BTC is trading for $93,870 at time of writing, a fractional decrease during the last 24 hours while gold is valued at $3,283 per ounce, a marginal decrease on the day.
Follow us on X, Facebook and Telegram
Don’t Miss a Beat – Subscribe to get email alerts delivered directly to your inbox
Check Price Action
Surf The Daily Hodl Mix
 

Disclaimer: Opinions expressed at The Daily Hodl are not investment advice. Investors should do their due diligence before making any high-risk investments in Bitcoin, cryptocurrency or digital assets. Please be advised that your transfers and trades are at your own risk, and any losses you may incur are your responsibility. The Daily Hodl does not recommend the buying or selling of any cryptocurrencies or digital assets, nor is The Daily Hodl an investment advisor. Please note that The Daily Hodl participates in affiliate marketing.
Generated Image: Midjourney
Source link

Veteran macro investor Luke Gromen says he likes Bitcoin (BTC) due to its potential to influence demand for US Treasuries.
In a new video update, the founder of the macroeconomic research firm Forest for the Trees (FFTT) says the Trump administration is in a position to boost demand for US bonds after the president signed an executive order creating a Strategic Bitcoin Reserve.
A Bitcoin bull market typically increases demand for dollar-pegged crypto assets, and according to Gromen, could ultimately drive demand for US Treasuries.
“Note that the Trump administration is still talking about putting T-bills (Treasury bills) into stablecoins, using stablecoins as a means to drive demand for T-bills. And obviously, they’ve talked about the Strategic Bitcoin Reserve.
Left unsaid in all of that is that the higher the Bitcoin price, the more stablecoin demand, the more T-bill demand there is…
I think the underlying theme of [the] US government desperately needs balance sheet and stablecoins and therefore Bitcoin can help the US government find balance sheet. I think that is absolutely still in play.
It’s one of the reasons why we still like Bitcoin over the intermediate longer term.”
Stablecoin issuers such as Tether and Circle predominantly rely on Treasury bills to back their coins on a 1:1 basis. As of December 2024, Tether has invested over $94.47 billion in T-bills to back USDT. Meanwhile, Circle owns $22.047 billion worth of T-bills as of February of this year to back USDC.
Additionally, two stablecoin bills that are progressing through Congress, the STABLE Act of 2025 and the GENIUS Act of 2025, require issuers to invest in T-bills and other real-world assets to back their coins.
Follow us on X, Facebook and Telegram
Don’t Miss a Beat – Subscribe to get email alerts delivered directly to your inbox
Check Price Action
Surf The Daily Hodl Mix
 
Disclaimer: Opinions expressed at The Daily Hodl are not investment advice. Investors should do their due diligence before making any high-risk investments in Bitcoin, cryptocurrency or digital assets. Please be advised that your transfers and trades are at your own risk, and any losses you may incur are your responsibility. The Daily Hodl does not recommend the buying or selling of any cryptocurrencies or digital assets, nor is The Daily Hodl an investment advisor. Please note that The Daily Hodl participates in affiliate marketing.
Generated Image: Midjourney
Source link

From Booze to Barbells: Exercise May Offset Risks of College Partying

Ethereum Foundation shuffles leadership, splits board and management

Bitcoin Price (BTC) Retakes $95K Level After Early U.S. Decline

A New Risk For The Industry?

Justin Sun Bets Big On JUST Token, Sees 100x Potential

Worldcoin price prediction | What’s next for WLD price?

Bitcoin Is About To Begin Outperforming Gold, Says InvestAnswers – Here’s His Timeline

Bloomberg Analyst Confirms No Set Launch Date for ProShares XRP ETFs

What is Base? The Ethereum Layer-2 Network Launched by Coinbase

Loopscale hacker in talks to return stolen crypto

Bitcoin (BTC) Yield Platform Coming From Coinbase (COIN), Aspen Digital

The Emerging Market For State Services Via Citizen X

XRP Price Shoots For 20% Surge To $2.51 Amid Pullback To Breakout Zone

Stocks edge higher ahead of big earnings week

Here’s How Bitcoin Could Boost Demand for US Treasuries, According to Macro Guru Luke Gromen


 24/7 Cryptocurrency News6 months ago
Arthur Hayes, Murad’s Prediction For Meme Coins, AI & DeFi Coins For 2025

 Bitcoin3 months ago
Expert Sees Bitcoin Dipping To $50K While Bullish Signs Persist

 Ripple Price1 month ago
3 Voting Polls Show Why Ripple’s XRP Price Could Hit $10 Soon

 24/7 Cryptocurrency News4 months ago
Aptos Leverages Chainlink To Enhance Scalability and Data Access

 Bitcoin6 months ago
Bitcoin Could Rally to $80,000 on the Eve of US Elections

 Opinion6 months ago
Crypto’s Big Trump Gamble Is Risky

 Bitcoin6 months ago
Institutional Investors Go All In on Crypto as 57% Plan to Boost Allocations as Bull Run Heats Up, Sygnum Survey Reveals

 Bitcoin3 months ago
The Future of Bitcoin: Scaling, Institutional Adoption, and Strategic Reserves with Rich Rines
