
ETH
Is Ethereum Price a VC Pump and Dump?

Ethereum (ETH) price has experienced a period of consolidation after recent gains, with a decline pushing it below the $2,550 support level. While ETH faces resistance of nearly $2,500, it holds the potential for recovery if it clears this key barrier. Analysts suggest possible volatility ahead, with forecasts hinting at potential pump-and-dump dynamics driven by venture capital influences.
Analyst Suggests Ethereum Price a VC Pump and Dump
Crypto analyst tweeted a controversial perspective on Ethereum’s long-term trajectory, raising questions within the cryptocurrency community. The tweet posits that Ethereum’s significant growth might be attributed to a venture capital (VC) pump-and-dump scheme, sparking debate about the network’s stability and future.
The analyst highlighted a possible downward trend. Ethereum’s price movement appears to follow a channel, indicating consistent support and resistance. However, a sharp drop in the projection suggests potential risks.

Crypto Expert Warns of Ethereum’s Instability
The crypto expert issued a cautionary note regarding Ethereum’s current market position. Beamish expressed concern over Ethereum’s chart patterns, suggesting potential instability. With market factors like the upcoming election adding unpredictability, he noted Ethereum appears “teetering on the edge,” raising questions about its immediate trajectory.
Analysis points to a volatile period for the top coin as it hovers near critical support levels. He highlighted Ethereum’s delicate positioning, which could influence traders weighing whether to hold or exit their positions. In his words, Ethereum is at a crossroads, posing a dilemma: “do I jump? Do I jump?”
$ETH #Ethereum
hate to say it, election or not, this one is looking really dangerous in here…..just teetering on the edge….’do I jump? do I jump?’ pic.twitter.com/dxKNEK8cVk— Brian Beamish (@CRInvestor) November 4, 2024
Will ETH Price Rebound To $3000 In November?
At the time of writing, the Latest ETH price is hovering at $2,469, with a slight surge over the past 24-hours. Ethereum is positioning itself near crucial resistance levels, with the potential for a significant price movement. A clear push above the $2,550 resistance could drive ETH toward $2,600, while an upward breakout past $2,800 might further fuel gains. If successful, this momentum could lead Ethereum closer to the $3,000 resistance mark, appealing to bullish investors eyeing a rally.
However, if the Ethereum price prediction fails to surpass the $2,500 resistance, it risks a downturn. Initial support sits around $2,450, with more substantial support at $2,400. A decisive break below $2,400 could heighten selling pressure, potentially pulling the price to $2,350 as traders look to these levels for a bounce or further decline.

Approximately 76.09% of Ethereum addresses are “In the Money,” covering a value range of up to $2,406.82. On the other hand, 20.91% are “Out of the Money,” indicating potential losses for holders who bought above $2,499.15. Only 3% of addresses remain “At the Money,” meaning they break even at current prices.

Ethereum’s near-term direction remains uncertain, with resistance levels, VC speculation, and market conditions shaping the price outlook for this leading cryptocurrency.
Frequently Asked Questions (FAQs)
A VC pump-and-dump scheme implies that venture capitalists may artificially inflate Ethereum’s price and then sell, causing potential price drops.
Ethereum could rebound if it clears the $2,500 resistance, which could pave the way for gains towards $2,600 and potentially $3,000.
The upcoming election could introduce additional market unpredictability, impacting investor sentiment and Ethereum’s price movement.
Coingape Staff
CoinGape comprises an experienced team of native content writers and editors working round the clock to cover news globally and present news as a fact rather than an opinion. CoinGape writers and reporters contributed to this article.
Disclaimer: The presented content may include the personal opinion of the author and is subject to market condition. Do your market research before investing in cryptocurrencies. The author or the publication does not hold any responsibility for your personal financial loss.
Source link


Reason to trust
![]()
Strict editorial policy that focuses on accuracy, relevance, and impartiality
Created by industry experts and meticulously reviewed
The highest standards in reporting and publishing
Strict editorial policy that focuses on accuracy, relevance, and impartiality
Morbi pretium leo et nisl aliquam mollis. Quisque arcu lorem, ultricies quis pellentesque nec, ullamcorper eu odio.
Ethereum is trading around the $1,600 level after several days of failed attempts to reclaim higher prices. Bulls are showing signs of life, but their momentum remains weak as bearish pressure continues to dominate the market. Despite a brief recovery bounce last week, Ethereum’s broader structure still reflects a clear downtrend.
Related Reading
The crypto market remains under the shadow of macroeconomic uncertainty, as ongoing tensions between the United States and China weigh heavily on global financial sentiment. No resolution or agreement between the two economic giants has been announced, leaving investors cautious and risk-averse.
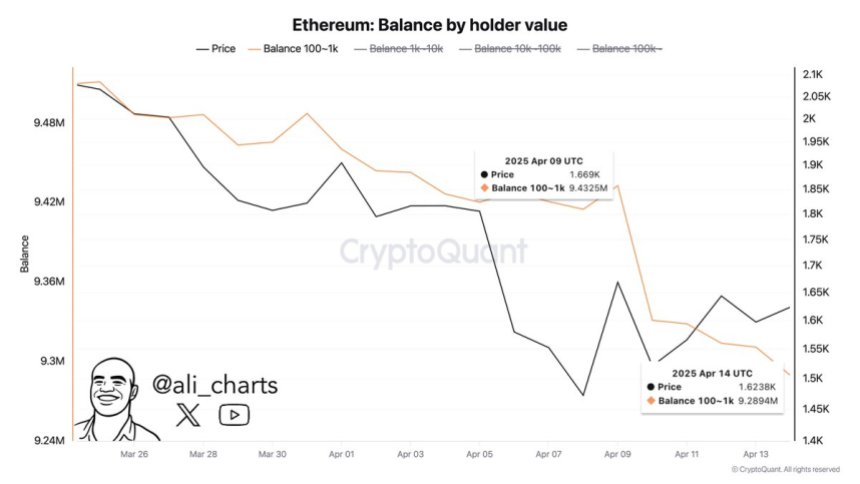
Adding to the negative sentiment, CryptoQuant data shows that Ethereum whales have offloaded approximately 143,000 ETH over the past week. This large-scale distribution reinforces fears of further downside, with long-term holders and large wallets choosing to reduce exposure rather than accumulate.
While some analysts still see potential for a turnaround if key levels are reclaimed, the current market environment remains fragile. Unless Ethereum can regain and hold above short-term resistance levels, the threat of another leg down remains very real. Traders are now closely watching price action for signs of a shift — but for now, caution continues to lead the way.
Ethereum Faces Selling Pressure As Whales Exit
Ethereum is facing a critical test as price action continues to lack clarity, and support levels remain fragile. Despite brief attempts to rebound, ETH has failed to establish a clear bottom, and the downtrend structure remains intact. The market is struggling to define a strong demand zone, making it difficult for bulls to sustain upward momentum. As selling pressure mounts, analysts are warning that Ethereum may continue to slide toward lower demand levels in the absence of strong buying interest.
Broader macroeconomic conditions continue to weigh heavily on risk assets like Ethereum. Global trade tensions, particularly the unresolved tariff standoff between the United States and China, have created uncertainty across financial markets. Combined with fears of a slowing global economy and lack of coordinated fiscal support, crypto markets remain under pressure.
Adding to the bearish sentiment, top analyst Ali Martinez shared on-chain data revealing that whales have offloaded approximately 143,000 ETH over the past week. This large-scale distribution by influential holders has significantly weakened Ethereum’s outlook, reinforcing concerns that smart money is preparing for deeper downside.
Since late December, ETH has remained in a prolonged bearish trend, with every attempt at recovery being met by renewed selling. Unless bulls reclaim key technical levels and shift market sentiment, Ethereum may continue to slide further.
Related Reading
ETH Price Stuck In Volatile Range
Ethereum is currently trading at $1,600 after enduring days of massive volatility and macroeconomic-driven uncertainty. Despite brief relief bounces, ETH remains locked in a bearish structure, unable to generate sustained momentum. For bulls to regain control, reclaiming the $1,850 resistance level is critical. This level aligns with the 4-hour 200 MA and EMA around $1,800, making it a key zone to watch for confirmation of a short-term trend reversal.

Holding above these moving averages would signal renewed strength and possibly mark the beginning of a recovery rally. However, price action continues to struggle beneath them, and failure to push above these indicators would confirm persistent weakness. In that case, Ethereum may retest the $1,500 level or even dip below it if selling pressure intensifies.
Related Reading
The current environment is shaped by global tensions and macro uncertainty, with no clear catalysts to drive a breakout in either direction. As long as ETH remains below its key moving averages, the risk of another leg down remains elevated. Bulls must act swiftly to flip sentiment and avoid a deeper correction toward long-term demand levels.
Featured image from Dall-E, chart from TradingView
Source link
Altcoins
Crypto Trader Says Solana Competitor Starting To Show Bullish Momentum, Updates Outlook on Bitcoin and Ethereum

A widely followed crypto analyst says one Solana (SOL) competitor may be gearing up for a breakout.
In a new thread, crypto trader Michaël van de Poppe tells his 783,000 followers on the social media platform X that Sei (SEI) may increase more than 100% its current value if it breaks through a key resistance level.
“SEI starts to show momentum. The Bitcoin pair has a strong bullish divergence on the higher timeframes and the USD pair faces a crucial resistance. Breaking through $0.20 opens up a continuation towards $0.30-$0.35.”

SEI is trading for $0.17 at time of writing, down 2.4% in the last 24 hours.
Next up, the analyst says that Bitcoin (BTC) is in a consolidation phase that may lead to an explosive move to the upside.
“Bitcoin is stuck in the final range. Another test of $87,000 and we’ll likely break upwards to the rally of a new all-time high.”
Bitcoin is trading for $83,800 at time of writing, flat on the day.
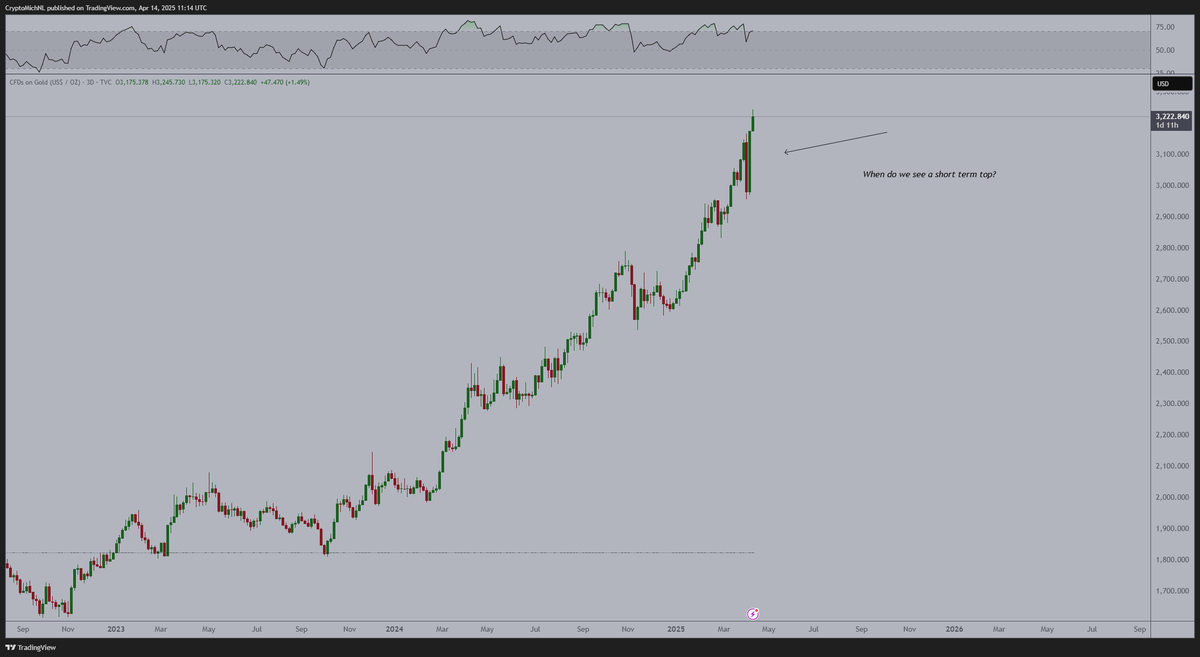
Lastly, the analyst says that Ethereum (ETH) may be kicking off an uptrend if the price of gold peaks, based on ETH’s historic inverse correlation with the precious metal.
“A good start of the week, as ETH is +4% against Bitcoin. The ultimate question whether it will sustain or not, last months it has been giving back the returns in the days after. What to monitor? Gold peaking or not. If that’s the case, then we’ll see more strength on ETH.”
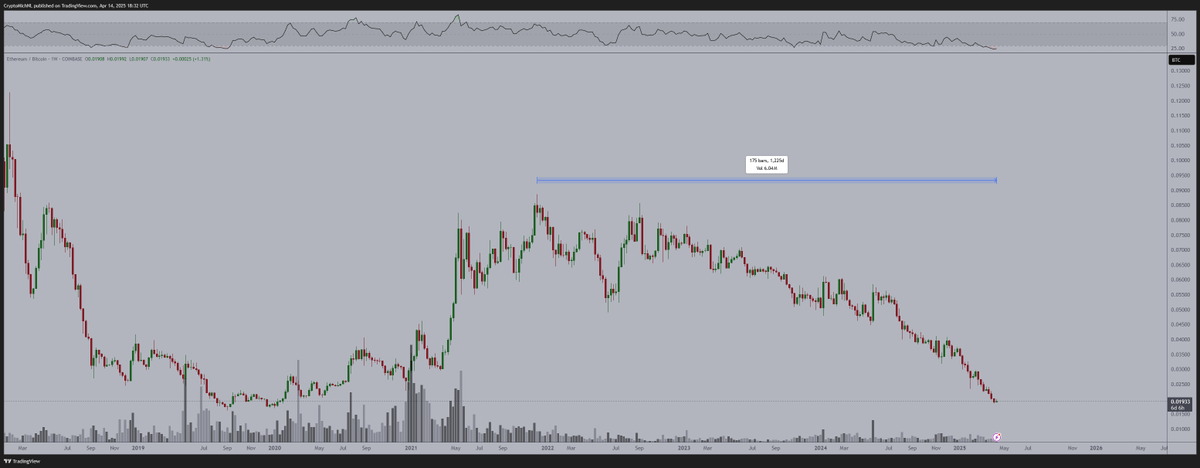
The analyst also says that ETH’s Relative Strength Index (RSI) indicator is flashing bullish, having entered oversold territory.
The RSI is a momentum oscillator used to determine whether an asset is oversold or overbought. The RSI’s values range from zero to 100. A level between 70 and 100 indicates that an asset is overbought. The 0 to 30 level range indicates that an asset is oversold.
“It’s been a bear market for 1,225 days for ETH, as, in this period, gold did a 2x. The lowest RSI on the weekly candle for ETH as well.”
ETH is trading for $1,589 at time of writing, down 2% in the last 24 hours.
Follow us on X, Facebook and Telegram
Don’t Miss a Beat – Subscribe to get email alerts delivered directly to your inbox
Check Price Action
Surf The Daily Hodl Mix
 

Disclaimer: Opinions expressed at The Daily Hodl are not investment advice. Investors should do their due diligence before making any high-risk investments in Bitcoin, cryptocurrency or digital assets. Please be advised that your transfers and trades are at your own risk, and any losses you may incur are your responsibility. The Daily Hodl does not recommend the buying or selling of any cryptocurrencies or digital assets, nor is The Daily Hodl an investment advisor. Please note that The Daily Hodl participates in affiliate marketing.
Generated Image: Midjourney
Source link

Reason to trust
![]()
Strict editorial policy that focuses on accuracy, relevance, and impartiality
Created by industry experts and meticulously reviewed
The highest standards in reporting and publishing
Strict editorial policy that focuses on accuracy, relevance, and impartiality
Morbi pretium leo et nisl aliquam mollis. Quisque arcu lorem, ultricies quis pellentesque nec, ullamcorper eu odio.
Ethereum price started a fresh decline from the $1,690 zone. ETH is now consolidating and might decline further below the $1,580 support zone.
- Ethereum started a fresh decline after it failed to clear $1,700 and $1,720.
- The price is trading below $1,620 and the 100-hourly Simple Moving Average.
- There was a break below a new connecting bullish trend line with support at $1,625 on the hourly chart of ETH/USD (data feed via Kraken).
- The pair could start a fresh increase if it clears the $1,640 resistance zone.
Ethereum Price Faces Rejection
Ethereum price formed a base above $1,550 and started a fresh increase, like Bitcoin. ETH gained pace for a move above the $1,600 and $1,620 resistance levels.
The bulls even pumped the price above the $1,650 zone. A high was formed at $1,690 and the price recently corrected gains. There was a move below the $1,640 support zone. Besides, there was a break below a new connecting bullish trend line with support at $1,625 on the hourly chart of ETH/USD.
The price tested the 50% Fib retracement level of the upward move from the $1,472 swing low to the $1,690 high. Ethereum price is now trading below $1,625 and the 100-hourly Simple Moving Average.
On the upside, the price seems to be facing hurdles near the $1,620 level. The next key resistance is near the $1,640 level. The first major resistance is near the $1,650 level. A clear move above the $1,650 resistance might send the price toward the $1,690 resistance.

An upside break above the $1,690 resistance might call for more gains in the coming sessions. In the stated case, Ether could rise toward the $1,750 resistance zone or even $1,800 in the near term.
More Losses In ETH?
If Ethereum fails to clear the $1,640 resistance, it could start another decline. Initial support on the downside is near the $1,580 level. The first major support sits near the $1,555 zone and the 61.8% Fib retracement level of the upward move from the $1,472 swing low to the $1,690 high.
A clear move below the $1,555 support might push the price toward the $1,525 support. Any more losses might send the price toward the $1,450 support level in the near term. The next key support sits at $1,420.
Technical Indicators
Hourly MACD – The MACD for ETH/USD is gaining momentum in the bearish zone.
Hourly RSI – The RSI for ETH/USD is now below the 50 zone.
Major Support Level – $1,580
Major Resistance Level – $1,640
Source link

‘Big Short’ Investor Steve Eisman Derisks, Says Stock Market Volatility Will Be Here for a While
Dow drops over 500 points as UnitedHealth tanks, Fed tensions weigh on markets

Gold Is Still the Safe-Haven King, While Bitcoin Loses Out: JP Morgan

Dogecoin Price Breakout in view as Analyst Predicts $5.6 high

Bitcoin (BTC) Price in Standstill at $85K as Trump Increases Pressure on Fed’s Powell

Ripple acquisition Hidden Road secures FINRA registration

Ethereum Whales Offload 143,000 ETH In One Week – More Selling Ahead?

How Do We Protect Bitcoin From Quantum Computers? Not With A Joke

OKX Goes Live In The US After Setting Up New Headquarters in San Jose, California

Stanford’s AI research lab to use Theta EdgeCloud for LLM model studies

Central African Republic Solana Meme Coin Jumps as President Fuels Rumors of Revival

Will Shiba Inu Price 3x?

Bitcoin Cash (BCH) Gains 4.2%, Leading Index Higher

Bybit shuts down four more Web3 services after axing NFT marketplace

Aptos To Continue Moving In ‘No Man’s Land’ – Can It Reclaim $5?


 24/7 Cryptocurrency News5 months ago
Arthur Hayes, Murad’s Prediction For Meme Coins, AI & DeFi Coins For 2025

 Bitcoin3 months ago
Expert Sees Bitcoin Dipping To $50K While Bullish Signs Persist

 24/7 Cryptocurrency News3 months ago
Aptos Leverages Chainlink To Enhance Scalability and Data Access

 Bitcoin5 months ago
Bitcoin Could Rally to $80,000 on the Eve of US Elections

 Ripple Price4 weeks ago
3 Voting Polls Show Why Ripple’s XRP Price Could Hit $10 Soon

 Opinion5 months ago
Crypto’s Big Trump Gamble Is Risky

 Altcoins3 months ago
Sonic Now ‘Golden Standard’ of Layer-2s After Scaling Transactions to 16,000+ per Second, Says Andre Cronje

 Bitcoin5 months ago
Institutional Investors Go All In on Crypto as 57% Plan to Boost Allocations as Bull Run Heats Up, Sygnum Survey Reveals

✓ Share: