
24/7 Cryptocurrency News
Is Shiba Inu Price Rally At Risk? Whale Moves 4 Trillion SHIB

Shiba Inu (SHIB) price has been in a bullish rally over the last 24 hours, reaching an intraday high of $0.00002668 before encountering resistance. However, with the Federal Reserve signaling a steady stance on interest rates, some investors are now questioning whether SHIB’s rally can sustain its momentum or if a pullback is on the horizon.
Is Shiba Inu Price Rally at Risk?
A substantial transfer of 4 trillion SHIB tokens, valued at approximately $99 million, occurred between two unknown wallets, stirring speculation in the cryptocurrency community. Large whale transactions often lead to market volatility as they can signal an intention to sell or shift positions.
When whales move massive amounts of tokens, it tends to create anxiety among smaller investors, who fear that these moves might trigger a sell-off.

— Whale Alert (@whale_alert) November 14, 2024
Market analysts suggest that the transfer’s timing, coinciding with the SHIB price recent rally, could lead to increased caution among investors. Post this transaction, SHIB price has nosedived almost 5% with the market capitalization dipping 5.30% to $14.19B.
Federal Reserve’s Cautious Stance on Rate Cuts Impacts Sentiment
Federal Reserve Chairman Jerome Powell recently stated that the U.S. economy shows no immediate signs of requiring rate cuts, allowing the Fed to “approach decisions carefully.” This announcement has dampened expectations of a December rate cut, with CME FedWatch data showing a decline in rate cut probability from 83% to 62%.
Powell’s remarks led to a minor downturn in crypto markets as investors weighed the implications for digital assets, which often benefit from low-interest-rate environments.
Following the speech, Bitcoin dropped by 1.5%, falling to $87,751, while Ethereum and SHIB experienced similar declines, with SHIB slipping 2.5% to $0.00002469. The Fed’s cautious approach may keep some investors away from high-risk assets, potentially slowing SHIB’s upward momentum.
Technical Indicators Suggest Mixed Outlook for SHIB
Technical analysis shows that SHIB is currently facing significant resistance around the $0.00002600 level. This price point has acted as a barrier in recent days, with SHIB struggling to maintain momentum beyond this threshold. On the downside, SHIB has support at approximately $0.00002480, where the price has consistently rebounded in past sessions.
The 50-day Simple Moving Average (SMA) has risen above the 200-day SMA, forming a “Golden Cross,” which is generally seen as a bullish signal. However, the Relative Strength Index (RSI) at 66.59 indicates that SHIB is nearing overbought conditions, suggesting that the current rally could be due for a correction. Meanwhile, the Money Flow Index (MFI) at 47.32 shows moderate buying pressure, pointing to a balanced market sentiment without a clear directional bias.

Amid this price downturn, trading volume for SHIB has decreased by over 50%, suggesting reduced interest or activity in SHIB derivatives, which could signal diminishing momentum. Additionally, open interest in SHIB contracts has declined by nearly 3%, hinting that traders may be closing positions rather than opening new ones.
Despite this, Shiba Inu’s marketing lead, Lucie, has expressed confidence in the token’s potential, predicting a possible rally to $0.00006. Concurrently, according to a Shiba Inu price prediction should this bullish momentum build up, a rally towards reach $0.0001 may be looming.
Kelvin Munene Murithi
Kelvin is a distinguished writer with expertise in crypto and finance, holding a Bachelor’s degree in Actuarial Science. Known for his incisive analysis and insightful content, he possesses a strong command of English and excels in conducting thorough research and delivering timely cryptocurrency market updates.
Disclaimer: The presented content may include the personal opinion of the author and is subject to market condition. Do your market research before investing in cryptocurrencies. The author or the publication does not hold any responsibility for your personal financial loss.
Source link


A large Ripple whale has moved 29,532,534 XRP, valued at $63.81 million, from an unknown wallet to Coinbase. This Ripple whale transfer comes at a time when XRP is making waves in the cryptocurrency market, positioning itself as one of the top candidates for a U.S. spot ETF approval.
XRP’s increasing liquidity and recent developments have placed it in direct competition with Solana (SOL) for ETF approval, with analysts predicting XRP may secure approval sooner than its rivals.
XRP’s Growing Liquidity Boosts ETF Prospects
XRP has shown a marked improvement in liquidity over the past few months, positioning itself as a strong contender for a U.S. spot ETF. A study of market depth done by Kaiko Indices shows that XRP and Solana have the deepest 1% market depth on vetted exchanges. XRP’s liquidity has increased since late 2024, outperforming that of Solana and even risen to two times that of Cardano’s ADA.
Several events have enhanced XRP’s liquidity, such as Teucrium’s launching of a 2x XRP ETF in the recent past. This leveraged product tracks European ETPs and swap agreements, offering double the daily returns of XRP.
On the launch date, it traded above $5 million, becoming the best-performing fund for the Teucrium Fund Company. Such momentum brings XRP the vital support for its objective to establish a place in the approval process for the U.S. spot ETF.

Despite the absence of a robust futures market, as seen in BTC, XRP has gradually made an increased impression in the US spot market. This triggered the token’s market share to go to the highest level since the SEC lawsuit in 2021, which triggered multiple delistings.
In this regard, Solana’s market share has decreased to 16% from the 25-30% recorded in 2022. According to analysts, XRP continues to trade significantly in the spot market, which could pave the way for approval soon.
Ripple’s Push for ETF Approval
The SEC has approved various filings for XRP spot ETFs, with a key deadline for Grayscale’s amendment scheduled for May 22. Additional good news came from the regulatory channel, confirming Paul Atkins as the new SEC Chair. Since several deadlines are set for the ETFs in the cryptocurrency market, Atkins’ leadership could determine the fate of XRP and other assets.
XRP’s situation differs from Bitcoin’s, as it lacks a robust futures market, making the cryptocurrency’s regulatory landscape more complex. However, rising liquidity and introducing the 2x XRP ETF have shifted the narrative firmly towards Ripple’s token. Therefore, the steps taken by the SEC in reaction to Grayscale’s filing will set the direction through which XRP may or may not get approval.
Despite this, according to data from Polymarket, there is a 74% chance that XRP will be approved for a spot ETF by December 31, 2025. However, there is still cautious optimism in the option market for XRP.
Data from Deribit reveals an abundance of bear call options, indicating that traders mainly hedge against further downside. This is partly due to worries from the broader market, such as macroeconomic issues that may affect crypto assets, like the Trump tariffs.
XRP Price Trend Amid Ripple Whale Moves
Looking at the technical analysis of the XRP price, there are indications of purely bullish opportunities. According to crypto analyst TheDefilink, XRP price is presently trading above key support levels on the daily charts, and as signified by the Ichimoku Cloud, the trend remains bullish.
In addition, large token transfers mean that Ripple whales are active on the market. The latest 29 million XRP transferred to Coinbase, alongside the 70 million XRP transfer between two unknown wallets, also depicts interest in XRP.
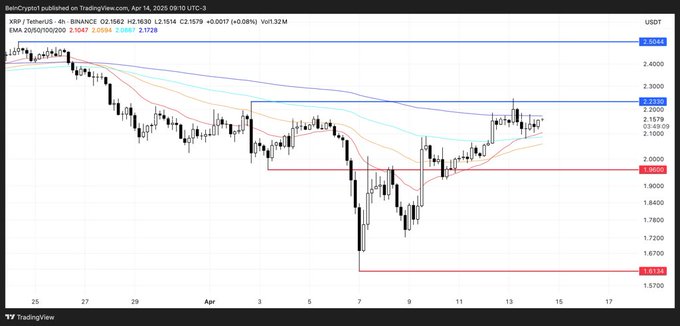
Additionally, the tightening of XRP’s Exponential Moving Averages (EMAs) suggests a potential golden cross could be forming, a pattern often associated with upward price movements.
According to the analyst, XRP price resistance levels are $2.23 and $2.50, with support levels at $1.96 and $1.61. A successful move above the $2.23 resistance could further energize the bullish sentiment surrounding XRP, aligning with a recent CoinGape XRP price analysis.
However, failure to hold the $1.96 support level might lead to a shift in market sentiment, potentially triggering a bearish correction in the short term.
Kelvin Munene Murithi
Kelvin is a distinguished writer with expertise in crypto and finance, holding a Bachelor’s degree in Actuarial Science. Known for his incisive analysis and insightful content, he possesses a strong command of English and excels in conducting thorough research and delivering timely cryptocurrency market updates.
Disclaimer: The presented content may include the personal opinion of the author and is subject to market condition. Do your market research before investing in cryptocurrencies. The author or the publication does not hold any responsibility for your personal financial loss.
Source link

Despite being the second biggest cryptocurrency, Ethereum has witnessed the worst quarterly price performance of 5 years in Q1 2025. With continuous bears’ dominance and macroeconomic events putting downward pressure on the altcoin, it is down significantly. However, that might change as the ETH price chart shows a bullish sign.
Ethereum Price Up for Rally As Buying Signal Flashes
Ethereum’s downtrend resulted in the token’s crashing to a low of $1,400 earlier in the month. Experts have attributed this fall to investors’ bearish sentiments and the overall crypto market crash. However, the Ethereum price drop against Bitcoin to its lowest in years indicates underlying performance issues.
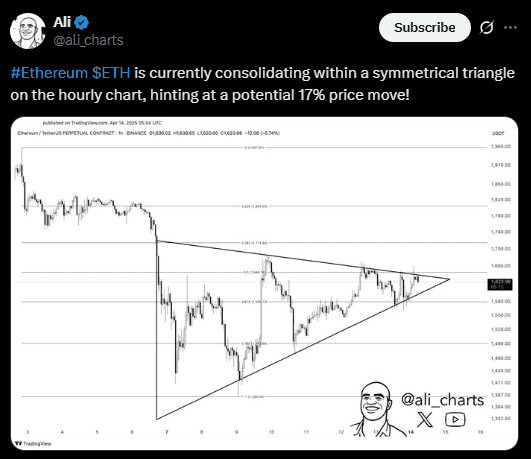
While the selling sentiments remain, a buy signal has formed in the ETH price chart, presenting the possibility of a rebound. According to the crypto analyst Ali Martinez’s X post, the TD sequential indicator is presenting Setup 9, i.e., an indicator of trend reversal.
ETH may be gearing up for a major rebound, with the TD Sequential flashing a buy signal on the weekly chart!

The “9” is historically proven to mark the end of the bearish trend and present buying opportunities. Moreover, the smaller body size of the candle suggests weakening selling pressure and traders opting to buy.
Besides, no major resistance near the chart exists, so a smooth uptrend can form unless any major macroeconomic event interferes.
Symmetrical Triangle Formation Supports Ethereum Price’s Bullish Outlook
With a 3% recovery over the week, Ethereum currently trades at $1,639.91 with a market capitalization of $197.88B. Although the recovery is slow, the token moves in a symmetrical triangle formation, simultaneously opening the possibility of an uptrend or a downtrend.
If the ETH price moves up, it could rally to $1,900, but a downside move could result in a crash to $1,380. Although uncertainty remains amid Trump’s tariff trade war, the long-term bullish Ethereum price prediction is sustained.
Considering the same, a crypto whale has just opened a $12.6M ETH Long with 5x leverage, influencing investors’ sentiments.
Frequently Asked Questions (FAQs)
Persistent berish investor sentiments, broader crypto market crash, and macroeconomic events drive the poor performance of Ethereum.
After a 3% recovery during the week, Ethereum currently trades at $1,639.91 but could hit $1,900 with the confirmation of bullish momentum.
The ETH price chart shows that investors’ buying interest is rising and selling sentiments are declining. Even whales are placing long leverage, showcasing rising confidence in the altcoin.
Pooja Khardia
With a deep-seated passion for reading and five years of experience in content writing, Pooja is now focused on crafting trending content about cryptocurrency market. As a dedicated crypto journalist, Pooja is constantly seeking out trending topics and informative statistics to create compelling pieces for crypto enthusiasts. Staying abreast of the latest trends and advancements in the field is an integral part of her daily routine, fueling a commitment to delivering timely and insightful coverage
Disclaimer: The presented content may include the personal opinion of the author and is subject to market condition. Do your market research before investing in cryptocurrencies. The author or the publication does not hold any responsibility for your personal financial loss.
Source link
The price of XRP is in consolidation mode as the broader market has maintained its broad-based fluctuations. While retaining its spot as a top-three digital currency, XRP’s growth path was initially derailed; however, the current outlook suggests the growth potential remains intact. As of writing, the coin’s price was trading for $2.128, up by 1.52% in the past 24 hours.
XRP Price and Conflicting Data Trends
The coin’s growth path has not been particularly straightforward in the past 24 hours. By printing lower lows and lower highs, it has been largely difficult to determine its next direction. The 1.43% surge in the past 24 hours is a decoy, as XRP is currently below its highest level of $2.174, which it attained for the day.
Meanwhile, XRP has maintained a positive outlook over the past seven days, with its price up by 11.72% during this period. Key performance metrics tied to the Ripple-backed coin also show a conflicting trend. Earlier XPR price analysis signaled a possible death cross amid the conflicting trend
The trading volume dropped by 13% in 24 hours to $3,439,251,046.17. At its peak, it topped $4 billion in 24 hours. The Open Interest data from Coinglass also shows a 5.3% slump. With this drawdown, only 1.45 billion XRP, valued at $3.1 billion, was committed in the futures market.
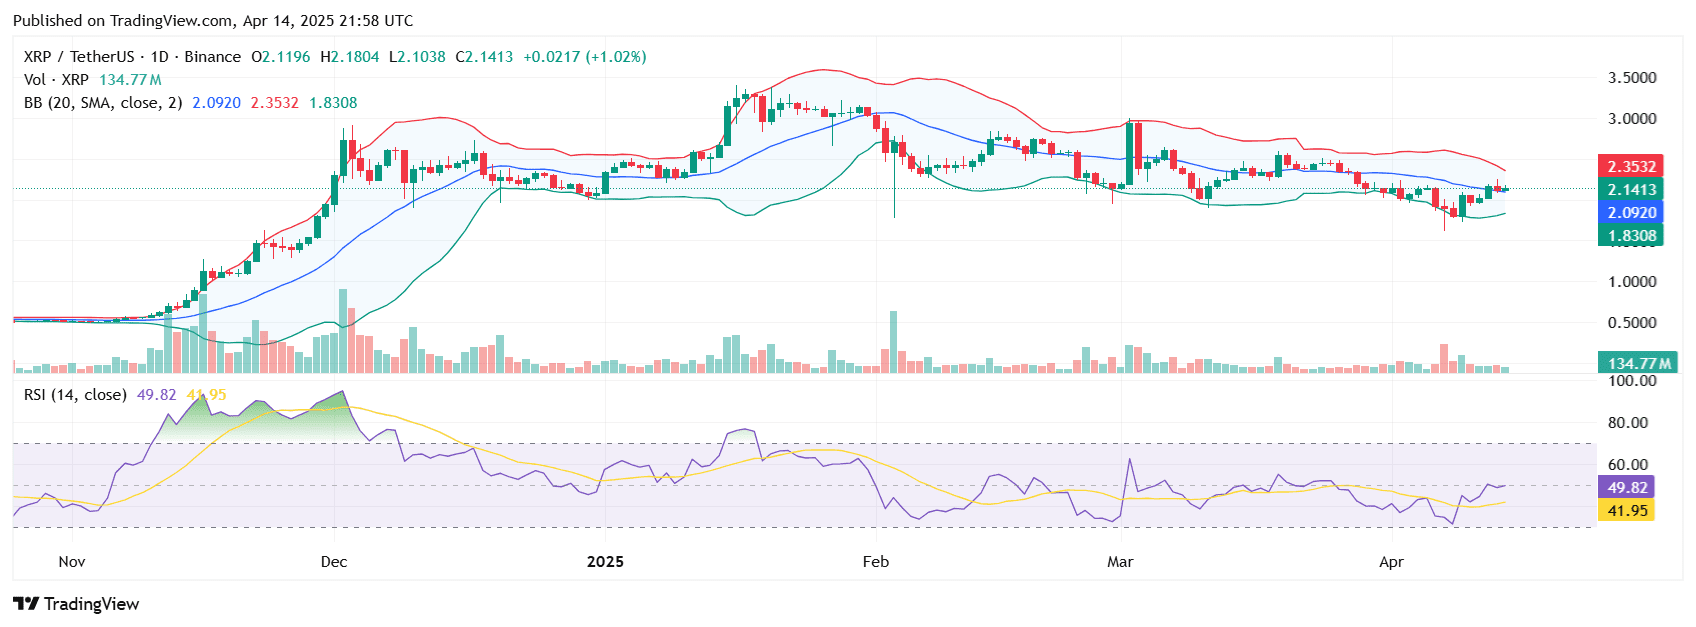
While these show reduced interest in spot and futures markets, the XRP price has remained resilient. The XRP/USDT daily chart shows a neutral Relative Strength Index (RSI) at 49. This is proof that the selling pressure has slowed down.
Per the chart, the Bollinger Bands also shows reduced volatility for the coin.
What Next for the Ripple Coin?
The fate of the top coin is still tied to the broader industry trend. There are signs it might print a solo breakout soon.
In CoinShares’ digital asset report for the past week, only XRP recorded an inflow, while Bitcoin and Ethereum recorded outflows. This signals resilience with the asset among institutional investors, a trend that might contribute to a potential price rebound if sustained.
Part of the possible trend that may impact XRP price moving forward is the hype around Ripple Labs and its business expansion. Recently, Ripple acquired Hidden Road, a prime brokerage firm, to enter the mainstream financial market. As detailed, XRP and RLUSD are on track to play a role, a move that may boost their valuation.
Godfrey Benjamin
Disclaimer: The presented content may include the personal opinion of the author and is subject to market condition. Do your market research before investing in cryptocurrencies. The author or the publication does not hold any responsibility for your personal financial loss.
Source link

AVAX Falls 2.1% as Nearly All Assets Trade Lower

What is a VTuber, and how do you become one in 2025?

Top Expert’s Update Sets $10 Target

How Academia Interacts With The Bitcoin Ecosystem

AB DAO and Bitget Launch Dual Reward Campaign, Distributing $2.6M Worth of $AB Globally

AI crypto tokens at risk as Nvidia faces restrictions on China exports

Coinbase Urges Australia to Vote for Crypto Progress in May

How High Would Pi Network Price Go If Pi Coin Adopts Transparency to Avoid Mantra Pitfalls

XRP’s ‘Rising Wedge’ Breakdown Puts Focus on $1.6 Price Support

China selling seized crypto to top up coffers as economy slows: Report

Ethereum Price Dips Again—Time to Panic or Opportunity to Buy?

The Inverse Of Clown World”

Bitcoin Indicator Flashing Bullish for First Time in 18 Weeks, Says Analyst Who Called May 2021 Crypto Collapse

3iQ and Figment to launch North America’s first Solana staking ETF

Bitcoin Miners Are Selling More BTC to Make Ends Meet: CryptoQuant


 24/7 Cryptocurrency News5 months ago
Arthur Hayes, Murad’s Prediction For Meme Coins, AI & DeFi Coins For 2025

 Bitcoin3 months ago
Expert Sees Bitcoin Dipping To $50K While Bullish Signs Persist

 24/7 Cryptocurrency News3 months ago
Aptos Leverages Chainlink To Enhance Scalability and Data Access

 Bitcoin5 months ago
Bitcoin Could Rally to $80,000 on the Eve of US Elections

 Opinion5 months ago
Crypto’s Big Trump Gamble Is Risky

 Altcoins3 months ago
Sonic Now ‘Golden Standard’ of Layer-2s After Scaling Transactions to 16,000+ per Second, Says Andre Cronje

 Bitcoin5 months ago
Institutional Investors Go All In on Crypto as 57% Plan to Boost Allocations as Bull Run Heats Up, Sygnum Survey Reveals

 Price analysis5 months ago
Ripple-SEC Case Ends, But These 3 Rivals Could Jump 500x

✓ Share: