
Bitcoin price
Key Levels to Watch as BTC Crashes Below $100K Today
Bitcoin (BTC) price traded as low as $91,231 on Binance on Monday Morning, as crypto markets buckle under pressure from escalating trade tariff war involving the United States.
Bitcoin (BTC) Plummets to $91K as Crypto Market Liquidations Hit $1.8 Billion
Bitcoin (BTC) plunged below the $91,200 mark on February 3, its lowest level in 20 days. This decline follows mounting economic concerns sparked by former U.S. President Donald Trump’s aggressive trade tariffs on China, Mexico, and Canada, which have triggered widespread financial market turbulence.
As fears of rising consumer prices escalate, social media reports suggest that American consumers are preparing for inflation by stockpiling essential goods. This has led to a shift in retail investor sentiment, with many liquidating riskier assets such as stocks and cryptocurrencies in favor of more stable stores of value.

As depicted above, Crypto market liquidations have exceeded $1.8 billion as BTC price plunged 7% in the last 24 hours, signaling unusually heavy capitulation from large investors.
This suggests that Bitcoin institutional investors are also responding to inflation risks, anticipating that the U.S. Federal Reserve may be forced to raise interest rates sooner than expected.
This has led many to shift capital toward government bonds before interest rate hikes push prices higher. Combined, these factors have exacerbated selling pressure in the crypto market, driving Bitcoin’s price down by 11% over the past three days.
Key Bitcoin (BTC) Price Levels to Watch
Amid the ongoing crypto market downturn, some crucial BTC trading signals indicate key levels that could be pivotal to Bitcoin price action as the week progresses.
Coinglass Liquidation Map Shows BTC’s Strongest Support Level Lies at $90,360
Bitcoin started the week under pressure due to the bearish sentiment surrounding the escalating trade war. Many U.S.-based traders likely set sell orders over the weekend, anticipating further downward movement as markets opened on Monday. This could result in heightened volatility in the early trading hours.
Coinglass’ liquidation map provides insight into the critical price levels where traders have placed leveraged positions. The chart displays Bitcoin’s aggregated leverage positions over the last 30 days, revealing key areas where liquidation events are likely.

The data suggests that bearish sentiment dominates, with $11.9 billion in short positions far exceeding the $3.04 billion in long positions. This confirms expectations of further downside risk.
However, bullish traders have concentrated $2.12 billion in leverage at the $90,358 level, accounting for 70% of total long leverage positions. This indicates strong potential support around $90,500, as traders seek to defend their positions from liquidation losses.
Other key support zones include $93,000 and $94,330, where long positions total $1 billion and $330 million, respectively. If Bitcoin’s price approaches these levels, we could see increased buying activity aimed at stabilizing the market.
Nevertheless, a prolonged bearish trend could persist unless global economic conditions improve or influential market participants intervene to stabilize sentiment.
The Double-Bottom Pattern Signals a Potential Breakout Toward $108,000
While the prevailing market sentiment remains bearish due to macroeconomic pressures, certain technical indicators suggest the possibility of a Bitcoin price recovery. The double-bottom pattern observed in recent trading activity hints at a potential breakout target of $108,000, provided market sentiment shifts positively.
Savvy investors might capitalize on the current price dip, increasing their Bitcoin holdings around the $90,300, $93,000, and $94,300 support levels. Some Bitcoin maximalists believe that prolonged trade tensions could drive sovereign entities to seek BTC as an inflation hedge. Notably, the Czech Republic and Bhutan have recently explored Bitcoin acquisitions, and U.S. states and corporations may increasingly turn to blockchain solutions to circumvent trade barriers.
Bitcoin Price Forecast: Can BTC Rebound to $108K?
From a technical analysis standpoint, Bitcoin price forecast shows BTC trading near recent significant lows highlighted double-bottom pattern, which often precedes a bullish breakout.
In terms of key levels to watch, BTC must maintains support above $90,500 to keep alive rebound hopes of reclaiming the $96,150 territory. If the trade war sparks a BTC buying frenzy among nations and institutions, the ensuing BTC price recovery could gain enough momentum to test the $102,000-$105,000 range. A sustained rally above these levels could open the door to the $108,000 breakout target.

The Bollinger Bands indicator also highlights key resistance levels that Bitcoin must overcome to reclaim bullish momentum. The upper band suggests significant resistance at $105,800, followed by a more substantial barrier near $108,000. If Bitcoin can consolidate above these levels, it may establish a new bullish trend, counteracting the recent downturn.
In Summary:
While Bitcoin’s 11% decline in 3 consecutive losing days has rattled investors with $1.8 billion market liquidations. However, key technical indicators point to potential support around $90,500 and possible recovery scenarios. The ongoing trade war and economic uncertainty continue to influence market sentiment, but long-term investors and institutional players could take advantage of lower prices. Should positive sentiment return, Bitcoin could break out toward $108,000, reinforcing its status as a politically-neutral asset.
Frequently Asked Questions (FAQs)
Bitcoin’s decline is linked to global economic uncertainty, including the U.S.-Canada trade war, rising inflation concerns, and mass market liquidations.
The strongest BTC support level lies at $90,360, with additional support at $93,000 and $94,330, where leveraged long positions are heavily concentrated.
If Bitcoin holds the $90,500 support and market sentiment improves, the double-bottom pattern suggests a potential breakout toward $108,000.
ibrahim
Disclaimer: The presented content may include the personal opinion of the author and is subject to market condition. Do your market research before investing in cryptocurrencies. The author or the publication does not hold any responsibility for your personal financial loss.
Source link


Reason to trust
![]()
Strict editorial policy that focuses on accuracy, relevance, and impartiality
Created by industry experts and meticulously reviewed
The highest standards in reporting and publishing
Strict editorial policy that focuses on accuracy, relevance, and impartiality
Morbi pretium leo et nisl aliquam mollis. Quisque arcu lorem, ultricies quis pellentesque nec, ullamcorper eu odio.
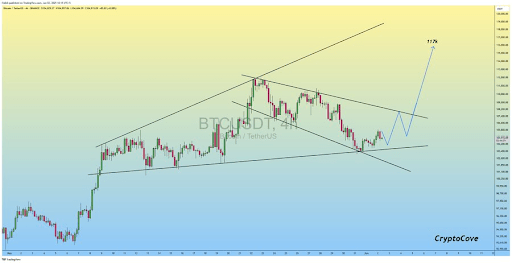
The Bitcoin price crash is in focus following the flagship crypto’s recent drop to as low as $103,700. Crypto analyst Captain Faibik has commented on why $107,500 and $103,500 are the most important levels to watch as BTC looks to decide its next move.
Why $107,500 & $103,500 Are Key For The Bitcoin Price
In an X post, Captain Faibik explained that $107,500 and $103,500 are key as the bulls and bears battle to dictate the next move for the Bitcoin price. The analyst noted that later this week, BTC bulls will attempt to reclaim the $107,500 resistance and regain momentum.
Related Reading
He predicted that a clean break and hold above $107,500 could trigger a bullish leg toward the $117,000 level, which would mark a new all-time high (ATH) for the flagship crypto. Meanwhile, on the other hand, $103,500 is an important support level which the bulls must defend as the Bitcoin price eyes new highs. Captain Faibik warned that a breakdown below could shift momentum back in favor of the bears.
The Bitcoin price had surged above $106,000 on May 2 following news about the US decision to extend its pause of tariffs on some Chinese goods to August. This provided a bullish outlook for the flagship crypto after Donald Trump stated last week that China had violated the trade deal with the US.
Trump and China’s president are set to have a call later this week, which could further boost the Bitcoin price if both sides could resolve any dispute regarding the current trade deal. Meanwhile, Fed Chair Jerome Powell failed to discuss the economy during his speech at the International Finance Division Anniversary Conference, which also continues to fuel market uncertainty.
First Step For BTC Is To Get Back Above $106,500
In an X post, crypto analyst Kevin Capital indicated that the first step is for the Bitcoin price to successfully reclaim $106,500. He noted that BTC had recorded a weekly close below this level, which puts the flagship crypto back in the danger zone. The analyst further remarked that BTC needs to get back above this level in the coming days or things can get “sketchy looking.” Kevin Capital added that this has been a key level for months, and nothing has changed.
Related Reading
Meanwhile, crypto analyst Titan of Crypto revealed that a Katana is forming on the weekly chart for the Bitcoin price. He explained that in Ichimoku analysis, a Katana forms when Tenkan and Kijun overlap. This signals low momentum and market equilibrium. He added that this development also precedes strong directional moves, with an expansion or pullback on the horizon.
At the time of writing, the Bitcoin price is trading at around $105,435, up in the last 24 hours, according to data from CoinMarketCap.
Featured image from Getty Images, chart from Tradingview.com
Source link
Reason to trust
![]()
Strict editorial policy that focuses on accuracy, relevance, and impartiality
Created by industry experts and meticulously reviewed
The highest standards in reporting and publishing
Strict editorial policy that focuses on accuracy, relevance, and impartiality
Morbi pretium leo et nisl aliquam mollis. Quisque arcu lorem, ultricies quis pellentesque nec, ullamcorper eu odio.
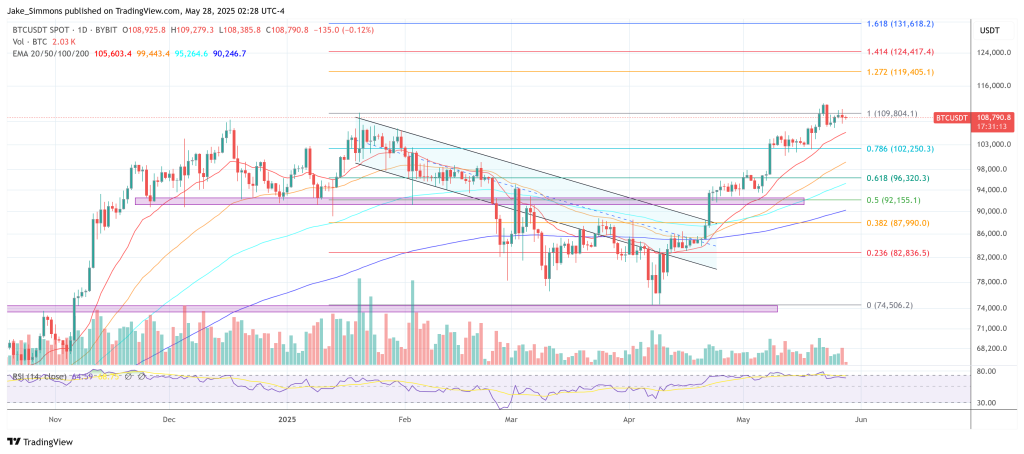
US Treasury Secretary Scott Bessent has signalled that the long-debated overhaul of banks’ supplementary leverage ratio (SLR) is imminent—a policy pivot that could reverberate through Bitcoin markets—telling television interviewers that regulators are “very close to moving” on the rule and that the adjustment could compress Treasury yields by “tens of basis points.”
Rocket Fuel For Bitcoin
Although the proposal must still clear the Federal Reserve, the Office of the Comptroller of the Currency and the FDIC, the direction of travel is clear: exempting, or partially exempting, US Treasuries from the SLR will let large banks recycle balance-sheet capacity into fresh purchases of government debt.
The SLR, introduced after the 2008–2009 crisis, forces even risk-free assets such as Treasuries to carry a capital charge; a global systemically important bank must fund five cents of equity for every dollar of total assets, including central-bank reserves. Bessent’s plan would lift that burden for sovereign bonds, a step the industry has lobbied for since the temporary pandemic waiver expired in March 2021. Kevin Fromer, chief executive of the Financial Services Forum, calls the current leverage-based stack “outdated and at odds with financial stability and economic growth,” describing relief as necessary “to better serve US taxpayers, capital markets, consumers, businesses, and the economy.”
Related Reading
While officials frame the move as a micro-prudential calibration, the macro-liquidity impulse is substantial. Market commentator Furkan Yildirim tells his 103,000 subscribers that US banks collectively hold about $5 trillion in Treasuries; eliminating the five-percent capital haircut would liberate roughly $250 billion of tier-one capital—fifty times the Federal Reserve’s current monthly quantitative-tightening pace of $5 billion. “This is a liquidity injection by regulatory pen stroke,” he says, adding that the step “lowers yields without the Fed printing money,” a mix that historically pushes investors further out the risk curve.
The market is already trading on that expectation. Benchmark ten-year yields slid below 3.95 percent after Bessent’s remarks and after President Trump deferred a threatened 50 percent tariff on EU goods until 9 July. Yildirim argues that “every basis-point drop in the ten-year is basically a marketing campaign for Bitcoin,” because “liquidity doesn’t disappear—it just looks for a new home.” He stresses that the Treasury’s willingness to change bank-capital rules, rather than rely on the central bank, “tells you how cornered policymakers feel by deficits, debt service and political optics.”
Related Reading
Not everyone is convinced the rule change will work as intended. Critics such as Peter Boockvar of Bleakley Advisory note that banks’ appetite for duration risk has not fully recovered since the 2023 regional-bank failures; if dealers fail to absorb the incremental Treasury supply, the Federal Reserve could be forced back into the market. The Bank Policy Institute, while welcoming SLR relief, argues that it must be paired with a broader rethink of post-crisis overlays such as the GSIB surcharge and the stress-test regime to unlock balance-sheet capacity on a lasting basis.
Bitcoin, however, responds reflexively to dollar-liquidity metrics. Lower Treasury yields diminish the allure of money-market funds paying north of five percent, releasing capital that has been parked in cash-equivalent vehicles since 2022. On-chain data highlighted by Yildirim show over-the-counter (OTC) desk inventories sliding to 115,000 BTC, evidence that large buyers are sourcing coins directly; when that stock is depleted, desks must restock from public exchanges, a dynamic that tightens float and historically amplifies upside moves.
Ultimately the SLR reprieve is no panacea for America’s fiscal arithmetic, but it removes a near-term balance-sheet choke point and lowers the opportunity cost of holding non-yielding assets. As Yildirim puts it, “A deregulation that stabilises sovereign funding while nudging investors into risk assets is, almost by definition, a tailwind for Bitcoin.” In that sense the rule change functions like shadow quantitative easing, arriving at a moment when the Federal Reserve is hamstrung by sticky inflation and political constraints—one more structural catalyst for Bitcoin.
At press time, BTC traded at $108,790.
Featured image created with DALL.E, chart from TradingView.com
Source link

Reason to trust
![]()
Strict editorial policy that focuses on accuracy, relevance, and impartiality
Created by industry experts and meticulously reviewed
The highest standards in reporting and publishing
Strict editorial policy that focuses on accuracy, relevance, and impartiality
Morbi pretium leo et nisl aliquam mollis. Quisque arcu lorem, ultricies quis pellentesque nec, ullamcorper eu odio.
Bitcoin finally broke through its all-time highs this week, reaching $112,000 and holding firm above the key psychological level of $100,000. After weeks of steady momentum and bullish consolidation, the breakout marks a major shift in market structure, confirming that bulls are now in full control. The move has reignited optimism across the market, with sentiment turning decisively positive as BTC enters price discovery once again.
Related Reading
The breakout wasn’t just technical—it was backed by strong positioning across derivatives markets. According to data from Coinglass, Bitcoin’s weekly liquidation heatmap reveals a dense cluster of liquidity around the $105,700 level. This area could act as a magnet in the short term, with some traders expecting a brief sweep into that zone before BTC resumes its upward trajectory.
This environment now favors bulls, with both technical levels and on-chain data aligning to support further upside. As long as Bitcoin continues to close above $100K and dips remain shallow, the path of least resistance appears to be higher. With liquidity, momentum, and macro sentiment aligning, the coming weeks could be critical as BTC sets the tone for the rest of the market—and potentially the start of a full-blown bullish phase.
Bitcoin Remains Strong Amid Tight Conditions
Bitcoin posted another bullish week, reaching a new all-time high of $112,000 before pulling back slightly to hold above the key $100,000 level. Despite the strength, market sentiment has yet to flip fully euphoric. A cautiously bullish tone dominates as macroeconomic conditions remain tight, with high US Treasury yields and growing instability in global trade continuing to weigh on risk assets.
Unlike many altcoins, which are still trading well below their previous cycle highs, Bitcoin appears to be thriving in this high-stress environment. Its resilience is being closely watched, as capital continues to favor BTC over smaller, more volatile assets. This relative strength reinforces Bitcoin’s status as a macro hedge, especially in uncertain economic conditions.
Top analyst Ted Pillows added to the discussion by highlighting data from Coinglass, which shows significant liquidity sitting around the $105,700 level on the BTC weekly liquidation heatmap. According to Pillows, this cluster could serve as a short-term magnet, suggesting that a quick sweep of that zone may occur before Bitcoin resumes its upward move.

“Liquidity at $105K is thick. A dip into that area could clear out late longs before the next leg higher,” he noted.
With Bitcoin holding key levels and sentiment remaining grounded, the setup is favorable for continuation, but not without potential volatility. If BTC can defend the $100K–$105K range and reclaim $110K, the next push toward new highs may arrive sooner than expected. For now, bulls remain in control, but traders are staying alert as global markets remain on edge.
Related Reading
BTC Holds Above Key Averages
Bitcoin is trading at $108,249 on the 4-hour chart after a strong push to $112,000 earlier in the week. The chart shows BTC currently consolidating above a confluence of key moving averages, including the 34 EMA ($108,046), 50 SMA ($106,840), and 100 SMA ($105,109), all of which are trending upward. These levels now serve as dynamic support zones, keeping the short-term structure bullish as long as price remains above them.
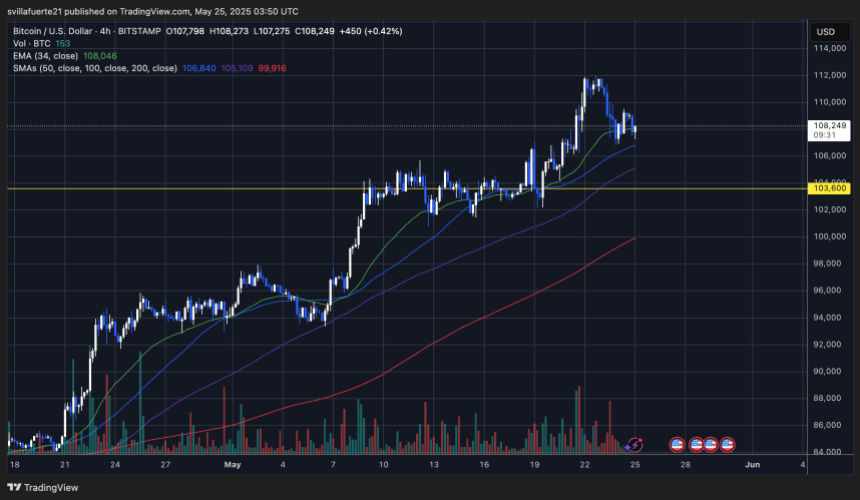
Despite the rejection near $112K, BTC has avoided any aggressive selloff and continues to respect the mid-range levels of its recent breakout. The $103,600 level, marked in yellow, is a key horizontal support and previously acted as a resistance ceiling. It now provides a strong base if any deeper correction occurs.
Volume has declined during this pullback phase, indicating that the selling pressure is likely corrective rather than the start of a trend reversal. If bulls can maintain control above $106K and reclaim momentum above $110K, a retest of the recent highs is likely.
Related Reading
For now, the 4-hour trend remains intact. All eyes are on whether Bitcoin can hold above the clustered support and continue building a base for the next leg higher.
Featured image from Dall-E, chart from TradingView
Source link
Ethereum Price Headed For Crash To $2,000 With Current Price Action
Tokenized funds hit $5.7B, scaling fast — Moody’s
Authorities Warn of Phony Text Messages Phishing for Sensitive Information, Telling Victims Their Bank Account Is at Risk
Tether invests in Chilean crypto exchange Orionx

MARA Hits Record-High Bitcoin Production in May
Retail investors no longer FOMO into BTC, altcoins
AVAX Rises 3.8% on Strong Volume, Breaking Key Resistance Levels

K33 begins Bitcoin buying with 10 BTC purchase for treasury strategy
Why $107,500 And $103,500 Are The Levels To Watch
Pakistan Proposes New Crypto Regulations
Japanese Bitcoin Hoarder Metplanet Adds $115,600,000 Worth of BTC As Stock Surpasses 263% Gains on the Year
Bitcoin traders anticipate decline, watch $100K
Ethereum Foundation Restructures R&D Division, Plans ‘Rethink’ on Design and Development
Here’s why Sophon crypto rallied over 40% today
BCB Strikes Deal with SocGen–FORGE to Distribute Euro-Pegged Stablecoin EURCV


 24/7 Cryptocurrency News7 months ago
Arthur Hayes, Murad’s Prediction For Meme Coins, AI & DeFi Coins For 2025

 Markets3 months ago
Pi Network coin to $10? 4 catalysts that may make it possible

 Ripple Price3 months ago
3 Voting Polls Show Why Ripple’s XRP Price Could Hit $10 Soon

 Bitcoin5 months ago
Expert Sees Bitcoin Dipping To $50K While Bullish Signs Persist

 24/7 Cryptocurrency News5 months ago
Aptos Leverages Chainlink To Enhance Scalability and Data Access

 Bitcoin7 months ago
Bitcoin Could Rally to $80,000 on the Eve of US Elections

 Opinion7 months ago
Crypto’s Big Trump Gamble Is Risky

 Bitcoin4 months ago
The Future of Bitcoin: Scaling, Institutional Adoption, and Strategic Reserves with Rich Rines

✓ Share: