
Bitcoin
MicroStrategy Adds 55,500 More BTC To Its Portfolio For $5.4 Billion
Business intelligence firm MicroStrategy has significantly increased its Bitcoin (BTC) purchases this month in response to the bullish sentiment following President-elect Donald Trump’s victory on November 5. The company’s recent acquisitions have pushed its total Bitcoin holdings to approximately $38 billion.
Convertible Notes Fuel Massive Bitcoin Purchase
On November 25, co-founder Michael Saylor announced via social media that MicroStrategy had acquired 55,500 BTC between November 18 and November 24 for $5.4 billion.
This purchase was funded by proceeds from a $3 billion convertible note issuance and sales of common shares, as detailed in a filing with the US Securities and Exchange Commission (SEC).
Related Reading
Since beginning its Bitcoin acquisition strategy in 2020, Saylor has shifted from using corporate cash to a more complex funding model that involves selling convertible debt and shares.
The latest convertible note was issued at a zero percent interest rate, reflecting lenders’ confidence that MicroStrategy’s stock will appreciate beyond the conversion price in the future.
Jeffrey Park, a portfolio manager at Bitwise Asset Management, noted that Saylor has effectively leveraged financial arbitrage within the corporate treasury structure, allowing MicroStrategy to borrow funds at virtually no cost.
Saylor also revealed that MicroStrategy’s treasury operations have yielded a substantial 59.3% in Bitcoin returns year-to-date, translating to a net gain of approximately 112,125 BTC for shareholders, or about 341 BTC per day.
At a projected price of $100,000 per BTC, Saylor stated that this could mean an impressive $11.2 billion for the year, equating to roughly $34.1 million daily.
Analyst Warns Of Risks In Leverage Strategy
Since its foray into Bitcoin, MicroStrategy has acquired a total of 386,700 tokens, with an average purchase price significantly lower than its current market value.
The latest acquisitions occurred while Bitcoin prices were nearing all-time highs, with the company purchasing the new tokens at approximately $97,862 each, slightly above their current trading price.
Related Reading
However, this leveraged strategy has raised concerns among some analysts, particularly after MicroStrategy’s shares (MSTR) fell by 16% last Thursday.
Critics warn that if Bitcoin’s price declines sharply, the company’s stock could suffer similarly, recalling the downturn in 2022 when the cryptocurrency market experienced significant losses.
TD Cowen analyst Lance Vitanza remarked on the risks associated with leverage, stating, “When you apply leverage to anything, you amplify the returns both in the up direction and in the down direction.” He emphasized that MicroStrategy is a pioneer in applying this leverage strategy specifically to Bitcoin.
At the time of writing, the market’s leading crypto is trading at $95,350, registering a price decrease of 1.7% in the 24-hour time frame.
Featured image from DALL-E, chart from TradingView.com
Source link


Bitcoin: The Inverse of Clown World by Knut Svanholm and Luke de Wolf, Lemniscate Media, 175 pages, $25.00.
This is a book review from The Mining Issue of Bitcoin Magazine Print. Get your copy here.
—
There is a similarity across the Bitcoin books published this [last] summer: They’re all about self-improvement and spiritual development. As a community, we seem to have moved on from writing about what money is, what it used to be, or how it operates in the modern world — or the specific ways in which bitcoin differs.
Instead, we’re now writing and thinking about life with bitcoin. Bitcoin has a culture, its virtues and values push its users in certain directions. [Aleks] Svetski writes about classical virtues and how they let us live well on a bitcoin standard. Mekhail writes about how to raise kids with intention and a long-term, orange, focus. In Bitcoin: The Inverse of Clown World, Knut Svanholm and his podcast sidekick Luke de Wolf gives us “a journey of introspection and self-improvement” (page 11). This “is a book about you” (page 13); not that different from how [George] Mekhail thinks about parenting.
It’s an unbelievably entertaining and powerful book, with plenty of food for thought about the insanities of our world. The chapter headings are slick, the chapters themselves digestible and relatable. If a measure of a book is how often I laugh, pull out my highlighter, or incessantly send quotes to friends, then Inverse of Clown World receives excellent marks. It’s the perfect combination of light, relaxed reading and hard-hitting punch — sprinkled with a whole jar of humor.

The allure of Inverse is to see that all the madness in the world — political grandstanding, gender dysphoria, the broad moral, fiscal, and political decay — call out for an explanation. Why is it happening? How did it come to this? It seems so obviously irrelevant and so obviously stupid.
Svanholm and de Wolf have an answer, which “is more straightforward than you might think. When the money stops working, everything becomes political and a farce” (page 51). Shockingly, the book’s main suggestion is that moral and political collapse is downstream of the money.
Hurling us straight off the deep end, the opening chapter is praxeology — that arcane, philosophical foundation for all Austrian economics. We then venture from the highest echelons of academic economics and mathematics to popular culture interpretations of Christopher Nolan’s The Dark Knight, to observations of reciprocal altruism in nature and its counterpart in human internet affairs. High and low, indeed.
Some dozen pages in, it feels like reading a textbook-like description of markets and the stylized economic hypothetical known as the prisoner’s dilemma. The authors draw important conclusions from the modern debate about that game-theoretical exercise: “[economist Robert] Axelrod’s findings emphasized the importance of being friendly and forgiving, but also appropriately retaliatory” (page 19). “The balance between self-interest and cooperative behavior is crucial in the game of life, where decisions shape futures” (page 21).
What that has to do with Clown World is a little unclear, and indeed we must wait some fifty pages to get an inkling of what precisely the authors mean by the label. Then again, if you’ve read Svanholm before or listened to the Bitcoin Infinity Show at all — or, you know, not been cave-bound for the last decade-plus — you have a pretty good idea.
Several descriptions are broad-stroke, which is understandable when you try to capture something roughly meaning “everything stupid”. It’s the desire for free lunches (page 41). It’s where “pleasing bureaucrats becomes increasingly profitable, while providing as much value as possible to your fellow man becomes increasingly futile” (page 50). Clown World directly follows from a political money, “which makes people focus on totally arbitrary issues” (page 65); indeed, most so-called societal problems aren’t even problems. Clown World is equality-focused (page 101). In contrast, Bitcoin is fair, honest, and meritocratic. At the very end of the book, we learn that “Clown World is a byproduct of people not taking responsibility”. From that definition it quickly follows, via self-reflection and better “mental software”, that “Taking responsibility for your actions is the only thing that can make the whole damn circus disappear” (page 163):
”Success in the Bitcoin world comes from providing value to your fellow human beings, not mass theft or political manipulation. Everything Divided by 21 Million equals the inverse of Clown World.”
There is no doubt in my mind that Clown World is indeed disappearing, pulling away its most ardent proponents and last, bitter beneficiaries kicking and screaming. Messrs Svanholm and de Wolf think something similar:
”things such as Bitcoin ATMs will look as ridiculous as phone booths in the not-too-distant future. […] it’s not only the ATMs that will fall into obsolescence. Everything in the Jurassic fiat currency world is on the brink of extinction. Are you a dinosaur or a human being?”
Between the ridiculing of wokeness and climate change worries, we get plenty of advice about screening out noise and guarding one’s time and mind. We get personal chapters about Knut running through the rainy slush of Gothenburg, Sweden, as well as unbelievably lengthy adventures in the Einsteinian spacetime and astrophysics. The far-fetched relevance to Clown World (“our attention also shapes our realities”, page 113) could have been reached without this much extravagance.
We get musings on creativity, stoicism, and what the relationship is between freedom and responsibility. Indeed, “whatever small step you take to increase your personal freedom footprint increases the total level of freedom dioxide in the atmosphere” (page 133).
Why should you read this book at all? It’s simple, really: It’s Knut, it’s funny, and at times it’s pretty inspiring.
Selected quotes:
- “When people know enough about Bitcoin to have stopped worrying about their financial future, they usually care less about how others perceive their words and actions and more about honesty and integrity” (page 53).
- “In a world where correct pronoun assignments, teenaged weather activists, the big game last night, Taylor Swift’s latest boyfriend, and a mostly harmless flu are headline news, it’s easy to see that some force is trying to avert our eyes from the men behind the curtain” (pages 24-25)
- “Clownish political ideas have existed for as long as politics itself. They come in many ways, shapes, and forms, and it can be hard to see their ridiculousness when living among them” (page 36)
Final nugget:
“You’re an absolute winner if you have one more Satoshi this year than last. Zoom out and be patient. Sell your chairs, slay your heroes, and take responsibility for your actions” (page 63).
Disclaimer: Opinions expressed are entirely the author’s and do not necessarily reflect those of BTC Inc or Bitcoin Magazine.

Source link
Bitcoin
Bitcoin Indicator Flashing Bullish for First Time in 18 Weeks, Says Analyst Who Called May 2021 Crypto Collapse

A crypto analyst who nailed the 2021 Bitcoin market meltdown says that a BTC indicator is suddenly flashing bullish.
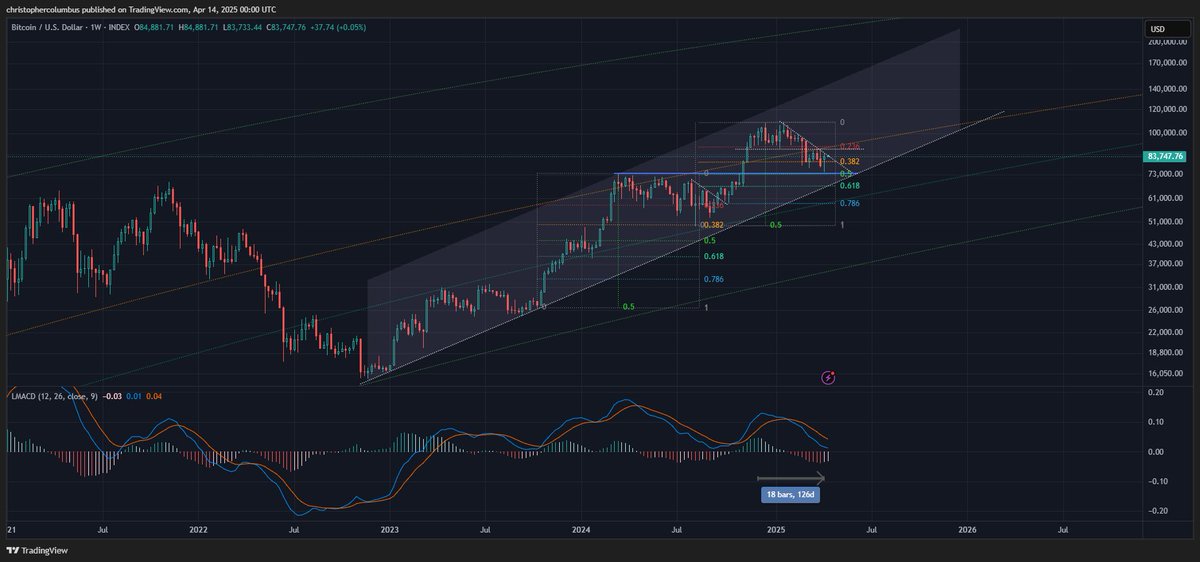
Pseudonymous analyst Dave the Wave tells his 149,300 followers on the social media platform X that Bitcoin’s weekly logarithmic moving average convergence divergence (LMACD) histogram indicator is starting to strengthen, signaling a possible rally.
The LMACD histogram indicator is designed to signal changes in an asset’s trend, strength and momentum. Shrinking bars on the histogram suggest that an asset’s trend momentum is weakening. In Bitcoin’s case, the histogram’s declining red bars may indicate that a market reversal is in sight.
Says Dave the Wave,
“Bull markets climb a wall of worry. First strengthening histogram on the weekly BTC chart in 18 weeks/4.5 months. Weekly MACD itself has not been below the zero-line, in bear territory, since Feb 2023, i.e.; an ongoing bull market. People drop the ball when they ignore the technicals.”
Next up, he looks at the BTC/gold ratio, which is the value of Bitcoin relative to the price of gold. Based on the trader’s chart, he appears to suggest that the BTC/gold ratio may have topped out, indicating that Bitcoin may soon outperform gold.
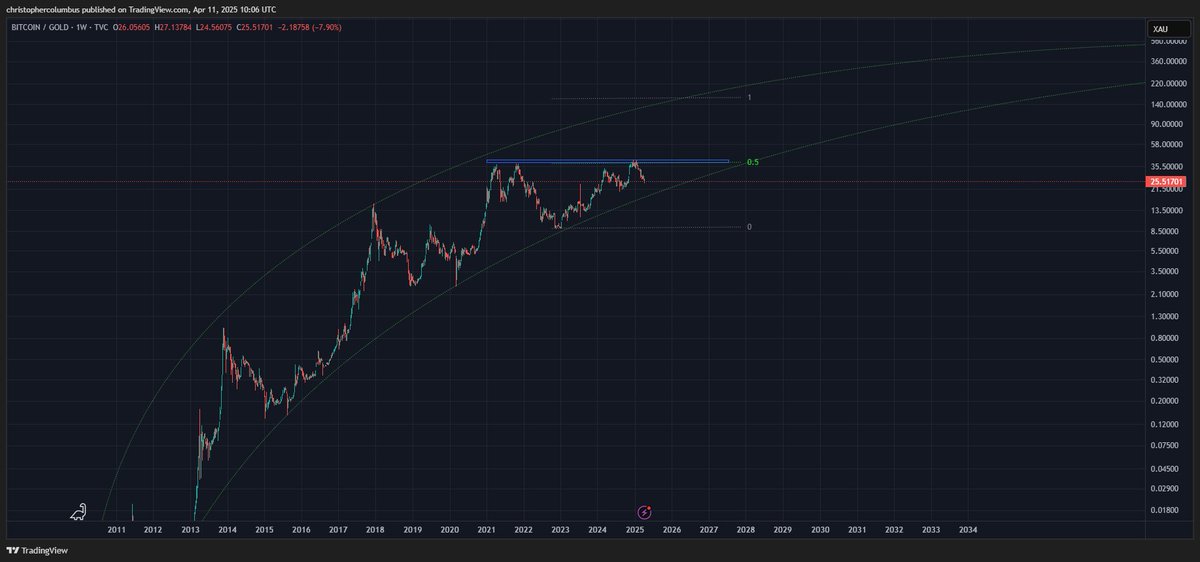
Lastly, Dave the Wave shares a chart that shows BTC has been out of the “buy zone” of his logarithmic growth curve (LGC) since it was last trading around $40,000.
The LGC aims to forecast Bitcoin’s market cycle highs and lows while filtering out short-term volatility.
“Back when BTC was half the price that was the last time it hit the LGC ‘buy zone.’”
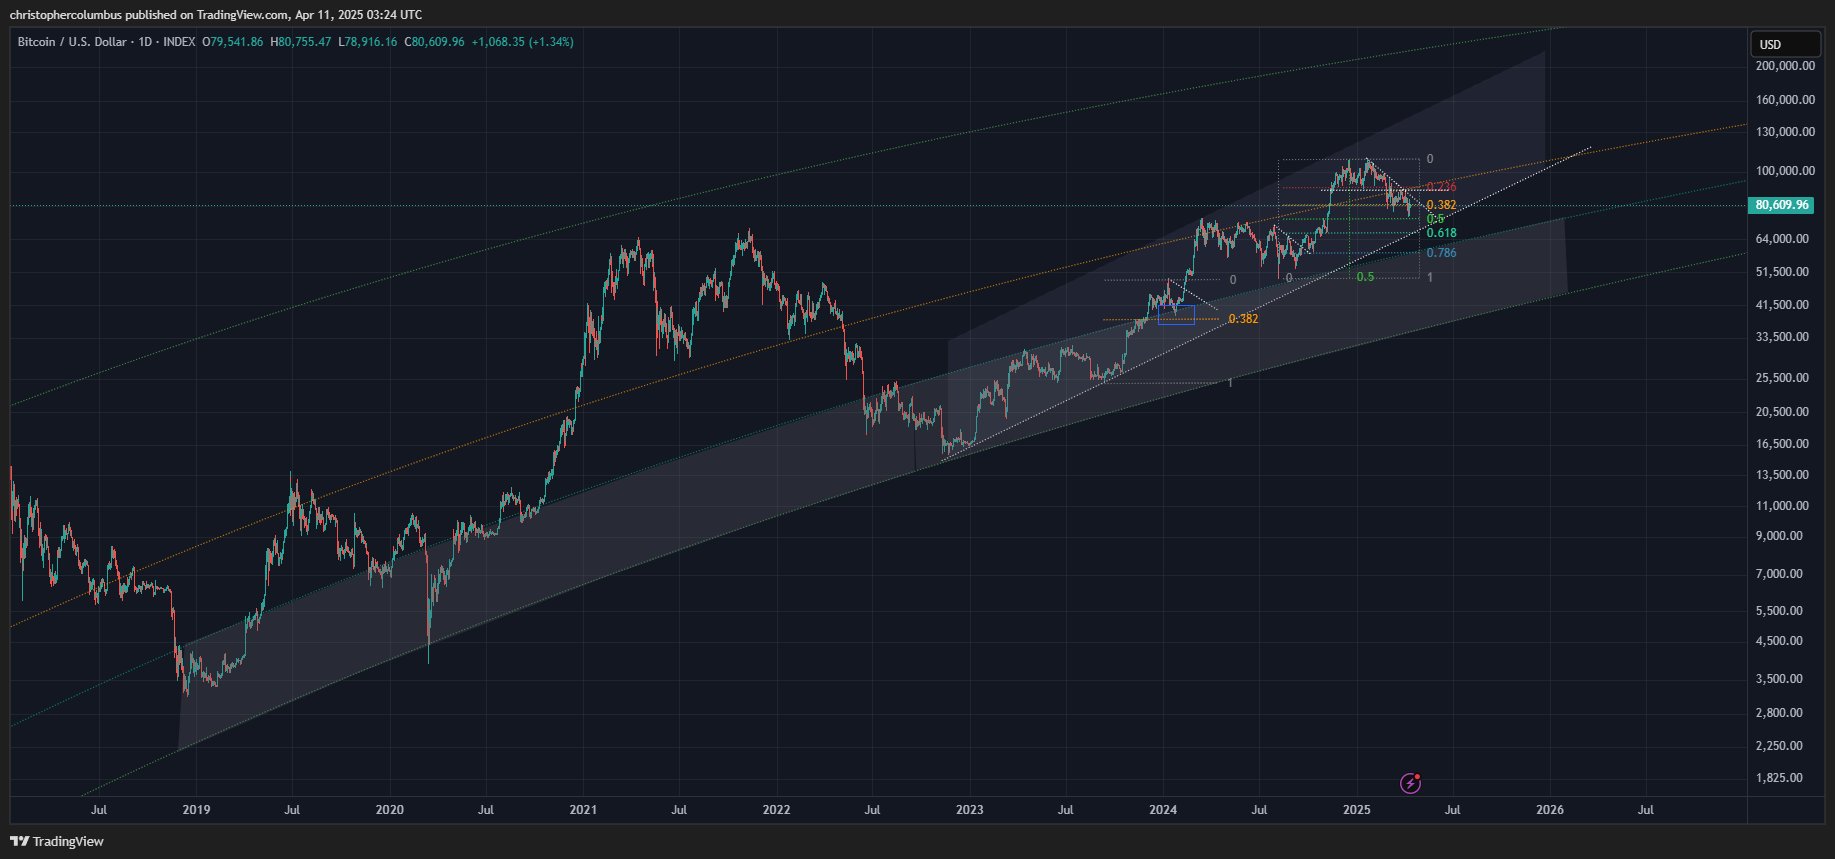
Bitcoin is trading for $84,459 at time of writing, flat on the day.
Follow us on X, Facebook and Telegram
Don’t Miss a Beat – Subscribe to get email alerts delivered directly to your inbox
Check Price Action
Surf The Daily Hodl Mix
 

Disclaimer: Opinions expressed at The Daily Hodl are not investment advice. Investors should do their due diligence before making any high-risk investments in Bitcoin, cryptocurrency or digital assets. Please be advised that your transfers and trades are at your own risk, and any losses you may incur are your responsibility. The Daily Hodl does not recommend the buying or selling of any cryptocurrencies or digital assets, nor is The Daily Hodl an investment advisor. Please note that The Daily Hodl participates in affiliate marketing.
Generated Image: Midjourney
Source link
The U.S. dollar index remains under pressure as Donald Trump’s tariffs push investors to other currencies.
The DXY index was trading at $99.95 on Tuesday, down by 9.20% from its highest level this year. It has also been hovering at its lowest point since July 2023, and a death cross it formed points to more downside in the coming months.
The US dollar index could crash further
More technical signals show that the U.S. dollar index has further downside potential. It has formed an inverse cup and shoulders pattern whose depth is about 9%. Measuring the same distance from the lower side of the cup points to further downside to $91.

Further, a key survey of institutional investors shows that most of them are bearish on the currency as the trade war continues. Sixty-one percent of respondents in Bank of America’s Global Fund Manager Survey see the greenback falling in the next 12 months. This is the most bearish these fund managers have been since 2006.
These investors are concerned about Trump’s policies and their economic impact. The most urgent fear is tariffs, which analysts expect will affect the economy. Many fund managers believe the U.S. will sink into a recession this year.
While Trump has walked back some tariffs, those on China remain at uncomfortable levels. Most Chinese goods flowing to the United States will receive a 145% tariff, affecting goods worth hundreds of billions of dollars. On Tuesday, Beijing announced that it would block Boeing purchases by its airlines.
Further, the U.S. dollar index has dropped as Congress negotiates Trump’s funding bill, which includes $4.5 trillion in tax cuts.
A falling US dollar could benefit Bitcoin and most altcoins
A deteriorating US dollar index could benefit Bitcoin (BTC) and altcoins for three reasons. First, most of these coins are traded in Tether, a stablecoin backed by the U.S. dollar. As such, a weakening greenback makes Bitcoin and these altcoins more affordable.
Second, the ongoing dollar weakness is likely due to concerns about the American economy and the impact of tariffs. As such, there is a likelihood that the Federal Reserve will intervene and slash interest rates. Some Fed officials, like Christopher Waller and Susan Collins, have confirmed that the bank is ready to act in the event of a recession.
Third, Bitcoin and altcoins could benefit as the U.S. dollar index falls because they are often considered safe havens. While Bitcoin’s price has dropped this year, it has performed better than the stock market.
Source link

Futureverse Acquires Candy Digital, Taps DC Comics and Netflix IP to Boost Metaverse Strategy
Court Grants Ripple And SEC’s Joint Motion To Suspend Appeal

AVAX Falls 2.1% as Nearly All Assets Trade Lower

What is a VTuber, and how do you become one in 2025?

Top Expert’s Update Sets $10 Target

How Academia Interacts With The Bitcoin Ecosystem

AB DAO and Bitget Launch Dual Reward Campaign, Distributing $2.6M Worth of $AB Globally

AI crypto tokens at risk as Nvidia faces restrictions on China exports

Coinbase Urges Australia to Vote for Crypto Progress in May

How High Would Pi Network Price Go If Pi Coin Adopts Transparency to Avoid Mantra Pitfalls

XRP’s ‘Rising Wedge’ Breakdown Puts Focus on $1.6 Price Support

China selling seized crypto to top up coffers as economy slows: Report

Ethereum Price Dips Again—Time to Panic or Opportunity to Buy?

The Inverse Of Clown World”

Bitcoin Indicator Flashing Bullish for First Time in 18 Weeks, Says Analyst Who Called May 2021 Crypto Collapse


 24/7 Cryptocurrency News5 months ago
Arthur Hayes, Murad’s Prediction For Meme Coins, AI & DeFi Coins For 2025

 Bitcoin3 months ago
Expert Sees Bitcoin Dipping To $50K While Bullish Signs Persist

 24/7 Cryptocurrency News3 months ago
Aptos Leverages Chainlink To Enhance Scalability and Data Access

 Bitcoin5 months ago
Bitcoin Could Rally to $80,000 on the Eve of US Elections

 Opinion5 months ago
Crypto’s Big Trump Gamble Is Risky

 Altcoins3 months ago
Sonic Now ‘Golden Standard’ of Layer-2s After Scaling Transactions to 16,000+ per Second, Says Andre Cronje

 Bitcoin5 months ago
Institutional Investors Go All In on Crypto as 57% Plan to Boost Allocations as Bull Run Heats Up, Sygnum Survey Reveals

 Price analysis5 months ago
Ripple-SEC Case Ends, But These 3 Rivals Could Jump 500x
